

This research represents a detailed Litho-stratigraphic characterization of Precambrian basement complex by integrating geophysical log and drilling data of GDH-76 from technical reports of the Geological Survey of Bangladesh (GSB). It is a re-evaluation of a Borehole data by interpreting drilling parameter and interval-averaged geophysical log data. A high-resolution petro-physical “fingerprint” of the Northwestern Bangladesh basement complex is identified by integrated cross-plot analysis. This study delineates a six subsurface zones by correlated Rate of Penetration (ROP), Percentage of Core Recovery, Magnetic Susceptibility, Gamma-Resistivity signatures. The Result shows a distinct 6 meter weathered transition zone (200-206 m) characterized by low core recovery (45%) and moderate ROP (1.02 m/hr). The basement entry at 206 m is marked by moderate to high (0.46 to 1.1 m/hr) in ROP and moderate resistivity (72.5 ohm-m) indicating weathered condition. Notable feature include a 15-meter thick magnetic anomaly zone (295-310 m), identified with a peak susceptibility of 1130 cgs unit, suggesting a mineralization zone. Moreover, a high-gamma unit (318-336 m) exhibiting a value of 375 cps (peak value) with extremely low ROP (0.132 m/hr) indicates a high strength potassium-rich felsic lithology. Furthermore, the research also pinpointed the F39 fault boundary between two boreholes.
| Published in | Earth Sciences (Volume 15, Issue 4) |
| DOI | 10.11648/j.earth.20261504.14 |
| Page(s) | 193-204 |
| Creative Commons |
This is an Open Access article, distributed under the terms of the Creative Commons Attribution 4.0 International License (http://creativecommons.org/licenses/by/4.0/), which permits unrestricted use, distribution and reproduction in any medium or format, provided the original work is properly cited. |
| Copyright |
Copyright © The Author(s), 2026. Published by Science Publishing Group |
Lithostratigraphic Characterization, Cross-plot Analysis, Precambrian Basement Complex, Drilling Parameter, Petro-physical Fingerprint, Gamma-Resistivity Signatures
Depth (m) | Magnetic susceptibility (in cgs unit) | Gamma Value (cps) | Resistivity (Ohm-m) | Rate of Penetration (ROP) (m/hr) | Percentage of Core Recovery (%) | Zone classification |
|---|---|---|---|---|---|---|
0-200 | Not recorded | Not recorded | Not recorded | 2.03 at 199 m depth | 90.13 at 199 m depth | Sedimentary overburden |
200-206 | Not recorded | Not recorded | Low (average value 47.5) | Moderate (range 0.5-1.02) | Low (45) | Weathered Transition Zone |
206-295 | Low (average value-992) | Moderate (average value 185) | Moderate (average value 72.5) | Moderate to high (range 0.46-1.1) | High 100 (from 253m to 260 m value is 83.5) | Fractured/weathered felsic crystalline basement |
295-310 | High (average value -1130) | Moderate (average value - 205 | Moderate (average value 75.5) | High to moderate (range 1.18 -0.39) | High (100) | Fresh intermediate basement with magnetic Anomaly Zone |
310-318 | Very low (average value -955) | low (average value 140) | High (average value 87.5) | Moderate to high (range 0.39-1.18) | High to moderate (range 100-90) | Precambrian Granitic Gneiss Basement |
318-336 | Moderate (average value 1075) | Very High (peak value -375) | Very High (average value 150) | High to Very low (range 1.22 -0.05) | High to moderate (range 100-84.4) | Mineralized Potassic-Crystalline Complex Basement |
GSB | Geological Survey of Bangladesh |
ROP | Rate of Penetration |
Vs | Versus |
| [1] | Alam, M., et al., 2003. An overview of the sedimentary geology of the Bengal Basin in relation to the regional tectonic setting. Journal of Asian Earth Sciences, 21(9), 1035-1047. |
| [2] | Alam, M. K., Hasan, A. K. M. S., Khan, M. R., Whitney, J. W., 1990. Geological map of Bangladesh, GSB publication, Dhaka. |
| [3] | Bakr, M. A., and others., 1996. Geology and Coal Deposit of Barapukuria Basin, Dinajpur District, Bangladesh, Geological Survey of Bangladesh Records, vol-8, part-1. |
| [4] | Brammer, H, 1996. The Geography of the Soils of Bangladesh. University Press Limited, Dhaka. |
| [5] | Burke, J. A., Campbell, R. L., & Schmidt, A. W., 1969. The Litho-Porosity Crossplot: A New Concept for Determining Porosity and Lithology in Complex Formations. The Log Analyst, 10(06). 2, Open Journal of Geology, Vol. 6 No. 8, August 17, 2016. |
| [6] | Fertl, W. H., 1981. Openhole Crossplot Concepts: A Powerful Technique in Well Log Analysis. Journal of Petroleum Technology, 33(03), 535-549, |
| [7] | Hunting 1981 Interpretation and operations reports of an aeromagnetic survey of Bangladesh, Hunting geology and Geophysics ltd. Boreharmwood, Hertfordshire, England, 43p. |
| [8] | Imam, B., 2013. Energy Resources of Bangladesh: Natural Gas, Oil, Coal (2nd ed.). University Grants Commission of Bangladesh. |
| [9] | Islam, M. S., & Alam, M. J., 2014. Geological Aspects of Soil Formation of Bangladesh. Proceedings of the 2nd International Conference on Advances in Civil Engineering (ICACE), CUET, Chittagong, Bangladesh. |
| [10] | Khan, A. A., & Rahman, T., 1992. An analysis of the gravity field and tectonic evaluation of the northwestern part of Bangladesh. Tectonophysics, 206(3-4), 351-364, |
| [11] | Khan, F. H., 1991. Geology of Bangladesh. University Press Limited, Dhaka. |
| [12] | Masum, M., Hoque, M. N., Akbar, M. A., Mahmud, Z., Rana, M. S., Razzaque, M. A., & Al Amin, M., 2021. Geology and Precambrian Banded Iron Formation formed at Rangpur Platform in Bangladesh. International Journal of Engineering Research and Development, 17(3), pp. 43-57. |
| [13] | Rahman, M. A., & Khan, M. A. R., 1994. Subsurface geology of the Madhyapara area, Dinajpur district, Bangladesh. Journal of the Geological Society of Bangladesh, Vol. 13, pp. 27-36. |
| [14] | Rahman, M. S., Hossain, M. S., & Khan, A. A., 2014. Interpretation of Magnetic Anomalies over the Precambrian Basement in Northwestern Bangladesh. Journal of the Geological Society of India, 84(2), 205-214. |
| [15] | Rana, M. M., Islam, M. M., Islam, Md, M., Khan, M. N. H., Elahi, M. A., and Rokonuzzaman, Md., 2022 Keshabpur Drilling Program (GDH-76/21) Chirirbandar, Dinajpur GSB Unpublished report, GSB/DATA/UR-915, |
| [16] | Reimann, K.-U., & Hiller, K. (1993). Geology of Bangladesh. Beiträge zur regionalen Geologie der Erde, Vol. 20. Gebrüder Borntraeger, Stuttgart, 160 pp. |
| [17] | Reza, M. S. Uddin, M. Z. and Nury, S. N., 2024. Interpretation of Geophysical logs of the Borehole GDH-76 in Chirirbandar Upazila of Dinajpur District, Bangladesh, GSB Unpublished report, GSB/DATA/UR-940. |
| [18] | Shahjanan, Md., Uddin, M. Z., and Nahar, N., 2024. Gravity Signatures of Kutubpur Magnetic Body and adjoining areas, Parbatipur and Chiribandar Upazilas, Dinajpur District, Bangladesh. Proceedings of the 2nd National Seminar on Geology for the Sustainable Development of Bangladesh, GSB, Dhaka, pp. 291-299. |
| [19] | Zoback, M. D. (2010). Reservoir Geomechanics. Cambridge University Press. |
APA Style
Nahar, N., Monira, M. S., Reza, M. S., Uddin, M. Z., Nury, S. N., et al. (2026). Subsurface Lithostratigraphic Characterization Using Integrated Log and Cross-Plot Analysis: Re-evaluation of a Borehole in Chirirbandar, Dinajpur, Bangladesh. Earth Sciences, 15(4), 193-204. https://doi.org/10.11648/j.earth.20261504.14
ACS Style
Nahar, N.; Monira, M. S.; Reza, M. S.; Uddin, M. Z.; Nury, S. N., et al. Subsurface Lithostratigraphic Characterization Using Integrated Log and Cross-Plot Analysis: Re-evaluation of a Borehole in Chirirbandar, Dinajpur, Bangladesh. Earth Sci. 2026, 15(4), 193-204. doi: 10.11648/j.earth.20261504.14
AMA Style
Nahar N, Monira MS, Reza MS, Uddin MZ, Nury SN, et al. Subsurface Lithostratigraphic Characterization Using Integrated Log and Cross-Plot Analysis: Re-evaluation of a Borehole in Chirirbandar, Dinajpur, Bangladesh. Earth Sci. 2026;15(4):193-204. doi: 10.11648/j.earth.20261504.14
@article{10.11648/j.earth.20261504.14,
  author = {Nazmun Nahar and Mst Sirajum Monira and Md. Selim Reza and Mohammad Zohir Uddin and Sultana Nasrin Nury and Mohammad Ferozur Rahaman},
  title = {Subsurface Lithostratigraphic Characterization Using Integrated Log and Cross-Plot Analysis: Re-evaluation of a Borehole in Chirirbandar, Dinajpur, Bangladesh},
  journal = {Earth Sciences},
  volume = {15},
  number = {4},
  pages = {193-204},
  doi = {10.11648/j.earth.20261504.14},
  url = {https://doi.org/10.11648/j.earth.20261504.14},
  eprint = {https://article.sciencepublishinggroup.com/pdf/10.11648.j.earth.20261504.14},
  abstract = {This research represents a detailed Litho-stratigraphic characterization of Precambrian basement complex by integrating geophysical log and drilling data of GDH-76 from technical reports of the Geological Survey of Bangladesh (GSB). It is a re-evaluation of a Borehole data by interpreting drilling parameter and interval-averaged geophysical log data. A high-resolution petro-physical “fingerprint” of the Northwestern Bangladesh basement complex is identified by integrated cross-plot analysis. This study delineates a six subsurface zones by correlated Rate of Penetration (ROP), Percentage of Core Recovery, Magnetic Susceptibility, Gamma-Resistivity signatures. The Result shows a distinct 6 meter weathered transition zone (200-206 m) characterized by low core recovery (45%) and moderate ROP (1.02 m/hr). The basement entry at 206 m is marked by moderate to high (0.46 to 1.1 m/hr) in ROP and moderate resistivity (72.5 ohm-m) indicating weathered condition. Notable feature include a 15-meter thick magnetic anomaly zone (295-310 m), identified with a peak susceptibility of 1130 cgs unit, suggesting a mineralization zone. Moreover, a high-gamma unit (318-336 m) exhibiting a value of 375 cps (peak value) with extremely low ROP (0.132 m/hr) indicates a high strength potassium-rich felsic lithology. Furthermore, the research also pinpointed the F39 fault boundary between two boreholes.},
 year = {2026}
}
TY  - JOUR
T1  - Subsurface Lithostratigraphic Characterization Using Integrated Log and Cross-Plot Analysis: Re-evaluation of a Borehole in Chirirbandar, Dinajpur, Bangladesh
AU  - Nazmun Nahar
AU  - Mst Sirajum Monira
AU  - Md. Selim Reza
AU  - Mohammad Zohir Uddin
AU  - Sultana Nasrin Nury
AU  - Mohammad Ferozur Rahaman
Y1  - 2026/08/22
PY  - 2026
N1  - https://doi.org/10.11648/j.earth.20261504.14
DO  - 10.11648/j.earth.20261504.14
T2  - Earth Sciences
JF  - Earth Sciences
JO  - Earth Sciences
SP  - 193
EP  - 204
PB  - Science Publishing Group
SN  - 2328-5982
UR  - https://doi.org/10.11648/j.earth.20261504.14
AB  - This research represents a detailed Litho-stratigraphic characterization of Precambrian basement complex by integrating geophysical log and drilling data of GDH-76 from technical reports of the Geological Survey of Bangladesh (GSB). It is a re-evaluation of a Borehole data by interpreting drilling parameter and interval-averaged geophysical log data. A high-resolution petro-physical “fingerprint” of the Northwestern Bangladesh basement complex is identified by integrated cross-plot analysis. This study delineates a six subsurface zones by correlated Rate of Penetration (ROP), Percentage of Core Recovery, Magnetic Susceptibility, Gamma-Resistivity signatures. The Result shows a distinct 6 meter weathered transition zone (200-206 m) characterized by low core recovery (45%) and moderate ROP (1.02 m/hr). The basement entry at 206 m is marked by moderate to high (0.46 to 1.1 m/hr) in ROP and moderate resistivity (72.5 ohm-m) indicating weathered condition. Notable feature include a 15-meter thick magnetic anomaly zone (295-310 m), identified with a peak susceptibility of 1130 cgs unit, suggesting a mineralization zone. Moreover, a high-gamma unit (318-336 m) exhibiting a value of 375 cps (peak value) with extremely low ROP (0.132 m/hr) indicates a high strength potassium-rich felsic lithology. Furthermore, the research also pinpointed the F39 fault boundary between two boreholes.
VL  - 15
IS  - 4
ER  -
Geophysics Branch, Geological Survey of Bangladesh, Dhaka, Bangladesh
Geophysics Branch, Geological Survey of Bangladesh, Dhaka, Bangladesh
Geophysics Branch, Geological Survey of Bangladesh, Dhaka, Bangladesh
Geophysics Branch, Geological Survey of Bangladesh, Dhaka, Bangladesh
Geophysics Branch, Geological Survey of Bangladesh, Dhaka, Bangladesh
Departmen of Resilience and Risk Management, Palli Karma-Sahayak Foundation (PKSF), Dhaka, Bangladesh
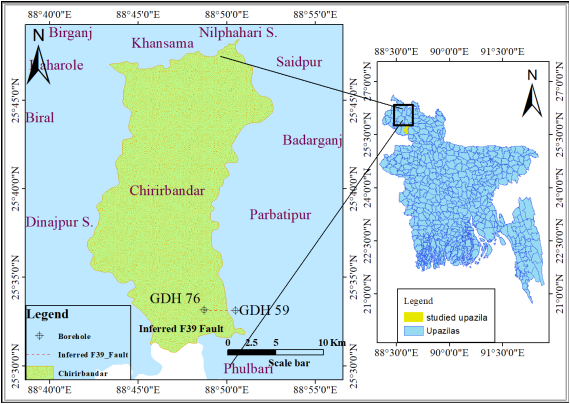
Figure 1. Schematic location map of the study area outlining the concession boundaries and the precise coordinates of drill hole GDH 76.
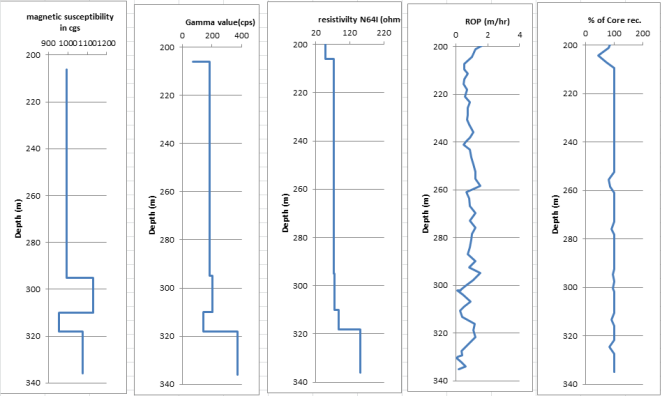
Figure 2. Composite log of geophysical and drilling parameters from depth 200 to 340 m. This combined dataset was then evaluated to identify shifts in subsurface rock composition (lithology) and establish electrofacies boundaries.
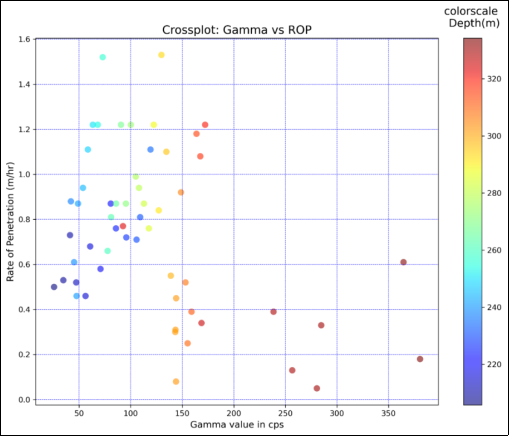
Figure 3. Cross-plot analysis of Gamma Ray against Rate of Penetration (ROP) relative to depth. The graph illustrates specific shifts in log responses used to distinguish between various subsurface zones.
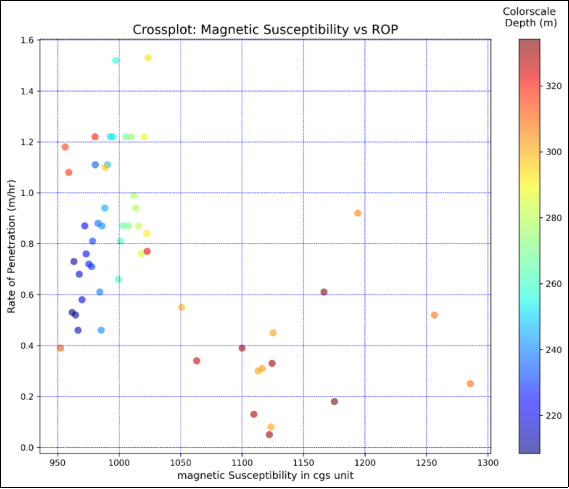
Figure 4. Cross-plot analysis of Magnetic Susceptibility against Rate of Penetration (ROP) along a depth profile. The plot highlights distinct log response changes used to differentiate subsurface zones.
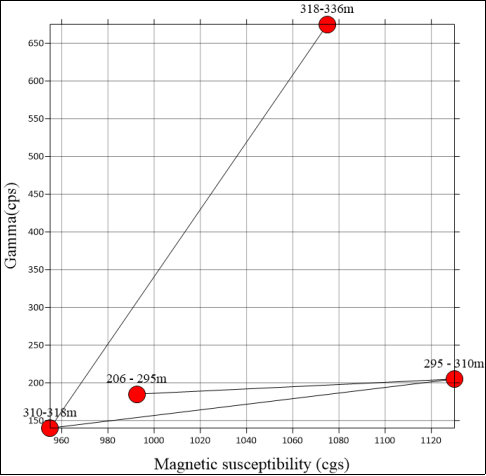
Figure 5. Cross-plot of interval-average value of Magnetic Susceptibility (cgs) versus Gamma Ray (cps) across depth zones. The data points illustrate average log response changes across designated subsurface depth zones.
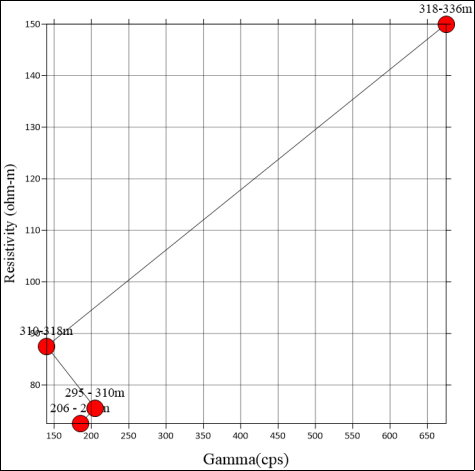
Figure 6. Cross-plot analysis of Gamma Ray against Resistivity relative to depth. This graph illustrates shifts in wireline log signatures, which are utilized to define lithostratigraphic boundaries and categorize electrofacies across studied section.
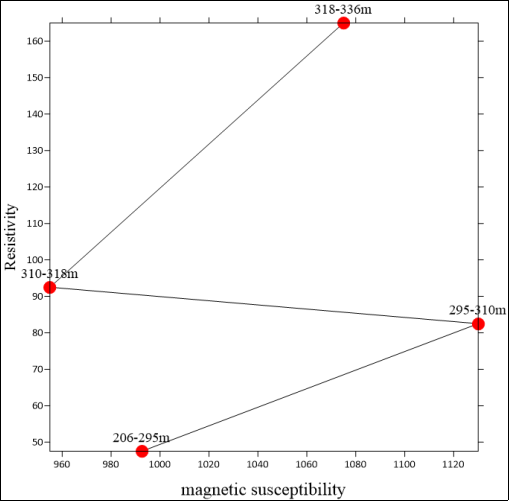
Figure 7. Cross-plot analysis of Magnetic susceptibility (cgs) versus Resistivity (ohm-m) relative to depth.
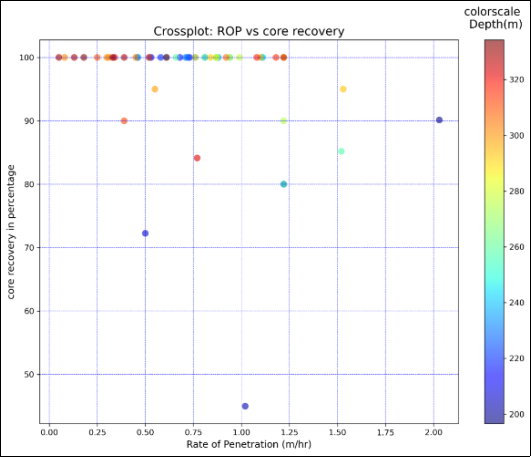
Figure 8. Cross-plot analysis of Rate of Penetration (m/hr) versus Percentage of core recovery, highlighting an inverse relationship between drilling speed and rock competency.

Information


 Share This Article
 Twitter
 Linked In
 Facebook
 Copy
Copy Download