2. Background
Masvingo City can be defined as a water-scarce community where many people are living with less water than they need, whether it is for consumption, industrial or agricultural purposes,
| [21] | Makaya, Eugine. 2015. "Water loss management strategies for developing countries: Understanding the dynamics of water leakages." 34-56. |
[21]
. The availability of water to consumers depends on the balance between amount supplied and the amount in demand. Treated water remains scarce in Masvingo City economically because of an absence of interest in framework, innovation or inadequate human ability to reduce the physical or real treated water losses through leakages along the water supply and distribution channel. The only provider of treated and piped water to the Masvingo urban community, Masvingo City Council, is faced with the challenge of economic water scarcity resulting from poor management of the water distribution channel. The demand for treated water in urban communities, particularly Masvingo City, has always exceeded supply due to the growing population in urban areas through urbanization, loss of treated water before it reaches the consumers owing to burst pipes and poor water management in the town. Much of the treated water is lost before reaching the consumers in form of non-revenue water through real or physical water loss caused by pipe leakages. Several efforts have been made to reduce water scarcity including supply management strategies such as supplying water to residents in bowsers at some designated water collecting points and demand management such as water usage restrictions, pricing and rationing. However, these efforts have not been innovative therefore the community continues to face water scarcity as the water supply remains lower than demand. This has called for an exploration to find innovative information system strategies such geographic information system which will be useful in reducing the water losses along the water supply chain, improving the water supply side and making Masvingo City a water-secure community.
2.1. Equations
Within Masvingo City community, at least 40% of treated water is lost along the water supply and distribution channel through leakages before reaching households. This is evidenced in
that out of 25 mega litres of treated water being pumped daily at the Bushmead Water Works only 15 mega litres manage to reach the rate payers. Efforts that have been put to deter/reduce water loss along water distribution channel include less innovative strategies such as periodic physical inspections of pipe leaks along the water distribution channel for repairs during the day. The possible causes of the physical/real water losses in transit along the water supply chain are leaks because of ageing water supply and distribution infrastructure, pipes leakages and human intentional pipe break to draw water for free. The physical/real loss of treated water has caused water shortages affecting both the domestic and industrial water consumers. This has also affected the Council in terms of reduction in water revenue as some treated water is lost without being paid for by the consumers translating to financial losses to the Council. These water shortages have been evidenced by some areas in Masvingo receiving water for few hours between 2am and 6am, while some are completely dry as the city grapples with strict water rationing,
| [18] | Kingdom, W., Liemberger, R., & Marin, P. 2006. The Challenge of Reducing Non-Revenue Water (NRW) in Developing Countries: How the Private Sector Can Help: A Look at Performance-Based Service Contracting (Water Supply and Sanitation Sector Board Discussion Paper 8). New York: The World Bank. |
[18]
and an increase in non-revenue water to 40% from 2018 to 2019. This then justifies the need for a study which will come up with a geographic information system framework that will reduce water losses along the supply chain to improve its supply to the consumers.
2.2. Research Questions
1) How can geographic information system framework be used to reduce the water losses treated along the water distribution channel by Masvingo City?
2) How useful is geographic information system and water pressure sensors in reducing real/physical water losses and improving water supply within the City of Masvingo?
3) What challenges does the Council face in the implementation of ICT in the management and distribution of water?
2.3. Research Aim
The aim of this study is to come up with a generic GIS framework for mapping and real-time leakage monitoring and detection in water distribution networks to transform a water scarce community into a water secure community.
2.4. Research Objectives
This aim of the study can be achieved through the following sub-objectives:
1) To develop a geographic information system framework that can be used to reduce the treated water losses along the water distribution channel by Masvingo City.
2) To evaluate the usefulness of geographic information system and water pressure sensors in reducing real/physical water losses and improving water supply within the City of Masvingo.
3) To examine the challenges faced by the Council in the implementation of ICT in the management and distribution of water.
3. Literature Review
Research gap
Various studies have been carried out looking into loss of treated water along the water supply chain as a challenge to the various communities, causing acute water scarcity. The studies investigated water scarcity or shortage as a situation where water supply is less than the demand because of various factors such as non-revenue water which includes real/physical losses along the water supply chain. Studies have revealed that strategies to improve water supply were traditional in nature as they did not make any contribution to the water supply chain. These includes a traditional way of carrying water bowsers to the people at various water collecting points, water rationing and water pricing. Some studies such as
put much emphasis on traditional methods of water supply strategies such as roof water harvesting for drinking, fog water harvesting, quality management and low-cost water treatments where technology plays little or no role. Most of the approaches to water loss management in the literature are passive approaches. These passive approaches relied solely on engineering and repairing solutions on significant or reported leaks. However, there is need for innovative approaches which are proactive focusing on the improvement of water supply through prevention of water losses and improving on the water supply efficiency through ICT not just engineering or traditional approaches.
| [6] | Chalinder, A. 1994. Emergency Water Sources: Guidelines for Selection and Treatment. Water, Engineering and Development Centre (WEDC). Loughborough University. |
[6]
proposed improvements in quality water supply (sanitation) through emergency response programs, through agencies and education initiatives but this does not deal with the water supply chain.
carried out a study on prepaid water meters in Nakuru, Kenya on how it improves water supply. According to
, communal prepaid meters (CPM) were installed in Nakuru to improve the quality of water service delivery to 15,000 people in the six low-income settlements in Nakuru. The study showed that the prepayment system did not improve the supply as such but suppressed demand through reduction in unmetered consumption, inaccuracies in registration of water meters and illegal consumption. In this case there were fewer improvements in the supply side of water.
Potential contribution
This study therefore seeks to find innovative strategies which are technical oriented and proactive` where ICT is used to improve water supply through improvements in both water demand and supply chain management. This is unlike the traditional way of distributing water in bowsers to collecting points or passive approaches relying solely on engineering, water pricing and billing. The ICT solutions must encompass mapping and monitoring of the water distribution network using ArcGIS and real-time leak detection in the network through water pressure sensors to reduce its loss as it is distributed to the consumption points.
The ICT strategy should deal more with economic scarcity of water other than physical scarcity thereby contributing to the - of real water loss which is a major component of non-revenue water.
Water scarcity in general
Sustainable water resource management including provision of safe and adequate water supply faces enormous challenges in many countries and regions. Despite its global availability and renewable characteristic, one-fifth of the population in the world lives under water scarcity conditions,
.
Water scarcity, according to
| [35] | Thornton, Julian. 2007. "Managing leakage by managing pressure." |
[35]
refers
to the lack of sufficient water resources within a region to meet the demands of water usage and this involves water stress, water shortage and water crisis. They also suggest that water scarcity is both a natural and a human-made phenomenon meaning to say it can be caused either by nature or human factors, hence natural/physical and economic water scarcity. They also suggest that water scarcity is both a natural and a human-made phenomenon meaning to say it can be caused either by nature or human factors, hence natural/physical and economic water scarcity.
Physical water scarcity
Physical scarcity occurs when there is not enough water to meet all demands, including environmental flows
| [11] | Giordano, Meredith. 2019. Sustainable Food and Agriculture. Olcay Ünver. |
[11]
. Arid regions are most often associated with physical water scarcity when water resources are overcommitted to various users. In such cases, there simply is not enough water to meet both human demands and environmental flow needs. In the case of Masvingo City, water from Lake Mutirikwi which is the source of raw water for the city is also used for irrigating sugarcane estates in Triangle and Hippo Valley, hence, sometimes affecting the availability of raw water for urban consumption in Masvingo city, especially during dry seasons
. The City of Masvingo is situated in a drought prone area of agro-ecological zones IV and V, with an average rainfall of 600mm per annum
and this means that by nature Masvingo receives insufficient rains and is under physical water scarcity. This means that water is by nature scarce within this region. The physical water scarcity is a "physical problem" that occurs when there is no water available in any form. Physical water scarcity can be further divided into two main concepts which are demand-driven scarcity (water stress) and population-driven scarcity (water shortage),
.
Demand-driven scarcity can be measured by examining quantity of water withdrawn from various sources such as rivers and aquifers, known as the use-to-availability index
| [37] | Wallace, J. M. 1987. Water Resources Development: Planning, Evaluation, and Management. New York. |
[37]
. The shortage of water has a relationship to the number of people that have to share each unit of water resources and can be measured by using the water crowding index, or the Falkenmark water stress index which is suggested by
| [8] | Falkenmark, M, A Berntell, A Jagerskog, J Lundqvist, M Matz, and H Tropp. 2007. "On the verge of a new water scarcity: a call for good governanceand human ingenuity SIWI Policy Brief." Stockholm: Stockholm International Water Institute (SIWI), 114-22. |
[8]
. It notable that various categories of water demand exist, water for industrial and municipal supply being the main one then agricultural use and environmental needs.
Eco-nomic water scarcity
Economic water scarcity is aligned to the economic challenges in relation to water supply. So economic water scarcity is thought of as a "money problem” meaning it occurs when the water is present, but it is not possible for people to use it because of lack of proper technology, human, financial and/or institutional resources. Where water is available but not sufficiently easy to access
| [28] | Narkami, Gopal. 2003. "Community and Rural Development - Social Welfare Council Nepal." |
[28]
. Economic water scarcity is entirely a lack of good governance and compassion that allows water shortage to persist and is the most disturbing form of water scarcity.
suggests that economic water scarcity exists when a population does not have the necessary monetary or economic means to utilize an adequate source of water.
According to
, much of sub-Saharan Africa and developing countries suffers under the effects of economic water scarcity as it results from negative effects of retarded economies. Economic water scarcity means an unequal distribution of water resources because of various human factors, independent of nature such as political and ethnic conflicts.
Economic water scarcity is caused by a lack of investment in water or a lack of human capacity to meet the water demand, even where water is in abundance
. Economic water scarcity symptoms include inadequate water infrastructure development, people having challenges in getting enough water for domestic and other purposes; high vulnerability to seasonal fluctuations such as floods and drought; and inequitable water distribution, even when infrastructure exists.
According to
economic water scarcity is due to a lack of water infrastructure in general or to the poor management of water resources where infrastructure is in place. According to
, FAO estimates that more than 1.6 billion people face economic water shortage. In places where water is economically scarce, usually there is sufficient raw water naturally to meet both environmental and human needs, but access to the water resource is very limited. Economic water scarcity is also because of uncontrolled water use for agriculture or industry mostly at the expense of the general population. Major inefficiencies in water use because of economic undervaluing of water as a finite natural resource, can also contribute to its scarcity.
Nearly 25% of The World's Population Faces a Water Crisis, within the past hundred years, water use has been growing at more than twice the rate of the human population
. As the supplies of water continues to shrink, some parts of the world are facing a looming crisis.
Water loss
Water loss is the amount of distributed drinking water that does not reach customers, and that water utilities therefore do not receive payment for
. Water loss is calculated as the percentage of the total distribution or as cubic metres per network kilolitre per annum.
| [16] | Jan-Peter Mund. 2019. University for Sustainable Development (HNEE). Germany: Eberswalde. |
[16]
suggests that those losses include any water that has entered the networks following treatment and fails to get through to consumers/customers. The losses are mostly from underground leaks on water-mains and water service pipes.
Water loss as experienced by Masvingo city water distribution network is equated to that defined by
where there is physical escape of water from the pressurized piping system as leakage, an occurrence known as real losses.
Water losses in supply systems are best known as the result of poor quality or degradation of infrastructure, commonly referred to as "real" losses and can be reduced through control and combatting of water leaks and appropriate strategies for renewal of network programs
| [24] | Mathis. 2008. Water21 Article No 6. London: IWA Publishing. |
[24]
. It is also suggested that there is another aspect of water loss which is "economic" or "apparent" losses
| [24] | Mathis. 2008. Water21 Article No 6. London: IWA Publishing. |
[24]
. This component arises from situations of losses from unauthorized use of water, such as theft, often reflecting urban structure (or lack thereof) and local customs, as well as situations of water usage without metering or tampering with metering systems, inadequate metering policies or an asset management policy that does not sufficiently consider the losses from.
Water loss can be calculated as:
(A + L + R) [d] × flow rate [m3/d] = water lost [m3]
Where the volume of water lost from an individual pipe burst does not only depend on the flow rate of the event but is also a function of run-time
| [2] | Arregui, F., Cobacho, R., Soriano, J., & García-Serra, J. 2006. "Calculating the optimum level of apparent losses due to water meter inaccuracies." IWA Water Loss 2005 Conference. Halifax. 1-4. |
[2]
. This is often overlooked. The leak run time comprises of three components which are:
1) Awareness time: time until the utility becomes aware that there is a leak
2) Location time: time spent to precisely locate the leak so that a repair job order can be issued
3) Repair time: time between issuing of repair job order and completion of the repair.
Various expressions are used to represent the term of water losses, such as “unaccounted-for water (UFW),” “total water loss,” “non-revenue water (NRW),” “non-account water (NAW),” “unauthorized water uses,” and “water leaks.”,
. Water loss refers to the difference between water utility’s system input volume of water and authorized consumed volume of water
| [12] | Hanjahanja, R., Omuto, C., & Biamah, E. 2018. "Comparing Pre-Paid Communal Water Metering and Delegated Management in Urban Poor Setting: Case Studies in Nakuru and Kisumu in Kenya." Current Urban Studies 483-498. |
[12]
. The amount of water lost from a system can be determined by constructing a water balance. This is based on the measurement or estimation as to the amount of water produced (taking account of any water imported and/or exported), consumed and lost. In its simplest form the water balance is:
Losses = Distribution System Input – Consumption
Water Losses (physical /Real losses)
Physical losses (Real losses) are losses which occur because of storage overflow, pipe bursts and leaks
| [10] | Farley, M., & Trow, S. 2002. Losses in Water Distribution Networks: A Practitioner's Guide to Assessment, Monitoring, and Control. IWA Publishing. |
[10]
. According to
, around 90% of water that is physically lost from leaks cannot be seen on the surface but in the long run the leaks might eventually become visible after many years, but until then, large volumes of water could have been lost each day. Sometimes, undetected leaks can be quite large, such as those that run directly into a sewer or a drain channel
| [10] | Farley, M., & Trow, S. 2002. Losses in Water Distribution Networks: A Practitioner's Guide to Assessment, Monitoring, and Control. IWA Publishing. |
[10]
. According to
, the three main components of physical losses include leakage from transmission and distribution mains, leakage and overflows from the utility’s reservoirs and storage tanks as well as leakage on service connections up to the customer’s meter.
stated that leakages from transmission and distribution mains are the major physical losses which normally occur in most distribution networks. In this study, the strategies proposed will be to reduce real losses which occur along the supply chain through leakages either on transmissions, along the distribution mains, overflows of storage tanks or on connections up to point of consumer metering points.
Water loss mitigation strategies
Water loss mitigation strategies have been developed around the globe over a long period of time, since the development of water supply and distribution systems. However, in many developing countries the concept of water loss management has received very little attention compared with the severity of the problem of water loss. Leaks in the water supply and distribution systems are mitigated through the process of leakage control. Leakage management can be classified into two groups, namely passive leakage control and active leakage control
| [9] | Farley. 2003. "Non-revenue water - International Best Practice for Assessment, Monitoring and Control Annual CWWA Water." Wastewater and Solid Waste Conference. Atlantis, Paradise Island: Bahamas. 99-109. |
[9]
.
Passive leakage control is reacting to reported bursts or a drop in pressure, usually reported by customers or noted by the utility’s own staff while carrying out duties other than leak detection
| [9] | Farley. 2003. "Non-revenue water - International Best Practice for Assessment, Monitoring and Control Annual CWWA Water." Wastewater and Solid Waste Conference. Atlantis, Paradise Island: Bahamas. 99-109. |
[9]
. The method can be justified in areas with plentiful or low-cost supplies.
indicated that this type of leakage control is often practised in less developed supply systems where the occurrence of underground leakage is less well understood. Except in exceptional circumstances, leakage will continue to rise under passive control
.
Active Leakage Control (ALC) is defined as any water utility program that proactively seeks to discover leaks which have not been reported by customers or other means
| [25] | McKenzie, R, J Bhagwan, and C Seago. 2007. Benchmarking Leakage from Water Reticulation Systems in South Africa. Pretoria: Water Research Commission. |
[25]
. The most typical methods of active leakage control are routine leak detection surveys and the use of minimum night flow measurement in DMA or pressure zones
| [25] | McKenzie, R, J Bhagwan, and C Seago. 2007. Benchmarking Leakage from Water Reticulation Systems in South Africa. Pretoria: Water Research Commission. |
[25]
. The usage of the DMA approach to leakage detection and localisation has become an international best practice. The most appropriate leakage control policy will mainly be dictated by the characteristics of the network and local conditions, which may include financial constraints, equipment and other resources
| [36] | Vorosmarty, Green, Salisbury, and Lammers. 2000. "Global water resources: vulnerability from climate change and population growth Science." 284-9. |
[36]
. In many developing countries, the method of leakage control is usually passive or low activity, mending only visible leaks
.
In Africa, and particularly in South Africa, the Water Research Commission (WRC) developed various software for understanding and reducing non-revenue water
| [22] | Mapetere, Kenias, Tanyaradzwa Chigondai, and Evans Chazireni. 2019. "WATER DEMAND MANAGEMENT OPTIONS IN MASVINGO CITY, ZIMBABWE." European Journal of Social Sciences Studies 45-58. |
[22]
. The commission developed a suite of models such as SANFLOW minimum night flow analysis model, PRESMAC pressure management model, ECONOLEAK active leakage control assessment model and the AQUALITE water balance model.
Benchmarking is one other initiative adopted by many African cities in trying to manage their water losses. The approach is one where distribution service efficiency is correlated to improvement in water loss reduction
| [22] | Mapetere, Kenias, Tanyaradzwa Chigondai, and Evans Chazireni. 2019. "WATER DEMAND MANAGEMENT OPTIONS IN MASVINGO CITY, ZIMBABWE." European Journal of Social Sciences Studies 45-58. |
[22]
. A benchmark of 0.3m3/connection /day was agreed upon as a NRW indicator for optimum performance of water utilities in Africa
| [22] | Mapetere, Kenias, Tanyaradzwa Chigondai, and Evans Chazireni. 2019. "WATER DEMAND MANAGEMENT OPTIONS IN MASVINGO CITY, ZIMBABWE." European Journal of Social Sciences Studies 45-58. |
[22]
. This benchmark value was arrived at from the participation of 70% of the 134 utilities from across Africa. Water supply efficiency improvement
Apart from the above, innovative ICT strategies that are found useful to control or mitigate water losses along the water supply and distribution include SCADA, water network monitoring
| [24] | Mathis. 2008. Water21 Article No 6. London: IWA Publishing. |
[24]
.
GIS conceptual frameworks
Geospatial technology has greater potential in water loss reduction in management of water infrastructure network. Within the water supply systems, the distribution network which consisting of pipes, nodes, pumps, valves and storage tanks is the most important component. Geographical Information Systems (GIS), integrated to support water infrastructure networks management, which assists in of an efficient water supply infrastructure through planning and managing water infra-structures and spatial analysis of network data,
.
The preferences for water infrastructure providers incorporates automation of tasks, for example, maintenance, pressure management, detection of leaks, improved water quality control and administration arranged decreased emergence response time in pump and pipe fixes.
The planning of a GIS-supported water distribution network encompasses technical raw data analysis, geospatial data integration, and optimal allocation of network. To know the customers,
customer information recorded in the billing database as well as their locations are important. As part of the mapping exercises in the 5 towns in Southern and Western Provinces,
collected the location of each customer account along with the account number and the customer connections were mapped.
heighted that the reduction in loss of piped water can be achieved by GIS through reducing NRW by knowing water network, knowing customers, knowing customers’ data, recording leakages and quantifying NRW.
In their study
data is output by an interface from the GIS model to another system, the Network Water Balance Locale system. What is exported from the GIS can be used in Google Earth as well as in Epanet. The GIS data model with the Network Water Balance Locale system provided knowledge of the water network, customers, customers’ data and recording leaks.
4. Methodology
The design science research methodology (Improvement Research) which is a descriptive method was adopted for this research. The approach focuses on creation, invention or design of some new artifacts, while deriving or obtaining suggestions to solving the problem from current knowledge or theory base for the problem domain. The artifact designed is the GIS water loss mitigation strategy applicable to the current water loss along the water supply chain to create a water secure community within Masvingo city. It also attempts to describe systematically a situation, problem or phenomenon
. In this study a situation being described is water loss through leakages which is creating a problem such as an economic water scarcity situation in turn. Applying the descriptive research therefore describes systematically the water scarcity situation at hand, how it comes into existence as a problem and allows the formation of a solution to a problem described. The solution formulated through the research is designing and implementing a GIS framework to reduce the water loses along the water network. Applied research, specifically descriptive research is done to solve specific, practical questions, it is applicable to this study in that a specific problem to be solved is water loss (physical / real water loss) through leakages along the water supply network. The result of the research therefore is a solution to this problem at hand. Descriptive research discovered associations or relationships between or among selected variable and with reference to this study, it allowed the discovery of a relationship between information system adaptation specifically a geographic information system and water availability as variables.
Research framework
In this study the model used to support the research effort i.e., to provide answers to the research questions as well meeting the research objectives is the Theory of Reasoned Action (TRA), specifically the technological acceptance model (TAM). The TRA presents and portrays the hypothesis that geographic information system and sensor networks in the water supply network is a possible solution to reduce real water losses and brings out the reasons why the current situation where water scarcity exists comes into existence. The framework in this case is modelled as accepting a technological framework specifically geographic information system which is represented as a model. The concepts identify variables in the study and in this case, variables are TAM variables in accepting technology equated to some independent, dependent and moderating variables in the application of GIS as a solution to real or physical water losses along the water supply network. The relationships between the variables exists and the concepts or theories presented as models expresses abstract concepts and relationships. It models how users come to accept and use a technology that is, perceived ease-of-use (PEOU). The user in this case refers to the Masvingo City Council which will have the responsibility of using ICT particularly GIS and sensor networks to reduce real/physical water losses to improve the water supply to its residents. Technology Acceptance Model proposes that the utilization of an information system framework is controlled by behavioural intention or social aim, yet then again, that the conduct aim is dictated by the individual's mentality or perception towards the utilization of the framework and furthermore by his view of its usefulness.
This framework defines information systems, in this case geographic information system and the information system users for management of the water supply chain. In this study, what is going to be the factor will be the attitude to technology by Masvingo City Council. According to
, the attitude of an individual is not the only factor that determines his use of GIS but is also based on the impact which it may have on his performance. The study has two main variables: factors influencing (independent) and real water loss (dependent). The independent variable is broken into sub-variables namely, leak detection, leak monitoring, and leak run time. The factors are assumed to have effect on water lost along the supply network as they influence the amount of water lost along the way. GIS as a technological factor which is the independent variable affecting real/physical water losses through sub-variables such as leak run time and some moderating variables in the system. The dependent variable (Real water loss/leakage) is affected by the independent variable (GIS). The availability/utilisation or presence of GIS has an impact on the amount of water lost along the water supply network. The effect comes through the relationships between the independent variable and some moderating variables. This means the relationships between moderating variables and the independent variable affects the dependent variable.
GIS formulation procedure
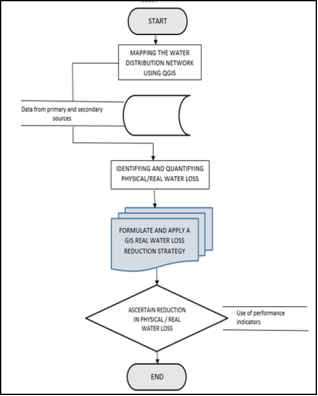
In this research GIS specifically, Quantum GIS is used to reduce water leaks along the supply network through the analysis of pressure and flow rate data that is collected by sensors and sent to a central Quantum Geographic Information system which are hydraulically analyze and determine the size and location of the leakage in the network. The approach for the study follows these steps and procedures:
1) Collection of field data on the existing water supply distribution system. In this case, there is an existing water network map from secondary data sources. The map shows the water network but some of the components such as pipes, reservoirs and valves are not shown. It shows the characteristics of the components of the network.
2) Secondly the map document, as an input into the geodatabase, the network is then edited, segmented into zones using the QGIS software. Some water network components are added. Preparation of various layers (both thematic and network layers). Maps are prepared from the existing vector-based map (1:2000scale). Development of network layers is done through, Road network, Water Distribution Network, Sewer network, and preparation of input data for the data models by incorporating field attribute data
3) Segmenting the water distribution networks into Zones known as District Metered Area (DMAs) using QGIS for easy management of the water network. Data model Management by using GIS Network Analysis and development of a user-friendly tool for data Management.
4) Installation of the technical components of the process i.e. leak detection devices, specifically pressure and flow control sensors with real-time and online data transmission in a TCP/IP stack and an intelligent GIS-based computerised system to steer the whole process. Sensors are installed at some points in various District Meter Areas (DMAs) where there are water flowmeters and pressure meters throughout the distribution system. A DMA is a discrete area with a defined and permanent boundary in terms of water supply. Inflows and outflows within each district can be regularly monitored, enabling the detection of leakages and allowing the management of the pressure in each district or group of districts so that the network is operated at the optimum level of pressure.
5) Monitoring of the water balance and reacting to data from sensors is segmented in DMAs where in each DMA there are sensors and flowmeters at strategic points. Sensors that are used monitors the two variables namely pressure rate and flow rate of water in the network. The sensor in use is the YFS201 Hall Effect Water Flow Sensor. The values of pressure and flow various nodes changes based on the changes of the water of pressure and flow rates. And the changes in these values are monitored by the sensors installed in the water network to detect a water leak. The YFS201 Hall Effect Water Flow Sensor is connected to a microcontroller such that when they get the values of pressure and flow rates, they send them in real-time to the central server which is a QGIS server.
A sensor is connected to a microcontroller which is connected to a GPS and a chipset which provides internet. A GPS receiver which is connected to the micro controller allows the acquisition of information on the current time and position of sensor data. The platform connects to the Internet through a chipset, which provides Ethernet functionality and a TCP/IP stack. Once running, the sensor platform starts collecting data by reading the sensors in defined intervals. Each measurement is stored in a file which is identified by the sensor ID, location and time derived from the GPS are added to each measurement. When a leak occurs, pressure on the network drops. If a leak continues then there will be an increase in the pressure drop and increase in volume of leakage. The whole water network including the sensors are visible through the QGIS application server dashboard. The changes in the values of pressure and flow rate is viewed graphically. A point where there is a drop in press rate means that there is a leak. At the central server monitoring is done through the dashboard of QGIS application showing the readings and variation.
5. Discussion
The study sought to establish and evaluate the mechanisms that are used to report any visible, physical water leakages. The data collected from the field shows that a report for any physical water burst can be made by any of the three ways which can be either physically visiting the council, engineering department during working hours or making calls to the same department. Mechanism used to report water leakages were therefore not real-time therefore (the time a leak runs before it is reported), leak awareness time becomes longer hence the longer the leak awareness time the more the amount of water is lost through leakages. This justified the need to develop a geographic information system framework with water pressure sensors that can be used to reduce the treated water losses along the water distribution channel by Masvingo City. Sensors allow real time leak detection and reduce the leak awareness time to zero. The study sought to establish the time it took for a leak to be repaired from the time it is noticed and reported, leak run time. This factor or variable constitutes the time taken before a leak is reported, (leak awareness time) and the time taken before a leak is fully repaired (leak repair time). Data pertaining leaks awareness and leak repair time were collected from the MCC dataset. This was then used to compute the average leak run time in hours for leaks that were identified, reported and repaired for a period of 3 months i.e., from January to March 2020.
The variable with much effect and contribution to the amount of water lost in the water supply network is the Total Leak run time which is equal to Leak awareness time (Hours) plus Leak repair time. The study further sought to establish the relation between water loss (leakage) and leak runtime by computing correlation between the volume of water lost through leakage recorded and the leak runtime within the period from January 2020 to March 2020).
Pearson correlation
Pearson correlation was used to measure the degree of association between water loss and total leak run time. Negative values indicate negative correlation and positive values indicates positive correlation.
Table 1.
Correlation Co efficiency (Total leak run time and Water loss (Mm3). Correlation Co efficiency (Total leak run time and Water loss (Mm3). Correlation Co efficiency (Total leak run time and Water loss (Mm3). | Total leak run time (Hours) | Water loss (Mm3) |
Total leak run time (Hours) | 1 | |
Water loss (Mm3) | 0.941625368 | 1 |
The analysis on table above shows that the variable Total leak run time (Hours) and Water loss (Mm3) has the strongest positive (Pearson correlation coefficient =.941). In addition, Leak age before reporting had a positive and Water loss (Mm3) had a strong correlation of (Pearson correlation coefficient =.942). The study thus established a strong linear relationship between the variables, but no autocorrelation was established.
Table 2.
Correlation Co efficiency (Leak age before reporting and Water loss). Correlation Co efficiency (Leak age before reporting and Water loss). Correlation Co efficiency (Leak age before reporting and Water loss). | Leak awareness time (Hours) | Water loss (Mm3) |
Leak awareness time (Hours) | 1 | |
Water loss (Mm3) | 0.942534365 | 1 |
Regression analysis
As shown on
Table 3 below, Coefficients provides information on each predictor variable. The coefficient determination explains the extent to which changes in the dependent variable (water loss) which is the predictor variable can be explained by the change in the independent variables or explanatory variable (age of leak before reporting and total leak run time). The Correlation Coefficient, R Square of 0.988 is an indicator of a strong linear relationship between two variables i.e. water leak age before reporting and volume of water lost as it is closer to 1.
Table 3.
Coefficient of Determination (R2). Coefficient of Determination (R2). Coefficient of Determination (R2). Model | Multiple R | R Square | Adjusted R Square | Std. Error of the Estimate |
1 | 0.988 | 0.976 | 0.953 | 0.00449 |
The Coefficient of Determination, R Square which is used as an indicator of the goodness of fit. In the study, 0.976 is the coefficient of determination and rounded off to 2 digits gives 0.98%, meaning that 98% of our values representing independent and dependent variables fit the regression analysis model. In other words, 98% of the dependent variables (y-values) are explained by the independent variables (x-values). Generally, R Squared of 95% or more is considered a good fit.
For
Table 4, ANOVA, indicates that the regression model predicts the outcome variable significantly well. This indicates the statistical significance of the regression model that was applied. The significance value is 0.047. This value is less than 0.05 which means that the model is statistically significant in predicting water loss in relation to water leak run time. The F critical at 5% level of significance was 2.813. Since F calculated, 4.914 is greater than the F critical, this shows that the overall model was significant.
Table 4.
ANOVA. ANOVA. ANOVA. Model | | Sum of Squares | Df | Mean Square | F Calculated | Sig |
1 | Regression | 3.031 | 1 | 8.44 | 4.914 | 0.047 |
Residual | 2.240 | 1 | 0.017 | | |
Total | 5.271 | 2 | | | |
Regression analysis output: coefficients
A Coefficient of Regression analysis was conducted to build a linear regression equation for the relationship between the water loss and the four factors leak age before reporting and total leak age.
Table 5. Regression coefficients. Regression coefficients. Regression coefficients.
Model | | Unstandardized Coefficients | Standardized Coefficients |
1 | constants | 0.18977058 | 0.033642848 |
| x Variable | 0.331511471 | 0.011233745 |
Regression equation obtained from
Table 5:
According to the Coefficient of Regression, a unit increase in a water leak run time will lead to a 0.331 i.e., 33% increase in the water loss added to a constant loss of 0.189 i.e. 19%.
Results obtained after applying GIS in the water network
The table below shows a comparison of the water supplied and lost both before and after GIS applied into the water network.
Table 6.
Summary of differences before and after implementing various QGIS strategies. Summary of differences before and after implementing various QGIS strategies. Summary of differences before and after implementing various QGIS strategies. Parameter | Before GIS applied | After GIS applied | Reduction |
System Input Volume | 7704M3/day | 7704M3/day | nil |
Average Number of bursts | 1 | 1 | nil |
Average Leak awareness time | 72hrs | 0hrs | 100% |
Average Leak repair time | 5hrs | 5hrs | nil |
Total leak Run time | 77hrs | 5hrs | 93% |
Real water Loss level | 40% | 40% | nil |
Total Water Loss | 4622 | 3235 | 30% |
Based on the results shown on the table above, it was noted that GIS framework in reducing total leak run time through reduction of leak awareness time, does not reduce leak repair time which is another contributing factor to the total leak run time. Even though the GIS framework reduced leak awareness time by 100 percent, it did not reduce the total leak run time by 100 percent due to the presence of another contributing factor to the total leak run time which is leak repair time. From the above data, a 100 percent reduction in leak awareness time translated a 93 percent reduction total leak run time leading to a 30 percent reduction in water loss.