Abstract
The Ethiopian Blue Nile Basin exhibits pronounced rainfall variability, and projected climate change is expected to further amplify this uncertainty, with significant implications for water resource availability, particularly under conditions of growing demand. This study was undertaken to examine the spatiotemporal variability of rainfall over the Ethiopian Blue Nile Basin through statistical and spatial analysis of historical rainfall records, with the objective of assessing rainfall distribution patterns and evaluating data reliability. The aim of this study was, therefore, to compare and validate the performance of Kiremt and Annual rainfall Gauge-Blended Product (ENACT) with Satellite products (CHIRPS, ARC2, PERSIANN-CDR, TAMSAT, and GPCC) that were collected from satellite during the period of 1991-2020 over the Ethiopian Blue Nile Basin. At the seasonal scale, CHIRPS achieved the highest correlation coefficient (R = 0.96), indicating strong agreement with gauge observations, together with the lowest RMSE (32.59 mm) and a near-optimal bias value (BIAS = 1.08). The product also exhibited excellent rainfall event detection capability, with POD, CSI, and VHI values of 0.97, 0.93, and 0.99, respectively, while maintaining relatively low FAR (0.04) and VFAR (0.04). Similarly, GPCC and TAMSATv3.1 showed relatively strong performance, whereas ARC2 exhibited comparatively lower skill, particularly in terms of RMSE and volumetric indices. At the annual scale, CHIRPS again outperformed the other rainfall products, recording the highest correlation coefficient (R = 0.85), the lowest RMSE (47.61 mm), and near-unity categorical and volumetric statistics, including POD = 1.00, CSI = 1.00, VHI = 1.00, and VCSI = 0.99. Although GPCC and TAMSATv3.1 also demonstrated strong annual performance, ARC2 showed relatively weaker agreement with observed rainfall, characterized by lower correlation (R = 0.60) and higher RMSE (87.64 mm). The results of this study provide crucial information for water resources management, which directly have impacts on human socio-economic life, and environment. It can be used by different stakeholders, researchers, and policy makers to inform decision-making process.
|
Published in
|
Science Futures (Volume 2, Issue 3)
|
|
DOI
|
10.11648/j.scif.20260203.13
|
|
Page(s)
|
203-217 |
|
Creative Commons
|

This is an Open Access article, distributed under the terms of the Creative Commons Attribution 4.0 International License (http://creativecommons.org/licenses/by/4.0/), which permits unrestricted use, distribution and reproduction in any medium or format, provided the original work is properly cited.
|
|
Copyright
|
Copyright © The Author(s), 2026. Published by Science Publishing Group
|
Keywords
Blue Nile, Comparative Analysis, Rainfall Estimates, Satellite Data, Blended Product
1. Introduction
Rainfall variability, characterized by fluctuations in the intensity, amount, frequency, and spatial distribution of precipitation, plays a fundamental role in regulating the Earth’s hydrological cycle, ecosystem dynamics, and climate system
| [1] | Huang, J., & van den Dool, H. M. (1993). Monthly precipitation-temperature relations and temperature prediction over the United States. Journal of Climate, 6(6), 1111–1132. |
| [2] | Stillman, S., Ninneman, J., Zeng, X., Franz, T., Scott, R. L., Shuttleworth, W. J., & Cummins, K. (2014). Summer soil moisture spatiotemporal variability in southeastern Arizona. Journal of Hydrometeorology, 15(4), 1473–1485. |
[1, 2]
. Accurate estimation of rainfall is therefore essential for understanding hydrological, agricultural, and climatological processes, as well as for improving water resource management, drought monitoring, flood forecasting, and climate-related risk assessments. However, obtaining reliable precipitation measurements remains challenging, particularly in regions with sparse rain gauge networks and complex topography.
In recent decades, satellite-based precipitation products (SPPs) have become increasingly important alternatives to conventional rain gauge observations due to their extensive spatial coverage and high temporal resolution. Satellite rainfall estimates provide valuable information for hydrological and climate applications, especially in data-scarce regions such as Africa. Nevertheless, uncertainties associated with satellite rainfall retrieval algorithms, sensor limitations, and terrain-induced effects can significantly affect the accuracy of precipitation estimates. Consequently, continuous validation and intercomparison of satellite precipitation products under different climatic and topographic conditions are essential to improve their applicability and reliability
| [3] | Dinku, T., Ceccato, P., Grover‐Kopec, E., Lemma, M., Connor, S. J., & Ropelewski, C. F. (2007). Validation of satellite rainfall products over East Africa’s complex topography. International Journal of Remote Sensing, 28(7), 1503–1526. |
| [4] | Kidd, C., & Huffman, G. (2011). Global precipitation measurement. Meteorological Applications, 18(3), 334–353. |
| [5] | Sun, Q., Miao, C., Duan, Q., Ashouri, H., Sorooshian, S., & Hsu, K. (2018). A review of global precipitation data sets: Data sources, estimation, and intercomparisons. Reviews of Geophysics, 56(1), 79–107. |
[3-5]
.
Several studies have evaluated the performance of satellite precipitation products across continental, regional, and basin scales in Africa, including Ethiopia and the Upper Blue Nile Basin
| [3] | Dinku, T., Ceccato, P., Grover‐Kopec, E., Lemma, M., Connor, S. J., & Ropelewski, C. F. (2007). Validation of satellite rainfall products over East Africa’s complex topography. International Journal of Remote Sensing, 28(7), 1503–1526. |
| [6] | Awange, J. L., Ferreira, V. G., Forootan, E., Khandu, Andam-Akorful, S. A., Agutu, N. O., & He, X. F. (2016). Uncertainties in remotely sensed precipitation data over Africa. International Journal of Climatology, 36(1), 303–323.
https://doi.org/10.1002/joc.4346 |
| [7] | Diem, J. E., Hartter, J., Ryan, S. J., & Palace, M. W. (2014). Validation of satellite rainfall products for western Uganda. Journal of Hydrometeorology, 15(5), 2030–2038. |
| [8] | Dinku, T., Chidzambwa, S., Ceccato, P., Connor, S. J., & Ropelewski, C. F. (2008). Validation of high‐resolution satellite rainfall products over complex terrain. International Journal of Remote Sensing, 29(14), 4097–4110. |
| [9] | Dinku, T., Ceccato, P., & Connor, S. J. (2011). Challenges of satellite rainfall estimation over mountainous and arid parts of east Africa. International Journal of Remote Sensing, 32(21), 5965–5979. |
| [10] | Hirpa, F. A., Gebremichael, M., & Hopson, T. (2010). Evaluation of high-resolution satellite precipitation products over very complex terrain in Ethiopia. Journal of Applied Meteorology and Climatology, 49(5), 1044–1051. |
| [11] | Maidment, R. I., Grimes, D. I. F., Allan, R. P., Greatrex, H., Rojas, O., & Leo, O. (2013). Evaluation of satellite‐based and model re‐analysis rainfall estimates for Uganda. Meteorological Applications, 20(3), 308–317.
https://doi.org/10.1002/met.1283 |
| [12] | Maidment, R. I., Grimes, D., Allan, R. P., Tarnavsky, E., Stringer, M., Hewison, T., Roebeling, R., & Black, E. (2014). The 30 year TAMSAT African rainfall climatology and time series (TARCAT) data set. Journal of Geophysical Research: Atmospheres, 119(18), 10–619.
https://doi.org/10.1002/2014JD021927 |
| [13] | Maidment, R. I., Grimes, D., Black, E., Tarnavsky, E., Young, M., Greatrex, H., Allan, R. P., Stein, T., Nkonde, E., & Senkunda, S. (2017). A new, long-term daily satellite-based rainfall dataset for operational monitoring in Africa. Scientific Data, 4(1), 170063. https://doi.org/10.1038/sdata.2017.63 |
| [14] | Romilly, T. G., & Gebremichael, M. (2011). Evaluation of satellite rainfall estimates over Ethiopian river basins. Hydrology and Earth System Sciences, 15(5), 1505–1514. |
| [15] | Worqlul, A. W., Maathuis, B., Adem, A. A., Demissie, S. S., Langan, S., & Steenhuis, T. S. (2014). Comparison of rainfall estimations by TRMM 3B42, MPEG and CFSR with ground-observed data for the Lake Tana basin in Ethiopia. Hydrology and Earth System Sciences, 18(12), 4871–4881. |
| [16] | Young, M. P., Williams, C. J. R., Chiu, J. C., Maidment, R. I., & Chen, S.-H. (2014). Investigation of discrepancies in satellite rainfall estimates over Ethiopia. Journal of Hydrometeorology, 15(6), 2347–2369. |
[3, 6-16]
. These studies demonstrated that the performance of satellite rainfall estimates varies considerably depending on climatic conditions, elevation, seasonal rainfall regimes, and terrain complexity. In particular, comparisons among gauge-blended products and satellite-derived precipitation datasets, including CHIRPS, ARC2, PERSIANN-CDR, TAMSAT, and GPCC, revealed substantial spatial and temporal inconsistencies in rainfall estimation accuracy across East Africa and the Ethiopian highlands.
Ethiopia experiences highly variable rainfall patterns that are largely controlled by large-scale atmospheric circulation systems and complex topography. The main rainy season, locally known as
Kiremt, occurs during the boreal summer (June–September) and contributes approximately 50–90% of the annual rainfall over the northern Ethiopian highlands
| [17] | Korecha, D., & Barnston, A. G. (2007). Predictability of June-September rainfall in Ethiopia. Monthly Weather Review, 135(2), 628–650. https://doi.org/10.1175/MWR3304.1 |
[17]
. During this period, moist air masses originating from the Indian Ocean, Atlantic Ocean, and the Red Sea converge over the Ethiopian highlands and ascend due to orographic forcing
| [18] | Segele, Z. T., Lamb, P. J., & Leslie, L. M. (2009). Seasonal-to-interannual variability of Ethiopia/horn of Africa monsoon. Part I: associations of wavelet-filtered large-scale atmospheric circulation and global sea surface temperature. Journal of Climate, 22(12), 3396–3421. |
[18]
. The elevated terrain enhances convective instability through surface heating of the plateau
| [19] | Conway, D. (2000). The climate and hydrology of the Upper Blue Nile River. Geographical Journal, 166(1), 49–62. |
[19]
. At a broader scale, the summer rainfall regime is strongly associated with the northward migration of the Inter tropical Convergence Zone (ITCZ) and the dynamics of the Indian summer monsoon system, both of which are modified by the complex topography of the Ethiopian highlands.
Among the major river basins in Ethiopia, the Upper Blue Nile Basin is one of the most hydrologically and socioeconomically important regions. The basin is characterized by highly heterogeneous terrain, significant elevation gradients, and pronounced seasonal rainfall variability, all of which complicate satellite rainfall retrieval processes. Previous validation studies conducted in the basin have indicated that the performance of satellite precipitation products differs substantially across climatic zones and seasons, with gauge-blended products generally exhibiting relatively improved performance under certain conditions. These findings underscore the necessity for continuous assessment and refinement of satellite rainfall products in regions with complex physiographic and climatic characteristics
| [6] | Awange, J. L., Ferreira, V. G., Forootan, E., Khandu, Andam-Akorful, S. A., Agutu, N. O., & He, X. F. (2016). Uncertainties in remotely sensed precipitation data over Africa. International Journal of Climatology, 36(1), 303–323.
https://doi.org/10.1002/joc.4346 |
| [10] | Hirpa, F. A., Gebremichael, M., & Hopson, T. (2010). Evaluation of high-resolution satellite precipitation products over very complex terrain in Ethiopia. Journal of Applied Meteorology and Climatology, 49(5), 1044–1051. |
| [14] | Romilly, T. G., & Gebremichael, M. (2011). Evaluation of satellite rainfall estimates over Ethiopian river basins. Hydrology and Earth System Sciences, 15(5), 1505–1514. |
| [15] | Worqlul, A. W., Maathuis, B., Adem, A. A., Demissie, S. S., Langan, S., & Steenhuis, T. S. (2014). Comparison of rainfall estimations by TRMM 3B42, MPEG and CFSR with ground-observed data for the Lake Tana basin in Ethiopia. Hydrology and Earth System Sciences, 18(12), 4871–4881. |
[6, 10, 14, 15]
.
Therefore, this study presents a comprehensive evaluation of selected satellite precipitation products over the Upper Blue Nile Basin of Ethiopia. Five widely used precipitation products—CHIRPS, ARC2, PERSIANN-CDR, TAMSAT, and GPCC—are systematically evaluated against gauge-blended ENACT rainfall data across different climatic zones within the basin. The analysis focuses on assessing the spatial and temporal performance of these products at regional and seasonal scales. In addition, several previous studies conducted at continental, national, and basin scales are summarized in
Table 1 to provide a broader context for the evaluation of satellite precipitation products in Africa, Ethiopia, and the Upper Blue Nile Basin.
Table 1. Evaluating the performance of satellite precipitation products at different scales.
Location | Satellites | Best Performance | Study |
Africa | PERSIANN, ARCv2, TRMM, CMORPH, TAMSAT, and GSMaP, GPCC | PERSIANN: over most Africa, CMORPH: over GHA | | [6] | Awange, J. L., Ferreira, V. G., Forootan, E., Khandu, Andam-Akorful, S. A., Agutu, N. O., & He, X. F. (2016). Uncertainties in remotely sensed precipitation data over Africa. International Journal of Climatology, 36(1), 303–323.
https://doi.org/10.1002/joc.4346 |
[6] |
TRMM, TMPA, PERSIANN, and CMORPH | PERSIANN and TMPA | | [20] | Serrat-Capdevila, A., Merino, M., Valdes, J. B., & Durcik, M. (2016). Evaluation of the performance of three satellite precipitation products over Africa. Remote Sensing, 8(10).
https://doi.org/10.3390/rs8100836 |
[20] |
TAMSAT v2 and TAMSAT v3 | None | | [13] | Maidment, R. I., Grimes, D., Black, E., Tarnavsky, E., Young, M., Greatrex, H., Allan, R. P., Stein, T., Nkonde, E., & Senkunda, S. (2017). A new, long-term daily satellite-based rainfall dataset for operational monitoring in Africa. Scientific Data, 4(1), 170063. https://doi.org/10.1038/sdata.2017.63 |
[13] |
TAMSAT v3 and CHIRPS (daily satellite-based products), as well as MSWEP v2.2 | All are good, and better in detecting rainy days and daily amounts | | [21] | Cattani, E., Merino, A., Guijarro, J. A., & Levizzani, V. (2018). East Africa Rainfall trends and variability 1983-2015 using three long-term satellite products. Remote Sensing, 10(6), 1–26. https://doi.org/10.3390/rs10060931 |
[21] |
CHIRPS, TAMSAT, and GSMaP_wGauge, GSMaP | GSMaP | | [22] | Macharia, D., Fankhauser, K., Selker, J. S., Neff, J. C., & Thomas, E. A. (2022). Validation and Intercomparison of Satellite-Based Rainfall Products over Africa with TAHMO In Situ Rainfall Observations. Journal of Hydrometeorology, 23(7), 1131–1154. https://doi.org/10.1175/JHM-D-21-0161.1 |
[22] |
RFE v2.0, ARC v2.0, MSWEP v2.8, TAMSATv3.1, PERSIANN-CDR ERA 5, and CHIRPS | Complex results, CHIRPS was good in East Africa | | [23] | Mekonnen, M. B., Wondie, M., & Addisu, S. (2026). Trends and variability of seasonal rainfall in Ethiopian River basins: implications for water resource management. Meteorology Hydrology and Water Management. |
[23] |
Ethiopia | CHIRPS, TAMSAT 3, and ARC2 | CHIRPS followed by TAMSAT | | [24] | Ayehu, G. T., Tadesse, T., Gessesse, B., & Dinku, T. (2018). Validation of new satellite rainfall products over the Upper Blue Nile Basin, Ethiopia. Atmospheric Measurement Techniques, 11(4), 1921–1936.
https://doi.org/10.5194/amt-11-1921-2018 |
[24] |
CHIRPS, TAMSAT v2 and v3, and TRMM 3B43v7 | CHIRPS followed by TAMSAT, and TRMM for mountanious area | | [25] | Belete, M., Deng, J., Wang, K., Zhou, M., Zhu, E., Shifaw, E., & Bayissa, Y. (2020a). Evaluation of satellite rainfall products for modeling water yield over the source region of Blue Nile Basin. Science of the Total Environment, 708.
https://doi.org/10.1016/j.scitotenv.2019.134834 | | [26] | Belete, M., Deng, J., Wang, K., Zhou, M., Zhu, E., Shifaw, E., & Bayissa, Y. (2020b). Evaluation of satellite rainfall products for modeling water yield over the source region of Blue Nile Basin. Science of the Total Environment, 708, 134834.
https://doi.org/10.1016/j.scitotenv.2019.134834 |
[25, 26] |
TRMM, CRU, and GPCC | GPCC | | [27] | Abdelwares, M., Lelieveld, J., Zittis, G., Haggag, M., & Wagdy, A. (2020). A comparison of gridded datasets of precipitation and temperature over the Eastern Nile Basin region. Euro-Mediterranean Journal for Environmental Integration, 5(1), 1–16. https://doi.org/10.1007/s41207-019-0140-y |
[27] |
CMORPH, TRMM 3B42v7, TMPA, ERA-Interim, GPCC, MSWEP | MSWEP | | [28] | Gorjizadeh, A., & Moridi, A. (2024). Comparative analysis of the performance of gridded precipitation products over Iran. Water Harvesting Research, 7(2), 175–193. |
[28] |
Upper Blue Nile basin | CHIRPS, ARC2, and TMSAT2 and TMSAT3 | CHIRPS relatively better than TAMSAT and ARC 2 | | [24] | Ayehu, G. T., Tadesse, T., Gessesse, B., & Dinku, T. (2018). Validation of new satellite rainfall products over the Upper Blue Nile Basin, Ethiopia. Atmospheric Measurement Techniques, 11(4), 1921–1936.
https://doi.org/10.5194/amt-11-1921-2018 |
[24] |
CHIRPSv2 and MSWEPv2 | CHIRPSv2 | |
The evaluation is designed to provide a thorough comparison of the satellite rainfall products with the gauge-blended products, which serve as a reference benchmark. The study period spans from 1991 to 2020; a time frame selected primarily due to the availability of reliable station data. This 30-year period allows for a robust evaluation of the satellite products' performance, capturing various climatic patterns and trends.
The evaluation is performed at the regional level, utilizing the Upper Blue Nile basin as a case study. The satellite rainfall products are compared with the gauge-blended products, which are derived from a network of rain gauge stations. The study's focus on the Upper Blue Nile region provides valuable insights into the performance of the satellite products in a region characterized by diverse climatic conditions and complex topography.
The evaluation period, extending from 1991 to 2020, offers a unique opportunity to assess the consistency and accuracy of the satellite rainfall products over an extended time frame. This 30-year period encompasses a range of climate variability, including wet and dry periods, allowing for a comprehensive evaluation of the products' performance under different climatic conditions.
The aim of this study was, therefore, to compare and validate the performance of Kiremt and Annual rainfall Gauge-Blended Product (ENACT) with Satellite products (CHIRPS, ARC2, PERSIANN-CDR, TAMSAT, and GPCC) that were collected from satellite during the period of 1991-2020 over the Ethiopian Blue Nile Basin. ENACT performance was also compared against CHIRPS, ARC2, PERSIANN-CDR, TAMSAT, and GPCC satellite rainfall products.
2. Description of Study Area
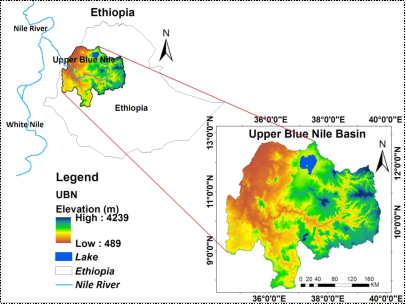
Figure 1. Study area with elevation.
The Blue Nile Basin is located between 7°40′N–16°02′N latitude and 32°30′E–39°49′E longitude in the northwestern Ethiopian Highlands, covering approximately 311,437 km2 with elevations ranging from 489 to 4,239 m above sea level. The Blue Nile River originates from Gish Abbay in West Gojam, flows through Lake Tana, and traverses deeply incised gorges before entering Sudan and joining the White Nile. As the major tributary of the Nile River system, the basin is critically important for hydrology, agriculture, hydropower production, ecosystem sustainability, and socioeconomic development in Ethiopia.
3. Data and Methology
3.1. Satellite Data Sets
3.1.1. Climate Hazards Group InfraRed Precipitation with Station Data (CHIRPS)
The Climate Hazards Group InfraRed Precipitation with Station (CHIRPS) dataset is a high-resolution rainfall dataset that combines satellite observations blended with ground station data, covering a wide area (50°S - 50°N), with a long record starting from 1981 until now. By integrating multiple data sources, CHIRPS enhances the accuracy and reliability of its rainfall data, to provide reliable precipitation estimates, so as it is widely used in climate research, hydrology, agriculture, and disaster management. CHIRPS provide high-resolution rainfall estimates at a spatial resolution of approximately 0.05 degrees (about 5 km) globally. This fine spatial resolution allows for detailed analysis of precipitation patterns at local and regional scales. Moreover, it offers daily precipitation estimates, and this is valuable for studying short-term weather events, seasonal patterns, and long-term climate trends. The CHIRPS dataset undergoes rigorous validation processes to ensure the accuracy of its precipitation estimates. Numbers of validation studies were conducted to compare CHIRPS data with ground-based observations and other satellite-derived datasets to assess its performance in capturing actual rainfall patterns (https://www.chc.ucsb.edu/data/chirps).
3.1.2. African Rainfall Climatology Version2 (ARC2)
The African Rainfall Climatology Version2 is a high-resolution gridded rainfall dataset developed specifically for Africa. It provides daily estimates of precipitation at a spatial resolution of 0.1 degrees (approximately 10 km) across the continent. ARC2 combines satellite data, ground station observations, and numerical weather prediction models to generate rainfall information for various applications, including agriculture, water resource management, and disaster risk reduction in Africa. This dataset also provides a long record (1983 – present) of daily rainfall data. (https://iridl.ldeo.columbia.edu/SOURCES/.NOAA/.NCEP/.CPC/.FEWS/.Africa/.DAILY/.ARC2/).
3.1.3. Precipitation Estimation from Remotely Sensed Information Using Artificial Neural Networks–Climate Data Record (PERSIANN-CDR-CCS)
Precipitation Estimation from Remotely Sensed Information using Artificial Neural Networks–Climate Data Record (PERSIANN-CDR) Satellite and gauge data is one of the significant products that have been commonly used globally. It allows users to access and download spatiotemporal statistics precipitation data from 1983 up to Present, uses balanced network function classification/approximation procedures to compute an estimate of rainfall rate at about 0.25° x 0.25° (27 km) pixel resolution. It is a long-term global rainfall dataset that leverages satellite data and machine learning techniques to estimate precipitation on a smallest temporal resolution of daily basis, which covers 60°S to 60°N degree, with high resolution and consistency in long-term records. PERSIANN-CDR is widely used for climate studies, hydrological modeling, and monitoring of precipitation trends over extended time periods. (https://www.ncei.noaa.gov/products/climate-data-records/precipitation-persiann)
3.1.4. Tropical Applications of Meteorology Using Satellite Data (TAMSAT)
TAMSAT is a research project that produces high-quality rainfall estimates for tropical regions, with a focus on Africa. The TAMSAT dataset combines satellite data, climate reanalysis products, and ground station observations to generate daily and pentad (5-day) precipitation estimates at a spatial resolution of approximately 4 km over Africa, and a record extending from 1983 until now. TAMSAT data is utilized in various applications; such as famine early warning, drought insurance, agricultural decision support, and climate impact assessments. (https://research.reading.ac.uk/tamsat/).
3.1.5. Global Precipitation Climatology Centre (GPCC)
GPCC is an international initiative that produces global precipitation datasets based on a gridding the rain gauge observations, covering the area 90°S - 90°N, with a long record starting from 1891 until present. The GPCC dataset offers monthly and daily precipitation estimates at various spatial resolutions of 0.1 degrees to 0.25 degrees respectively. GPCC data is widely used in climate research, water resource management, and climate impact assessments on a global scale. (https://www.drought.gov/data-maps-tools/global-precipitation-climatology-centre-gpcc-precipitation-data).
3.1.6. Enhancing National Climate Services (ENACTS)
The Enhancing National Climate Services (ENACTS) initiative, implemented by the International Research Institute for Climate and Society of Columbia University, represents an integrated framework aimed at strengthening the incorporation of climate information into national decision-making processes. The initiative enhances the availability of climate data through the integration of quality-controlled in situ observations from national meteorological networks with satellite-derived rainfall estimates, digital elevation data, and reanalysis-based temperature products. Accessibility is improved via the dissemination of processed climate information through web-based platforms and interactive tools. Furthermore, the effective utilization of climate information is promoted through continuous stakeholder engagement and collaboration, ensuring that the developed products are tailored to user needs and decision-support applications.
The Enhancing National Climate Services (ENACTS) program has been operationalized across several African countries, including Ethiopia, The Gambia, Ghana, Madagascar, Mali, Rwanda, Tanzania, and Zambia. Expansion efforts have been initiated in Kenya, with implementation planned in Uganda in subsequent phases. At the regional scale, ENACTS has been implemented in West Africa through collaboration with the AGRHYMET Regional Center, located in Niamey, Niger. In East Africa, implementation has also commenced at the IGAD Climate Prediction and Applications Centre (ICPAC). These developments reflect the progressive scaling of ENACTS from national to regional levels to enhance climate service delivery and application
| [29] | Dinku, T., Cousin, J., del Corral, R., & Ceccato, P. (2016). The Enacts Approach. The International Research Institute for Climate and Society (IRI): Palisades, NY, USA. |
[29]
.
(https://iri.columbia.edu/resources/enacts/)Table 2. Summary of selected satellites characteristics.
Dataset | Spatial Resolution | Regrinding | Temporal Resolution | Length of Record | For these paper | Type of Data |
ENACT | 0.04° (4.4 km) | 0.05° (5.5 km) | Daily | 1981-2022 | 1991-2020 | Satellite and ground data |
CHIRPS | 0.05° (5.5 km) | 1981-present | Satellite and ground data |
ARC2 | 0.1° (11 km) | 1983-present | Satellite, ground data, and weather prediction models |
PERSIANN-CDR | 0.25° (27 km) | 1983-present | satellite data and machine learning techniques |
TAMAST | 0.0375° (4 km) | 1983-present | satellite data, climate reanalysis products, and ground data |
GPCC | 0.25 (27km) | 1891-present | Gridding of ground data |
3.2. Method
The satellite rainfall estimates were evaluated against ENACT rainfall satellite-station blended dataset which has 4 km spatial resolution at monthly timescale. The POD, VHI, CSI, VCSI, r, FAR, VFAR, and RMSE were evaluation metrics used in this paper. High values of POD, VHI, CSI, VCSI, and r; small values of FAR VFAR, and RMSE; and bias values of 1 (or near to 1) indicate good performance of the satellite rainfall products.
Validation Statistics: -
Where:
1) Pi = Simulated or forecasted climate variable
2) Qi = Observed climate variable
3) n = Total number of observations
Interpretation: A positive bias indicates model overestimation, a negative bias indicates underestimation, and values near zero represent good model performance.
RMSE =(2)
Where:
1) Pi = Simulated value
2) Qi = Observed value
3) n = Number of observations
Interpretation: Lower RMSE values indicate better agreement between climate simulations and observations.
(3)
Where:
1) Si = Simulated value
2) Oi = Observed value
3) S̄ = Mean simulated value
4) Ō = Mean observed value
Interpretation:
Higher positive correlation values indicate better model performance.
Where:
1) M = Hits
2) H = Misses
Interpretation:
Values closer to 1 indicate better event detection capability.
Where:
1) H = False alarms
2) F = Hits
Interpretation:
Lower FAR values indicate fewer false event predictions.
Where:
1) M = Hits
2) H = Misses
3) F = False alarms
Interpretation:
Higher CSI values indicate superior forecast skill.
Where:
1) M = Hits
2) H = Misses
Where:
1) F = False alarms
2) H = Hits
Where:
1) H = Hits
2) M = Misses
3) F = False alarms
4. Result and Discussion
The four satellite rainfall estimates (ARCv2.0, CHIRPSv2.0, PERSIAN-CDR, TAMSATv3.1) and global precipitation (GPCC) performances were evaluated in reference to ENACT rainfall. The dedicated statistical evaluation metrics were POD, FAR, and CSI for categorical indices, VHI, VFAR, and VCSI for volumetric indices, r, bias, and RMSE for continues statistics at monthly, (JJAS) season and annual timescales.
4.1. Annual Rainfall Characteristic
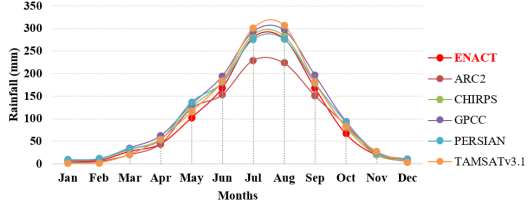
The annual rainfall climatology reveals that the Ethiopian portion of the Blue Nile Basin exhibits a pronounced monomodal rainfall regime (
Figure 2). The Kiremt season (June–September, JJAS) constitutes the dominant rainfall period and is the primary driver of agricultural production and productivity in the region. Across all satellite-based and GPCC rainfall products, Kiremt-season rainfall consistently exceeded 150 mm per month, although the magnitude varied among datasets. TAMSAT systematically overestimated monthly totals, whereas ARC2 tended to underestimate them.
Figure 2. Annual Rainfall Cycle for ENACT, ARC2, CHIRPS, GPCC, PERSIANN-CDR and TAMSAT.
4.2. Spatial Rainfall Pattern of Kiremt (JJAS) Season and Annual
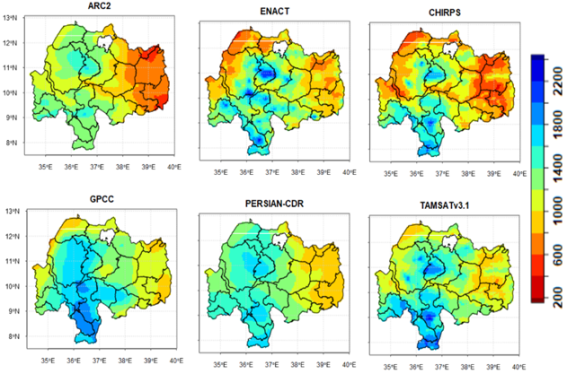
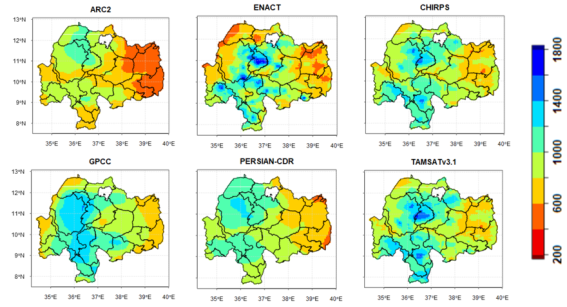
The spatial distribution of rainfall was evaluated for the annual totals and the JJAS (June-July-August-September) main rainy season using five satellite-based rainfall products, together with GPCC as an additional reference dataset (
Figures 3 and 4). The objective was to assess the degree to which each product captures the spatial rainfall patterns and to distinguish those that perform within an acceptable accuracy range from those that display notable deviations. The results indicate that ARC2 consistently exhibits the lowest spatial rainfall totals across both temporal scales, suggesting a systematic underestimation of rainfall over the study region. In contrast, TAMSAT3 displays the highest rainfall accumulation, particularly over western Ethiopia, during both the annual and JJAS periods, indicating a tendency toward overestimation in high-rainfall zones.
Figure 3. Spatial pattern of annual rainfall for ARC2, ENACT, CHIRPS, GPCC, PERSIANN-CDR, and TAMSAT during 1990-2020.
Figure 4. Spatial pattern of JJAS rainfall for ARC2, ENACT, CHIRPS, GPCC, PERSIANN-CDR, and TAMSAT during 1990-2020.
Among the satellite products, CHIRPS v2.0 demonstrates the closest spatial agreement with ENACT, which is considered a highly reliable and recent gridded rainfall product generated by EMI. This alignment highlights the relatively strong capability of CHIRPS v2.0 in reproducing the spatial rainfall gradients observed in the reference dataset.
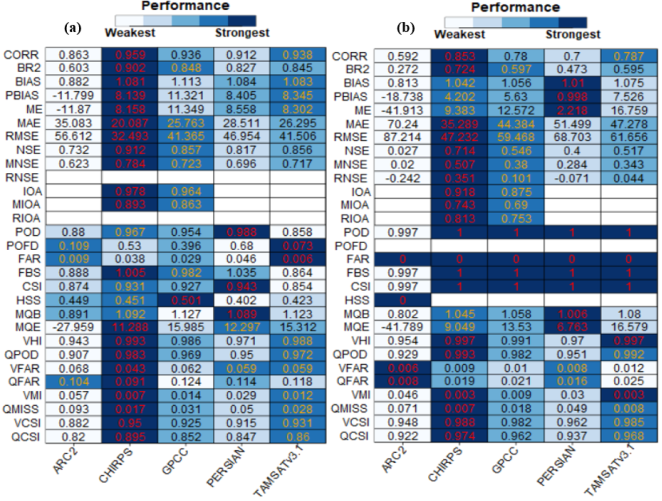
Heat map of summarizes the statistical performance of the evaluated rainfall datasets using correlation (R), bias, root mean square error (RMSE), probability of detection (POD), false alarm ratio (FAR), critical success index (CSI), volumetric hit index (VHI), volumetric false alarm ratio (VFAR), and volumetric critical success index (VCSI). The results reveal substantial differences in the ability of the datasets to reproduce the reference rainfall observations (
Figure 5).
Figure 5. Heatmap of summarizes the statistical performance of the evaluated rainfall for (a) Annual and (b) Kiremt (JJAS).
At the seasonal timescale, CHIRPS demonstrated the strongest overall performance among the evaluated precipitation products, showing excellent agreement with gauge observations with the highest correlation coefficient (R = 0.96). The dataset also recorded the lowest RMSE (32.59 mm) and a near-ideal bias value (BIAS = 1.08), indicating high accuracy with only slight overestimation of seasonal rainfall. These results highlight the capability of CHIRPS to effectively reproduce the temporal variability and spatial distribution of rainfall across the study area. Furthermore, CHIRPS exhibited outstanding rainfall event detection performance, with high POD (0.97), CSI (0.93), and VHI (0.99) values, demonstrating its strong ability to detect and quantify rainfall events and volumes accurately.
In addition, CHIRPS maintained low FAR (0.04) and VFAR (0.04) values, indicating minimal false rainfall detections. GPCC and TAMSATv3.1 also showed relatively strong performance across most evaluation metrics, with good consistency with observed rainfall data and satisfactory event detection capability, making them suitable for seasonal rainfall monitoring and hydro climatic studies. In contrast, ARC2 exhibited comparatively weaker performance, particularly in terms of RMSE and volumetric indices, suggesting larger discrepancies between estimated and observed rainfall amounts. Its lower volumetric skill indicates limitations in accurately representing the magnitude and distribution of seasonal precipitation.
At the annual scale, CHIRPS once again demonstrated superior performance compared to the other evaluated rainfall products, exhibiting the strongest agreement with gauge observations. This was reflected by the highest correlation coefficient (R = 0.85), indicating its strong capability to reproduce interannual rainfall variability across the study area. In addition, CHIRPS achieved the lowest RMSE (47.61 mm), highlighting its high quantitative accuracy and reduced deviation from observed annual rainfall totals. The product also showed exceptional skill in rainfall event detection and volumetric estimation, with near-perfect categorical and volumetric indices, including POD = 1.00, CSI = 1.00, VHI = 1.00, and VCSI = 0.99. These results emphasize the reliability of CHIRPS for annual-scale hydrological and climate-related applications.
Similarly, GPCC and TAMSATv3.1 exhibited relatively strong annual performance, demonstrating good consistency with observed rainfall patterns and acceptable statistical accuracy. However, ARC2 showed comparatively weaker performance, with a lower correlation coefficient (R = 0.60) and a substantially higher RMSE (87.64 mm), indicating larger discrepancies between estimated and observed annual rainfall amounts. These findings suggest that ARC2 has limited capability in accurately capturing annual rainfall variability and magnitude when compared to the other precipitation datasets evaluated.
Table 3. Annual rainfall summarizes the statistical performance of the evaluated rainfall datasets.
Datasets | R | BIAS | RMSE | POD | FAR | CSI | VHI | VFAR | VCSI |
ARC2 | 0.86 | 0.90 | 56.86 | 0.88 | 0.01 | 0.88 | 0.95 | 0.07 | 0.88 |
CHIRPS | 0.96 | 1.08 | 32.59 | 0.97 | 0.04 | 0.93 | 0.99 | 0.04 | 0.95 |
GPCC | 0.94 | 1.11 | 41.25 | 0.95 | 0.03 | 0.93 | 0.99 | 0.06 | 0.93 |
PERSIAN | 0.91 | 1.08 | 46.95 | 0.99 | 0.05 | 0.94 | 0.97 | 0.06 | 0.92 |
TAMSATv3.1 | 0.94 | 1.08 | 41.61 | 0.86 | 0.01 | 0.86 | 0.99 | 0.06 | 0.93 |
Table 4. JJAS rainfall summarizes the statistical performance of the evaluated rainfall datasets.
Datasets | R | BIAS | RMSE | POD | FAR | CSI | VHI | VFAR | VCSI |
ARC2 | 0.60 | 0.83 | 87.64 | 0.99 | 0 | 1.0 | 0.96 | 0.006 | 0.95 |
CHIRPS | 0.85 | 1.04 | 47.61 | 1.0 | 0 | 1.0 | 1.00 | 0.009 | 0.99 |
GPCC | 0.78 | 1.06 | 59.47 | 1.0 | 0 | 1.0 | 0.99 | 0.010 | 0.98 |
PERSIAN | 0.70 | 1.01 | 68.70 | 1.0 | 0 | 1.0 | 0.97 | 0.008 | 0.96 |
TAMSATv3.1 | 0.79 | 1.07 | 61.92 | 1.0 | 0 | 1.0 | 1.00 | 0.011 | 0.99 |
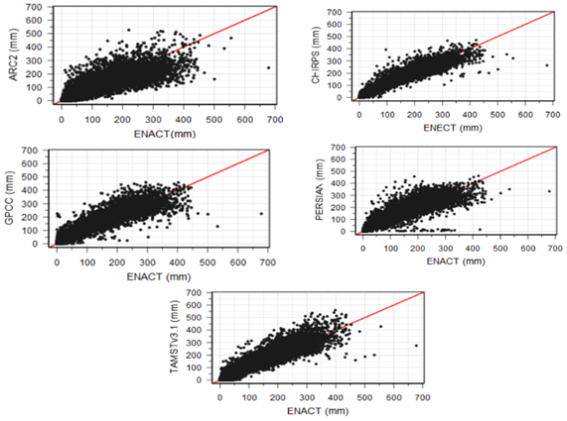
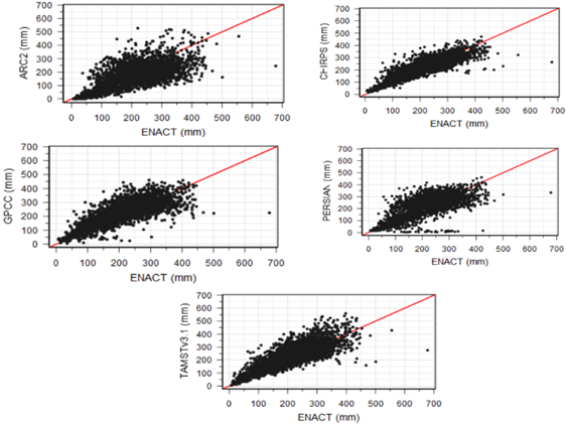
The stronger satellite rainfall performances is demonstrated between CHIRPS2 and ENACT as the rainfall values of CHIRPS2 tightly clustered around the 1:1 line with only a minor positive bias. In contrast, the relative performances of the TAMSAT3, GPCC, PERSIAN and ARC2 were ranked in descending order after CHIRPS2 exhibiting higher relative dispersion and negative bias from 1:1 line which is a clear indication of systematic under prediction bias and reduced values of precision. The overall performance evaluation indicated in this 1:1 line graph depicted that the CHIRPS2 rainfall estimate has better performance than all other satellite products. The second product with greater performance is GPCC.
Figure 6. Annual Line chart comparison of the satellite products and gridded gauge.
Figure 7. JJAS Line chart comparison of the satellite products and gridded gauge.
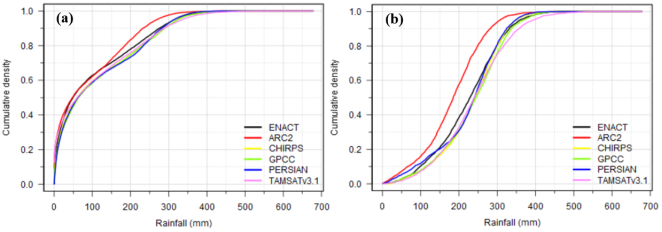
The individual satellite-based rainfall products were evaluated using cumulative distribution function (CDF) against the ENACT gridded rainfall dataset using both annual totals and JJAS (June-September) seasonal totals. The results indicate notable differences in how the products reproduce the observed rainfall distribution.
For ARC2, the CDF analysis shows that this product consistently reports a higher frequency of rainfall totals below 350 mm compared to ENACT, suggesting a tendency toward underestimation in the lower-to-mid rainfall range. However, for rainfall totals exceeding 350 mm, ARC2 aligns more closely with ENACT, indicating comparable performance in capturing higher-magnitude rainfall events. In contrast, the other satellite products of CHIRPS2, GPCC, PERSIANN-CDR, and TAMSAT3 display a different behavior. While their estimation of higher rainfall totals (<=300 mm) is generally consistent with ENACT, they exhibit a higher relative frequency of lower rainfall estimates compared to the reference dataset. This implies a tendency toward overrepresentation of low rainfall values, particularly in the lower tail of the distribution. These patterns were consistently observed for both the annual and JJAS seasonal cumulative rainfall totals, as illustrated in
Figure 8.
Figure 8. Annual Cumulative distribution function (CDF) of rainfall for (a) Annual and (b) Kiremt (JJAS) season during the period of 1991-2020.
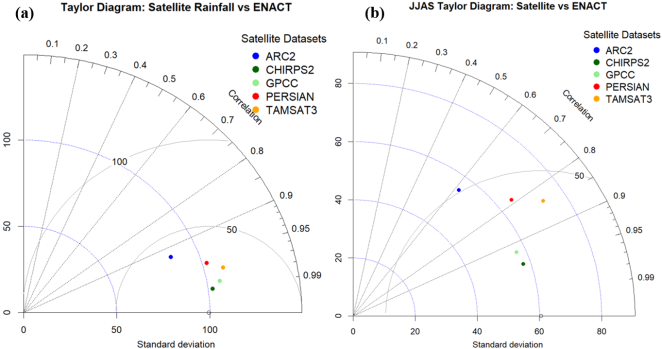
Figure 9. Taylor diagram comparison of (a) annual and (b) JJAS rainfall estimate for four satellite products and GPCC.
Consistent with the findings obtained from the other statistical performance metrics applied in this study, the Taylor diagram provided additional insight into the comparative performance of the satellite rainfall products relative to ENACT, the reference dataset (
Figure 9). The diagram enabled simultaneous evaluation of three key attributes correlation, standard deviation, and root-mean-square difference allowing a more integrated assessment of how closely each satellite product reproduces the statistical characteristics of observed rainfall. For the annual rainfall totals, the highest correlation with ENACT was observed for CHIRPS2, followed by GPCC, TAMSAT3, PERSIANN-CDR, and ARC2, in that order. All products demonstrated relatively strong agreement with ENACT at the annual scale, with correlation coefficients exceeding 0.90. However, the ranking pattern remained largely the same for the JJAS seasonal rainfall, but with a noticeable decline in correlation values. In particular, ARC2 exhibited a substantial drop, with its correlation falling to approximately 0.60, whereas only CHIRPS2 and GPCC maintained correlations above 0.90, even during the JJAS season. In terms of variability, the standard deviation of annual rainfall totals exceeded 100 mm for all satellite products except ARC2, which underestimated the variability relative to ENACT. When ranked from lowest to highest standard deviation, the order for annual totals was: ARC2, CHIRPS2, PERSIANN-CDR, GPCC, and TAMSAT3. A similar ranking trend was observed for the JJAS season, though the magnitude of standard deviation was generally lower, staying below 80 mm for all products, indicating reduced rainfall variability during the main rainy season compared to the full annual cycle. These results collectively highlight that CHIRPS2 and GPCC are the most consistent performers across both temporal scales, whereas ARC2 shows comparatively weaker skill, particularly during the JJAS season.
4.3. Discussion
Large number of studies which validated and evaluated the performance of the rainfall satellite datasets were conducted in different Ethiopian regions. Here we focus on the Upper Blue Nile. In Upper Blue Nile region,
| [24] | Ayehu, G. T., Tadesse, T., Gessesse, B., & Dinku, T. (2018). Validation of new satellite rainfall products over the Upper Blue Nile Basin, Ethiopia. Atmospheric Measurement Techniques, 11(4), 1921–1936.
https://doi.org/10.5194/amt-11-1921-2018 |
| [25] | Belete, M., Deng, J., Wang, K., Zhou, M., Zhu, E., Shifaw, E., & Bayissa, Y. (2020a). Evaluation of satellite rainfall products for modeling water yield over the source region of Blue Nile Basin. Science of the Total Environment, 708.
https://doi.org/10.1016/j.scitotenv.2019.134834 |
[24, 25]
conducted studies in which the performance of CHIRPS, TAMSAT 3, and ARC2 for the period 2000 – 2012, and the CHIRPS, TAMSAT v2 and v3, and TRMM 3B43v7 were assessed respectively. In both studies, CHIRPS exhibited the best performance in rainfall detection regardless of elevation, followed by TAMSAT. ARC2 showed poor performance, while TRMM 3B43v7 performed well over mountainous areas. Moreover,
| [27] | Abdelwares, M., Lelieveld, J., Zittis, G., Haggag, M., & Wagdy, A. (2020). A comparison of gridded datasets of precipitation and temperature over the Eastern Nile Basin region. Euro-Mediterranean Journal for Environmental Integration, 5(1), 1–16. https://doi.org/10.1007/s41207-019-0140-y |
[27]
compared TRMM, CRU, and GPCC datasets to gound stations records, at which the GPCC exibited to have the closest agreement and best performance with gound readings, followed by TRMM, while CRU showed poor agreement with gauge observations. Lastly,
| [30] | Lakew, H. B., Moges, S. A., & Asfaw, D. H. (2020). Hydrological performance evaluation of multiple satellite precipitation products in the upper Blue Nile basin, Ethiopia. Journal of Hydrology: Regional Studies, 27(January), 100664. https://doi.org/10.1016/j.ejrh.2020.100664 |
[30]
evaluated 5 products (CMORPH, TRMM 3B42v7, TMPA, ERA-Interim, GPCC, MSWEP) between 2000 and 2012, in which the MSWEP showed the best performance for summarize the findings of the above-mentioned studies.
Different satellite precipitation products have been launched and widely used in numerous studies and applications in assessing climate variability and climate change
| [31] | Gehne, M., Hamill, T. M., Kiladis, G. N., & Trenberth, K. E. (2016). Comparison of global precipitation estimates across a range of temporal and spatial scales. Journal of Climate, 29(21), 7773–7795. https://doi.org/10.1175/JCLI-D-15-0618.1 |
| [32] | Huffman, G. J., Adler, R. F., Morrissey, M. M., Bolvin, D. T., Curtis, S., Joyce, R., McGavock, B., & Susskind, J. (2001). Global precipitation at one-degree daily resolution from multisatellite observations. Journal of Hydrometeorology, 2(1), 36–50. https://doi.org/10.1175/1525-7541(2001)002<0036:GPAODD>2.0.CO;2 |
[31, 32]
. Most of these products have been evaluated to assess their limitations and uncertainties. The performance of many satellite datasets has been validated at different spatiotemporal scales. The estimated precipitation was not completely consistent, and this can be attributed to their different sources, quality control schemes, and estimation methods. With the research and development, satellite rainfall data products’ accuracy and resolution are increasing, and reached a good level of maturity
| [33] | Adler, R. F., Huffman, G. J., Chang, A., Ferraro, R., Xie, P. P., Janowiak, J., Rudolf, B., Schneider, U., Curtis, S., Bolvin, D., Gruber, A., Susskind, J., Arkin, P., & Nelkin, E. (2003). The version-2 global precipitation climatology project (GPCP) monthly precipitation analysis (1979-present). Journal of Hydrometeorology, 4(6), 1147–1167.
https://doi.org/10.1175/1525-7541(2003)004<1147:TVGPCP>2.0.CO;2 |
| [34] | Feidas, H., Lagouvardos, K., Kotroni, V., & Cartalis, C. (2005). Application of three satellite techniques in support of precipitation forecasts of a NWP model. International Journal of Remote Sensing, 26(24), 5393–5417.
https://doi.org/10.1080/01431160500273551 |
[33, 34]
and
| [4] | Kidd, C., & Huffman, G. (2011). Global precipitation measurement. Meteorological Applications, 18(3), 334–353. |
| [5] | Sun, Q., Miao, C., Duan, Q., Ashouri, H., Sorooshian, S., & Hsu, K. (2018). A review of global precipitation data sets: Data sources, estimation, and intercomparisons. Reviews of Geophysics, 56(1), 79–107. |
[4, 5]
.
5. Conclusion
This study analyzed historical rainfall variability over the Ethiopian Blue Nile Basin during the period 1991–2020 to examine long-term rainfall trends and spatiotemporal distribution patterns that are crucial for water resources management and sustainable development planning. Due to the limitations associated with the availability, spatial coverage, and reliability of ground-based observations, five widely used satellite and gauge-enhanced rainfall products CHIRPS, ARC2, PERSIANN-CDR, TAMSAT, and GPCC were evaluated and compared.
Among the evaluated products, CHIRPS was selected as the reference dataset because of its consistently superior agreement with ground observations across East Africa, as demonstrated in previous studies and operational applications. The improved performance of CHIRPS is primarily associated with its integration of satellite-derived rainfall estimates with station-based observations, including ENACT data, which enhances the accuracy and spatial representation of precipitation estimates.
The evaluation was conducted using both continuous and categorical/volumetric statistical indicators, including correlation coefficient (R), bias, root mean square error (RMSE), probability of detection (POD), false alarm ratio (FAR), critical success index (CSI), volumetric hit index (VHI), volumetric false alarm ratio (VFAR), and volumetric critical success index (VCSI). The results revealed that CHIRPS consistently outperformed the other rainfall products at both seasonal and annual temporal scales. At the seasonal scale, CHIRPS achieved the highest correlation (R = 0.96), the lowest RMSE (32.59 mm), and a near-optimal bias value (1.08), indicating strong consistency with observed rainfall. In addition, the product demonstrated excellent rainfall event detection capability with high POD, CSI, and VHI values, while maintaining relatively low FAR and VFAR values.
Similarly, at the annual scale, CHIRPS again exhibited the best overall performance, characterized by the highest correlation coefficient (R = 0.85), the lowest RMSE (47.61 mm), and near-unity categorical and volumetric indices. Although GPCC and TAMSATv3.1 also showed relatively good performance, ARC2 consistently demonstrated weaker agreement with observed rainfall, reflected by lower correlation and higher RMSE values. The findings further indicate that ARC2 tends to systematically underestimate rainfall across the basin, whereas TAMSATv3.1 shows a tendency to overestimate rainfall totals, particularly over the high-rainfall regions of western Ethiopia during the annual and JJAS seasons.
Spatial comparison results also showed that CHIRPS v2.0 exhibited the closest agreement with ENACT rainfall data, which is considered one of the most reliable gridded precipitation datasets produced by Ethiopian Meteorological Institute. This strong spatial consistency highlights the capability of CHIRPS in accurately reproducing rainfall distribution patterns and spatial gradients across the Ethiopian Blue Nile Basin (BNB).
The findings of this study provide valuable scientific insights for water resources management and related sectors, and can serve as an important reference for researchers, stakeholders, and policy makers in supporting evidence-based planning, climate-related assessments, and informed decision-making processes.
6. Recommendation
Conduct comprehensive attribution analyses of observed historical rainfall trend changes to quantify the respective influences of natural climate variability and anthropogenic climate change, employing advanced statistical approaches and state-of-the-art climate model simulations, and undertake further studies to evaluate the impacts of changing rainfall patterns on agriculture, water resources, environmental systems, and socio-economic conditions, thereby providing scientific evidence to support the development of effective climate adaptation and resource management strategies.
Abbreviations
ENACT | Enhanced National Climate Services Dataset |
CHIRPS | Climate Hazards Group InfraRed Precipitation with Stations |
ARC2 | African Rainfall Climatology Version 2 |
PERSIANN-CDR | Precipitation Estimation from Remotely Sensed Information using Artificial Neural Networks–Climate Data Record |
TAMSAT | Tropical Applications of Meteorology using Satellite Data and Ground-Based Observations |
GPCC | Global Precipitation Climatology Centre |
POD | Probability of Detection |
VHI | Volumetric Hit Index |
CSI | Critical Success Index |
VCSI | Volumetric Critical Success Index |
R | Pearson Correlation Coefficient |
FAR | False Alarm Ratio |
VFAR | Volumetric False Alarm Ratio |
RMSE | Root Mean Square Error |
EMI | Ethiopian Meteorological Institute |
CDF | Cumulative Distribution Function |
JJAS | June-July-August-September |
CMORPH | CPC Morphing Technique (Climate Prediction Center Morphing Technique) |
TRMM 3B42v7 | Tropical Rainfall Measuring Mission Multi-satellite Precipitation Analysis (TMPA) 3B42 Version 7 |
TMPA | TRMM Multi-satellite Precipitation Analysis |
ERA-Interim | European Centre for Medium-Range Weather Forecasts Re-Analysis Interim |
MSWEP | Multi-Source Weighted-Ensemble Precipitation |
CRU | Climatic Research Unit |
BNB | Blue Nile Basin |
Acknowledgments
The author thanks the Ethiopian Meteorological Institute, the data providers of CHIRPS, ARC2, PERSIANN-CDR, TAMSAT, and GPCC.
Author Contributions
Dagmawit Aman Disaso: Data curation, Conceptualization, Formal Analysis, Investigation, Visualization, Investigation, Methodology, Software, Supervision, Validation, Writing – original draft
Olika Desalegn Kitila: Formal Analysis, Validation, Visualization, Investigation, Visualization, Investigation, Methodology, Software, Supervision, Validation, Writing – review & editing
Gezahegn Mergia Tullu: Formal Analysis, Validation, Visualization, Investigation, Visualization, Investigation, Methodology, Software, Writing – review & editing
Conflicts of Interest
The authors’ declaration no conflict of interest.
References
| [1] |
Huang, J., & van den Dool, H. M. (1993). Monthly precipitation-temperature relations and temperature prediction over the United States. Journal of Climate, 6(6), 1111–1132.
|
| [2] |
Stillman, S., Ninneman, J., Zeng, X., Franz, T., Scott, R. L., Shuttleworth, W. J., & Cummins, K. (2014). Summer soil moisture spatiotemporal variability in southeastern Arizona. Journal of Hydrometeorology, 15(4), 1473–1485.
|
| [3] |
Dinku, T., Ceccato, P., Grover‐Kopec, E., Lemma, M., Connor, S. J., & Ropelewski, C. F. (2007). Validation of satellite rainfall products over East Africa’s complex topography. International Journal of Remote Sensing, 28(7), 1503–1526.
|
| [4] |
Kidd, C., & Huffman, G. (2011). Global precipitation measurement. Meteorological Applications, 18(3), 334–353.
|
| [5] |
Sun, Q., Miao, C., Duan, Q., Ashouri, H., Sorooshian, S., & Hsu, K. (2018). A review of global precipitation data sets: Data sources, estimation, and intercomparisons. Reviews of Geophysics, 56(1), 79–107.
|
| [6] |
Awange, J. L., Ferreira, V. G., Forootan, E., Khandu, Andam-Akorful, S. A., Agutu, N. O., & He, X. F. (2016). Uncertainties in remotely sensed precipitation data over Africa. International Journal of Climatology, 36(1), 303–323.
https://doi.org/10.1002/joc.4346
|
| [7] |
Diem, J. E., Hartter, J., Ryan, S. J., & Palace, M. W. (2014). Validation of satellite rainfall products for western Uganda. Journal of Hydrometeorology, 15(5), 2030–2038.
|
| [8] |
Dinku, T., Chidzambwa, S., Ceccato, P., Connor, S. J., & Ropelewski, C. F. (2008). Validation of high‐resolution satellite rainfall products over complex terrain. International Journal of Remote Sensing, 29(14), 4097–4110.
|
| [9] |
Dinku, T., Ceccato, P., & Connor, S. J. (2011). Challenges of satellite rainfall estimation over mountainous and arid parts of east Africa. International Journal of Remote Sensing, 32(21), 5965–5979.
|
| [10] |
Hirpa, F. A., Gebremichael, M., & Hopson, T. (2010). Evaluation of high-resolution satellite precipitation products over very complex terrain in Ethiopia. Journal of Applied Meteorology and Climatology, 49(5), 1044–1051.
|
| [11] |
Maidment, R. I., Grimes, D. I. F., Allan, R. P., Greatrex, H., Rojas, O., & Leo, O. (2013). Evaluation of satellite‐based and model re‐analysis rainfall estimates for Uganda. Meteorological Applications, 20(3), 308–317.
https://doi.org/10.1002/met.1283
|
| [12] |
Maidment, R. I., Grimes, D., Allan, R. P., Tarnavsky, E., Stringer, M., Hewison, T., Roebeling, R., & Black, E. (2014). The 30 year TAMSAT African rainfall climatology and time series (TARCAT) data set. Journal of Geophysical Research: Atmospheres, 119(18), 10–619.
https://doi.org/10.1002/2014JD021927
|
| [13] |
Maidment, R. I., Grimes, D., Black, E., Tarnavsky, E., Young, M., Greatrex, H., Allan, R. P., Stein, T., Nkonde, E., & Senkunda, S. (2017). A new, long-term daily satellite-based rainfall dataset for operational monitoring in Africa. Scientific Data, 4(1), 170063.
https://doi.org/10.1038/sdata.2017.63
|
| [14] |
Romilly, T. G., & Gebremichael, M. (2011). Evaluation of satellite rainfall estimates over Ethiopian river basins. Hydrology and Earth System Sciences, 15(5), 1505–1514.
|
| [15] |
Worqlul, A. W., Maathuis, B., Adem, A. A., Demissie, S. S., Langan, S., & Steenhuis, T. S. (2014). Comparison of rainfall estimations by TRMM 3B42, MPEG and CFSR with ground-observed data for the Lake Tana basin in Ethiopia. Hydrology and Earth System Sciences, 18(12), 4871–4881.
|
| [16] |
Young, M. P., Williams, C. J. R., Chiu, J. C., Maidment, R. I., & Chen, S.-H. (2014). Investigation of discrepancies in satellite rainfall estimates over Ethiopia. Journal of Hydrometeorology, 15(6), 2347–2369.
|
| [17] |
Korecha, D., & Barnston, A. G. (2007). Predictability of June-September rainfall in Ethiopia. Monthly Weather Review, 135(2), 628–650.
https://doi.org/10.1175/MWR3304.1
|
| [18] |
Segele, Z. T., Lamb, P. J., & Leslie, L. M. (2009). Seasonal-to-interannual variability of Ethiopia/horn of Africa monsoon. Part I: associations of wavelet-filtered large-scale atmospheric circulation and global sea surface temperature. Journal of Climate, 22(12), 3396–3421.
|
| [19] |
Conway, D. (2000). The climate and hydrology of the Upper Blue Nile River. Geographical Journal, 166(1), 49–62.
|
| [20] |
Serrat-Capdevila, A., Merino, M., Valdes, J. B., & Durcik, M. (2016). Evaluation of the performance of three satellite precipitation products over Africa. Remote Sensing, 8(10).
https://doi.org/10.3390/rs8100836
|
| [21] |
Cattani, E., Merino, A., Guijarro, J. A., & Levizzani, V. (2018). East Africa Rainfall trends and variability 1983-2015 using three long-term satellite products. Remote Sensing, 10(6), 1–26.
https://doi.org/10.3390/rs10060931
|
| [22] |
Macharia, D., Fankhauser, K., Selker, J. S., Neff, J. C., & Thomas, E. A. (2022). Validation and Intercomparison of Satellite-Based Rainfall Products over Africa with TAHMO In Situ Rainfall Observations. Journal of Hydrometeorology, 23(7), 1131–1154.
https://doi.org/10.1175/JHM-D-21-0161.1
|
| [23] |
Mekonnen, M. B., Wondie, M., & Addisu, S. (2026). Trends and variability of seasonal rainfall in Ethiopian River basins: implications for water resource management. Meteorology Hydrology and Water Management.
|
| [24] |
Ayehu, G. T., Tadesse, T., Gessesse, B., & Dinku, T. (2018). Validation of new satellite rainfall products over the Upper Blue Nile Basin, Ethiopia. Atmospheric Measurement Techniques, 11(4), 1921–1936.
https://doi.org/10.5194/amt-11-1921-2018
|
| [25] |
Belete, M., Deng, J., Wang, K., Zhou, M., Zhu, E., Shifaw, E., & Bayissa, Y. (2020a). Evaluation of satellite rainfall products for modeling water yield over the source region of Blue Nile Basin. Science of the Total Environment, 708.
https://doi.org/10.1016/j.scitotenv.2019.134834
|
| [26] |
Belete, M., Deng, J., Wang, K., Zhou, M., Zhu, E., Shifaw, E., & Bayissa, Y. (2020b). Evaluation of satellite rainfall products for modeling water yield over the source region of Blue Nile Basin. Science of the Total Environment, 708, 134834.
https://doi.org/10.1016/j.scitotenv.2019.134834
|
| [27] |
Abdelwares, M., Lelieveld, J., Zittis, G., Haggag, M., & Wagdy, A. (2020). A comparison of gridded datasets of precipitation and temperature over the Eastern Nile Basin region. Euro-Mediterranean Journal for Environmental Integration, 5(1), 1–16.
https://doi.org/10.1007/s41207-019-0140-y
|
| [28] |
Gorjizadeh, A., & Moridi, A. (2024). Comparative analysis of the performance of gridded precipitation products over Iran. Water Harvesting Research, 7(2), 175–193.
|
| [29] |
Dinku, T., Cousin, J., del Corral, R., & Ceccato, P. (2016). The Enacts Approach. The International Research Institute for Climate and Society (IRI): Palisades, NY, USA.
|
| [30] |
Lakew, H. B., Moges, S. A., & Asfaw, D. H. (2020). Hydrological performance evaluation of multiple satellite precipitation products in the upper Blue Nile basin, Ethiopia. Journal of Hydrology: Regional Studies, 27(January), 100664.
https://doi.org/10.1016/j.ejrh.2020.100664
|
| [31] |
Gehne, M., Hamill, T. M., Kiladis, G. N., & Trenberth, K. E. (2016). Comparison of global precipitation estimates across a range of temporal and spatial scales. Journal of Climate, 29(21), 7773–7795.
https://doi.org/10.1175/JCLI-D-15-0618.1
|
| [32] |
Huffman, G. J., Adler, R. F., Morrissey, M. M., Bolvin, D. T., Curtis, S., Joyce, R., McGavock, B., & Susskind, J. (2001). Global precipitation at one-degree daily resolution from multisatellite observations. Journal of Hydrometeorology, 2(1), 36–50.
https://doi.org/10.1175/1525-7541(2001)002<0036:GPAODD>2.0.CO;2
|
| [33] |
Adler, R. F., Huffman, G. J., Chang, A., Ferraro, R., Xie, P. P., Janowiak, J., Rudolf, B., Schneider, U., Curtis, S., Bolvin, D., Gruber, A., Susskind, J., Arkin, P., & Nelkin, E. (2003). The version-2 global precipitation climatology project (GPCP) monthly precipitation analysis (1979-present). Journal of Hydrometeorology, 4(6), 1147–1167.
https://doi.org/10.1175/1525-7541(2003)004<1147:TVGPCP>2.0.CO;2
|
| [34] |
Feidas, H., Lagouvardos, K., Kotroni, V., & Cartalis, C. (2005). Application of three satellite techniques in support of precipitation forecasts of a NWP model. International Journal of Remote Sensing, 26(24), 5393–5417.
https://doi.org/10.1080/01431160500273551
|
Cite This Article
-
APA Style
Disaso, D. A., Kitila, O. D., Tullu, G. M. (2026). Comparative Evaluation of Satellite Rainfall Estimates Blended with Observation over Ethiopian Blue Nile Basin. Science Futures, 2(3), 203-217. https://doi.org/10.11648/j.scif.20260203.13
 Copy
|
Copy
|
 Download
ACS Style
Disaso, D. A.; Kitila, O. D.; Tullu, G. M. Comparative Evaluation of Satellite Rainfall Estimates Blended with Observation over Ethiopian Blue Nile Basin. Sci. Futures 2026, 2(3), 203-217. doi: 10.11648/j.scif.20260203.13
Copy
|
Download
AMA Style
Disaso DA, Kitila OD, Tullu GM. Comparative Evaluation of Satellite Rainfall Estimates Blended with Observation over Ethiopian Blue Nile Basin. Sci Futures. 2026;2(3):203-217. doi: 10.11648/j.scif.20260203.13
Copy
|
Download
-
@article{10.11648/j.scif.20260203.13,
  author = {Dagmawit Aman Disaso and Olika Desalegn Kitila and Gezahegn Mergia Tullu},
  title = {Comparative Evaluation of Satellite Rainfall Estimates Blended with Observation over Ethiopian Blue Nile Basin},
  journal = {Science Futures},
  volume = {2},
  number = {3},
  pages = {203-217},
  doi = {10.11648/j.scif.20260203.13},
  url = {https://doi.org/10.11648/j.scif.20260203.13},
  eprint = {https://article.sciencepublishinggroup.com/pdf/10.11648.j.scif.20260203.13},
  abstract = {The Ethiopian Blue Nile Basin exhibits pronounced rainfall variability, and projected climate change is expected to further amplify this uncertainty, with significant implications for water resource availability, particularly under conditions of growing demand. This study was undertaken to examine the spatiotemporal variability of rainfall over the Ethiopian Blue Nile Basin through statistical and spatial analysis of historical rainfall records, with the objective of assessing rainfall distribution patterns and evaluating data reliability. The aim of this study was, therefore, to compare and validate the performance of Kiremt and Annual rainfall Gauge-Blended Product (ENACT) with Satellite products (CHIRPS, ARC2, PERSIANN-CDR, TAMSAT, and GPCC) that were collected from satellite during the period of 1991-2020 over the Ethiopian Blue Nile Basin. At the seasonal scale, CHIRPS achieved the highest correlation coefficient (R = 0.96), indicating strong agreement with gauge observations, together with the lowest RMSE (32.59 mm) and a near-optimal bias value (BIAS = 1.08). The product also exhibited excellent rainfall event detection capability, with POD, CSI, and VHI values of 0.97, 0.93, and 0.99, respectively, while maintaining relatively low FAR (0.04) and VFAR (0.04). Similarly, GPCC and TAMSATv3.1 showed relatively strong performance, whereas ARC2 exhibited comparatively lower skill, particularly in terms of RMSE and volumetric indices. At the annual scale, CHIRPS again outperformed the other rainfall products, recording the highest correlation coefficient (R = 0.85), the lowest RMSE (47.61 mm), and near-unity categorical and volumetric statistics, including POD = 1.00, CSI = 1.00, VHI = 1.00, and VCSI = 0.99. Although GPCC and TAMSATv3.1 also demonstrated strong annual performance, ARC2 showed relatively weaker agreement with observed rainfall, characterized by lower correlation (R = 0.60) and higher RMSE (87.64 mm). The results of this study provide crucial information for water resources management, which directly have impacts on human socio-economic life, and environment. It can be used by different stakeholders, researchers, and policy makers to inform decision-making process.},
 year = {2026}
}
Copy
|
Download
-
TY  - JOUR
T1  - Comparative Evaluation of Satellite Rainfall Estimates Blended with Observation over Ethiopian Blue Nile Basin
AU  - Dagmawit Aman Disaso
AU  - Olika Desalegn Kitila
AU  - Gezahegn Mergia Tullu
Y1  - 2026/06/29
PY  - 2026
N1  - https://doi.org/10.11648/j.scif.20260203.13
DO  - 10.11648/j.scif.20260203.13
T2  - Science Futures
JF  - Science Futures
JO  - Science Futures
SP  - 203
EP  - 217
PB  - Science Publishing Group
SN  - 3070-6289
UR  - https://doi.org/10.11648/j.scif.20260203.13
AB  - The Ethiopian Blue Nile Basin exhibits pronounced rainfall variability, and projected climate change is expected to further amplify this uncertainty, with significant implications for water resource availability, particularly under conditions of growing demand. This study was undertaken to examine the spatiotemporal variability of rainfall over the Ethiopian Blue Nile Basin through statistical and spatial analysis of historical rainfall records, with the objective of assessing rainfall distribution patterns and evaluating data reliability. The aim of this study was, therefore, to compare and validate the performance of Kiremt and Annual rainfall Gauge-Blended Product (ENACT) with Satellite products (CHIRPS, ARC2, PERSIANN-CDR, TAMSAT, and GPCC) that were collected from satellite during the period of 1991-2020 over the Ethiopian Blue Nile Basin. At the seasonal scale, CHIRPS achieved the highest correlation coefficient (R = 0.96), indicating strong agreement with gauge observations, together with the lowest RMSE (32.59 mm) and a near-optimal bias value (BIAS = 1.08). The product also exhibited excellent rainfall event detection capability, with POD, CSI, and VHI values of 0.97, 0.93, and 0.99, respectively, while maintaining relatively low FAR (0.04) and VFAR (0.04). Similarly, GPCC and TAMSATv3.1 showed relatively strong performance, whereas ARC2 exhibited comparatively lower skill, particularly in terms of RMSE and volumetric indices. At the annual scale, CHIRPS again outperformed the other rainfall products, recording the highest correlation coefficient (R = 0.85), the lowest RMSE (47.61 mm), and near-unity categorical and volumetric statistics, including POD = 1.00, CSI = 1.00, VHI = 1.00, and VCSI = 0.99. Although GPCC and TAMSATv3.1 also demonstrated strong annual performance, ARC2 showed relatively weaker agreement with observed rainfall, characterized by lower correlation (R = 0.60) and higher RMSE (87.64 mm). The results of this study provide crucial information for water resources management, which directly have impacts on human socio-economic life, and environment. It can be used by different stakeholders, researchers, and policy makers to inform decision-making process.
VL  - 2
IS  - 3
ER  -
Copy
|
Download