
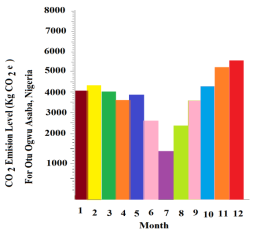
CO2 otherwise carbon-dioxide, is a gas of colourless form comprising of a single carbon and two atoms of oxygen, bonded through reaction. Carbon dioxide status obtainable through appropriate quantification is of importance to agriculture, climate change, human health concerns, etc. Objectively, this work summarily point on "Quantifying CO2 green house gas emissions from soil dredging in drainage basin of River Niger at Otu Ogwu Asaba". In this work, a one year measurement involving field survey, data generation, computations and documentation, with respect to energy consumption by aquatic equipment operations relative to soil dredging which requires burning of diesel and petrol fuels, potentially contributing to atmospheric emittable greenhouse gases of which carbon dioxide (CO2) was primarily focused on. Conclusively, 3,736.03 Kg CO₂e, and 44,832.32 Kg CO₂e, of average and total CO₂ otherwise carbon - dioxid emissions were attributed to the area in general. Also, 1403.64 Kg CO₂e, and, 5565.54 Kg CO₂e, of minimal and maximal CO2 emissions occurred at the area, in the months of July (medium) and December (high) respectively. Moreso, the diesel energy consumption outweighed petrol with respect to their contribution to CO2 emissions to the environment. While balance in environmental emissions were maintained by changing yieldings of low, medium and high CO2 input from human activities as well as atmospheric air mixtures.
| Published in | Journal of Chemical, Environmental and Biological Engineering (Volume 10, Issue 2) |
| DOI | 10.11648/j.jcebe.20261002.17 |
| Page(s) | 98-106 |
| Creative Commons |
This is an Open Access article, distributed under the terms of the Creative Commons Attribution 4.0 International License (http://creativecommons.org/licenses/by/4.0/), which permits unrestricted use, distribution and reproduction in any medium or format, provided the original work is properly cited. |
| Copyright |
Copyright © The Author(s), 2026. Published by Science Publishing Group |
CO2, Green House Gas, Emissions, Soil Dredging, Drainage Basin
Month | Total Active Vessel Propelled Barges Per Day | Daily Energy (Petrol) Consumption Per Vessel (In Litre) | Overall Energy (Petrol) Consumption Per Day (In Litre) | CO2 Daily Emissions Level Per Vessel (Kg CO₂e) | Emissions Classification | CO2 Overall Daily Emissions Level For All Vessels (Kg CO₂e) | Emissions Classification |
|---|---|---|---|---|---|---|---|
January | 9 | 18 | 162 | 41.58 | Low | 374.22 | Low |
February | 7 | 18 | 126 | 41.58 | Low | 291.06 | Low |
March | 8 | 17 | 136 | 39.27 | Low | 314.16 | Low |
April | 7 | 16 | 112 | 36.96 | Low | 258.72 | Low |
May | 7 | 18 | 126 | 41.58 | Low | 291.06 | Low |
June | 5 | 15 | 75 | 34.65 | Low | 173.25 | Low |
July | 6 | 16 | 96 | 36.96 | Low | 221.76 | Low |
August | 7 | 16 | 112 | 36.96 | Low | 258.72 | Low |
September | 7 | 18 | 126 | 41.58 | Low | 291.06 | Low |
October | 11 | 17 | 187 | 39.27 | Low | 431.97 | Low |
November | 10 | 17 | 170 | 39.27 | Low | 392.70 | Low |
December | 13 | 18 | 234 | 41.58 | Low | 540.54 | Low |
Total | 97 | 204 | 1,662 | 471.24 | Low | 3,839.22 | Medium |
Average | 8 | 17 | 139 | 39.27 | Low | 319.94 | Low |
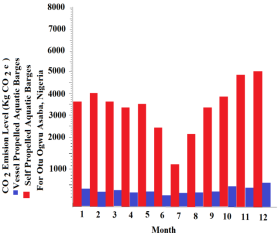
Month | Total Active Vessels | Daily Energy (Diesel) Consumption Per Vessel (In Litre) | Overall Daily Energy (Diesel) Consumption (In Litre) | CO2 Daily Emissions Level Per Vessel (Kg CO₂e) | Emissions Classification | CO2 Overall Daily Emissions Level For All Vessels (Kg CO₂e) | Emissions Classification |
|---|---|---|---|---|---|---|---|
January | 11 | 125 | 1,375 | 335.00 | Low | 3685.00 | Medium |
February | 12 | 125 | 1,500 | 335.00 | Low | 4020.00 | Medium |
March | 11 | 125 | 1,375 | 335.00 | Low | 3685.00 | Medium |
April | 11 | 113 | 1,243 | 302.84 | Low | 3331.24 | Medium |
May | 11 | 120 | 1,320 | 321.60 | Low | 3537.60 | Medium |
June | 8 | 113 | 904 | 302.84 | Low | 2422.72 | Medium |
July | 7 | 63 | 441 | 168.84 | Low | 1181.88 | Medium |
August | 9 | 88 | 792 | 235.84 | Low | 2122.56 | Medium |
September | 11 | 113 | 1,243 | 302.84 | Low | 3331.24 | Medium |
October | 12 | 120 | 1,440 | 321.60 | Low | 3859.20 | Medium |
November | 15 | 120 | 1,800 | 321.60 | Low | 4824.00 | Medium |
December | 15 | 125 | 1875 | 335.00 | Low | 5025.00 | High |
Total | 133 | 1,350 | 15,308 | 3,618 | Medium | 41,025.44 | High |
Average | 11 | 113 | 1,276 | 301.50 | Low | 3,418.79 | Medium |
Month | Total Active Vessels | Energy Consumption (Diesel) Per Vessel (In Litre) | Energy Consumption (Petrol) Per Vessel (In Litre) |
|---|---|---|---|
January | 20 | 125 | 18 |
February | 19 | 125 | 18 |
March | 19 | 125 | 17 |
April | 18 | 113 | 16 |
May | 18 | 120 | 18 |
June | 13 | 113 | 15 |
July | 13 | 63 | 16 |
August | 16 | 88 | 16 |
September | 18 | 113 | 18 |
October | 23 | 120 | 17 |
November | 25 | 120 | 17 |
December | 28 | 125 | 18 |
Total | 230 | 1,350 | 204 |
Average | 19 | 113 | 17 |
Month | CO2 Daily Emissions Level (Kg CO₂e) | Emissions Classification |
|---|---|---|
January | 376.58 | Low |
February | 376.58 | Low |
March | 374.27 | Low |
April | 339.80 | Low |
May | 363.18 | Low |
June | 337.49 | Low |
July | 205.80 | Low |
August | 272.80 | Low |
September | 344.42 | Low |
October | 360.87 | Low |
November | 360.87 | Low |
December | 376.58 | Low |
Total | 4,089.24 | Medium |
Average | 340.77 | Low |
Month | Total Active Vessels | Overall Energy (Diesel) Consumption (In litre) | Overall Energy (Petrol) Consumption (In litre) |
|---|---|---|---|
January | 20 | 1,375 | 162 |
February | 19 | 1,500 | 126 |
March | 19 | 1,375 | 136 |
April | 18 | 1,243 | 112 |
May | 18 | 1,320 | 126 |
June | 13 | 904 | 75 |
July | 13 | 441 | 96 |
August | 16 | 792 | 112 |
September | 18 | 1,243 | 112 |
October | 23 | 1,440 | 187 |
November | 25 | 1,800 | 170 |
December | 28 | 1875 | 234 |
Total | 230 | 15,308 | 1,648 |
Average | 19 | 1,276 | 137 |
Month | CO2 Daily Emissions Level (Kg CO₂e) | Emissions Classification |
|---|---|---|
January | 4059.22 | Medium |
February | 4311.06 | Medium |
March | 3999.16 | Medium |
April | 3589.96 | Medium |
May | 3828.66 | Medium |
June | 2595.97 | Medium |
July | 1403.64 | Medium |
August | 2381.28 | Medium |
September | 3589.96 | Medium |
October | 4291.17 | Medium |
November | 5216.70 | High |
December | 5565.54 | High |
Total | 44,832.32 | High |
Average | 3,736.03 | Medium |
CO2 | Carbon Dioxide |
GHG | Green House Gas |
Kg CO2e | Kilogram carbon dioxide equivalent |
| [1] |
Lindsey R. Climate Change: Atmospheric Carbon Dioxide. National Oceanic And Atmospheric Administration (NOAA) - Climate Change, 2025, p 1, &, 4. Available From:
https://climate.gov/news-features/understanding-climate/climate-change-atmospheric-carbon-dioxide |
| [2] |
University Corporation For Atmospheric Research. UCAR: Carbon Dioxide. Center For Science Education; United States, 2025, p 4. Available From:
https://scied.ucar.edu/learning-zone/how-climate-works/carbon-dioxide |
| [3] | Sato S., Nagai K. Synthetic Polymer - Based Membranes For Acidic Gas Removal - Chapter 9. Synthetic Polymeric Membranes For Advanced Water Treatment, Gas Separation, And Energy Sustainability. 2020, p 173. |
| [4] | Zhang X., Guo S. X., Gandionco K. A., Bond A. M., Zhang J. Electrocatalytic Carbon Dioxide Reduction: From Fundamental Principles To Catalyst Design. Materials Today Advances. 2020, 7(100074), p 3. |
| [5] |
State Of Minnesota Department Of Health. MDH: Carbon Dioxide (CO2). United States Of America, 2024, p 1, &, 5. Available From:
https://health.state.mn.us/communities/environment/air/toxins/co2.html |
| [6] |
National Aeronautics And Space Administration. NASA: What Is The Carbon Cycle? Government Of The United States Of America, 2025, p 3. Available From:
https://science.nasa.gov/kids/earth/what-is-the-carbon-cycle/ |
| [7] | University Of California, Davis. UCD: What Are Greenhouse Gas Emissions? United States Of America, 2021, p 1. Available From: |
| [8] |
Municipal Climate Change Action Centre. MCCAC: How Greenhouse Gas Emissions Are Measured. Edmonton, Alberta, 2020, p 2. Available From:
https://mccac.ca/2020/01/15/how-greenhouse-gas-emissions-are-measured/ |
| [9] |
United Nations Climate Action. UNCA: Causes And Effects Of Climate Change. United Nations, 2025, p 1. Available From:
https://un.org/en/climatechange/science/causes-effects-climate-change |
| [10] | Notteboom T., Pallis A., Rodrigue J. P. Port Economics, Management And Policy - Dredging Activities And Equipment. Port Economics, Management And Policy, 2021, p 2. Available From: |
| [11] | Yang H., Feng Q., Zhu J., Liu G., Dai Y., Zhou Q., Xia S., Wu Z., Zhang Y. Towards Sustainable Futures: A Review Of Sediment Remediation And Resource Valorization Techniques. Journal Of Cleaner Production. 2024, 435(140529), p 11. |
| [12] |
WÄRTSILÄ. Dredging And Dredgers. Encyclopedia Of Marine And Energy, 2025, p 1. Available From:
https://wartsila.com/encyclopedia/term/dredging-and-dredgers |
| [13] | Longman Dictionary of Contemporary English. LDOCE: Basin. Longman Online, 2025, p 2. Available From: |
| [14] | Wikipedia Encyclopedia. WE: Drainage Basin. Wikipedia, 2025, p 1. Available From: |
| [15] | Clean Energy Finance Corporation. CEFC: Baselining GHG Emissions - Reporting Units: Carbon Dioxide Equivalents (CO2-e). Towards Net Zero Agriculture Pathfinder, Australian Government; 2025, p 1. Available From: |
APA Style
Okolotu, G. I., Nwadiolu, R., Akwenuke, O. M., Okeke, C. G. (2026). Quantifying CO2 Green House Gas Emissions from Soil Dredging in Drainage Basin of River Niger at Otu Ogwu Asaba. Journal of Chemical, Environmental and Biological Engineering, 10(2), 98-106. https://doi.org/10.11648/j.jcebe.20261002.17
ACS Style
Okolotu, G. I.; Nwadiolu, R.; Akwenuke, O. M.; Okeke, C. G. Quantifying CO2 Green House Gas Emissions from Soil Dredging in Drainage Basin of River Niger at Otu Ogwu Asaba. J. Chem. Environ. Biol. Eng. 2026, 10(2), 98-106. doi: 10.11648/j.jcebe.20261002.17
AMA Style
Okolotu GI, Nwadiolu R, Akwenuke OM, Okeke CG. Quantifying CO2 Green House Gas Emissions from Soil Dredging in Drainage Basin of River Niger at Otu Ogwu Asaba. J Chem Environ Biol Eng. 2026;10(2):98-106. doi: 10.11648/j.jcebe.20261002.17
@article{10.11648/j.jcebe.20261002.17,
  author = {Godspower Ikechukwu Okolotu and Romanus Nwadiolu and Onoziogie Moses Akwenuke and Chineze Glory Okeke},
  title = {Quantifying CO2 Green House Gas Emissions from Soil Dredging in Drainage Basin of River Niger at Otu Ogwu Asaba},
  journal = {Journal of Chemical, Environmental and Biological Engineering},
  volume = {10},
  number = {2},
  pages = {98-106},
  doi = {10.11648/j.jcebe.20261002.17},
  url = {https://doi.org/10.11648/j.jcebe.20261002.17},
  eprint = {https://article.sciencepublishinggroup.com/pdf/10.11648.j.jcebe.20261002.17},
  abstract = {CO2 otherwise carbon-dioxide, is a gas of colourless form comprising of a single carbon and two atoms of oxygen, bonded through reaction. Carbon dioxide status obtainable through appropriate quantification is of importance to agriculture, climate change, human health concerns, etc. Objectively, this work summarily point on "Quantifying CO2 green house gas emissions from soil dredging in drainage basin of River Niger at Otu Ogwu Asaba". In this work, a one year measurement involving field survey, data generation, computations and documentation, with respect to energy consumption by aquatic equipment operations relative to soil dredging which requires burning of diesel and petrol fuels, potentially contributing to atmospheric emittable greenhouse gases of which carbon dioxide (CO2) was primarily focused on. Conclusively, 3,736.03 Kg CO₂e, and 44,832.32 Kg CO₂e, of average and total CO₂ otherwise carbon - dioxid emissions were attributed to the area in general. Also, 1403.64 Kg CO₂e, and, 5565.54 Kg CO₂e, of minimal and maximal CO2 emissions occurred at the area, in the months of July (medium) and December (high) respectively. Moreso, the diesel energy consumption outweighed petrol with respect to their contribution to CO2 emissions to the environment. While balance in environmental emissions were maintained by changing yieldings of low, medium and high CO2 input from human activities as well as atmospheric air mixtures.},
 year = {2026}
}
TY  - JOUR
T1  - Quantifying CO2 Green House Gas Emissions from Soil Dredging in Drainage Basin of River Niger at Otu Ogwu Asaba
AU  - Godspower Ikechukwu Okolotu
AU  - Romanus Nwadiolu
AU  - Onoziogie Moses Akwenuke
AU  - Chineze Glory Okeke
Y1  - 2026/11/11
PY  - 2026
N1  - https://doi.org/10.11648/j.jcebe.20261002.17
DO  - 10.11648/j.jcebe.20261002.17
T2  - Journal of Chemical, Environmental and Biological Engineering
JF  - Journal of Chemical, Environmental and Biological Engineering
JO  - Journal of Chemical, Environmental and Biological Engineering
SP  - 98
EP  - 106
PB  - Science Publishing Group
SN  - 2640-267X
UR  - https://doi.org/10.11648/j.jcebe.20261002.17
AB  - CO2 otherwise carbon-dioxide, is a gas of colourless form comprising of a single carbon and two atoms of oxygen, bonded through reaction. Carbon dioxide status obtainable through appropriate quantification is of importance to agriculture, climate change, human health concerns, etc. Objectively, this work summarily point on "Quantifying CO2 green house gas emissions from soil dredging in drainage basin of River Niger at Otu Ogwu Asaba". In this work, a one year measurement involving field survey, data generation, computations and documentation, with respect to energy consumption by aquatic equipment operations relative to soil dredging which requires burning of diesel and petrol fuels, potentially contributing to atmospheric emittable greenhouse gases of which carbon dioxide (CO2) was primarily focused on. Conclusively, 3,736.03 Kg CO₂e, and 44,832.32 Kg CO₂e, of average and total CO₂ otherwise carbon - dioxid emissions were attributed to the area in general. Also, 1403.64 Kg CO₂e, and, 5565.54 Kg CO₂e, of minimal and maximal CO2 emissions occurred at the area, in the months of July (medium) and December (high) respectively. Moreso, the diesel energy consumption outweighed petrol with respect to their contribution to CO2 emissions to the environment. While balance in environmental emissions were maintained by changing yieldings of low, medium and high CO2 input from human activities as well as atmospheric air mixtures.
VL  - 10
IS  - 2
ER  -
Department of Agricultural Engineering, Southern Delta University, Ozoro, Nigeria
Biography: Godspower Ikechukwu Okolotu (B. Eng., M. Eng., M. NSE, PhD, Re-COREN) is an academia of Southern Delta University, Ozoro Nigeria, West Africa, in the department of Agricultural Engineering 2023 to present. He attained the climax of his education in 2021 with a PhD in Soil and water engineering from department of Agricultural and Bioresource Engineering, at the Enugu State University of Science and Technology, Nigeria, upon M. Eng., and B. Eng., (2015 and 2011) in same. He also holds a certificate of practicing from Council for the regulation of Engineering In Nigeria from 2021 to present. Scholarly, he has authored multiple published papers.
Research Fields: soil and water conservation and management, hydro status and health, aquatic environments, sphere water recharges, ecosystem, etc.

Department of Agricultural Economics, Southern Delta University, Ozoro, Nigeria
Biography: Romanus Nwadiolu is an academia of Southern Delta University, Ozoro Nigeria (2021 till date). He holds his PhD, masters degree, and bachelors degree in the area of agricultural economics, faculty of agriculture. He has authored various research works, and has registered a substantial record in academics.
Research Fields: agriculture, agroresource, agroconservation, agro safe environment, water relative to agriculture, etc.

Department of Civil and Water Resources Engineering, Southern Delta University, Ozoro, Nigeria
Biography: Onoziogie Moses Akwenuke (B. Eng., M. Eng., PhD, Re-COREN), graduated with a B. Eng in Civil Engineering from Bendel State University in 1986, M. Sc in Environmental Resources Management, Lagos State University, Ojo, Lagos, 2000, PhD in Water Resources/ Environmental Health Engineering, University of Benin, 2015, have published a number of international, national and local research articles in reputable journals, have practiced civil engineering over the years both in the private and public sectors that involves design, construction, management and lecturing.
Research Fields: water resources management and conservation, environment, soil, groundwater, Waterways, etc.
Department of Agricultural and Bioresource Engineering, Enugu State University of Science and Technology, Enugu, Nigeria
Biography: Chineze Glory Okeke (B. Eng., M. Eng., PhD, Re-COREN), an academia of Enugu State University of Science and Technology, Nigeria, holds a PhD (2019) in Bioprocessing Engineering from the department of Agricultural and Bioresource Engineering at Enugu State University of Science and Technology, Nigeria. She has published various research papers in various publishing places.
Research Fields: bio processing, crop processing, agricultural processing, agroconservation, agroenvironments, etc.


Information



 Share This Article
 Twitter
 Linked In
 Facebook

 Copy
 Download