Review Article | | Peer-Reviewed

Interactive Effects of Location and N- Fertilizer Rates on Grain Quality Traits of Bread Wheat Varieties at Arsi Zone, South-Eastern Ethiopia

Received: 6 December 2024     Accepted: 19 December 2024     Published: 31 December 2024
Views:       Downloads:
Abstract

Nowadays it is not only the amount of yield that is important, but also the quality of the grain produced, because the quality of the grain determines the direction of use. In view of this, the current work was conducted in 2017/2018 cropping season with factorial combinations of two bread wheat varieties (Lemu and Wane), five N-rates (0, 46, 92,138 and 184 kg N ha-1) and two different locations (Lemu-Bilbilo and Tiyo). The experiment was laid down using a RCBD with three replications. The results explained that, with the exception of 1000 grain weight (TGW) and hectoliter weight (HLW), the remaining parameters included in this study are significantly influenced by the interactions of location x N-rate x variety, while the two-way interactions of location x variety and N-rate x variety were affected all studied parameters except HLW which didn’t affected by the interaction effects of location x variety. The maximum grain yield (7721 and 7481 kg ha-1) was achieved from Wane and Lemu at Lemu-Bilbilo and Tiyo at N-rates of 184 and 92 kg ha-1, respectively. The peak value of gluten index (GI) (87.9 and 87.4%) was determined in Wane and Lemu varieties, respectively, in unfertilized plot and at N rate of 138 kg ha-1, sequentially and at par with 138 and 184 kg ha-1 for wane and at par with N rate of 46 kg ha-1 plus with unfertilized plot for Lemu variety in Lemu-Bilbilo. The value of GI recorded at unfertilized plots and N-rate of 46 kg ha-1 was significantly at par for Lemu variety, while for wane significantly the same as the GI obtained at N-rate of 46 and 92 kg ha-1 at Tiyo. The effects of N rates at Lemu-Bilbilo was significantly on the same level, but the peak value of wet gluten (55.1%) and dry gluten (20.7%) were gained at 184 kg N ha-1 in Tiyo and significantly the level of 46, 92 & 138 kg N ha-1 for dry gluten and 138 kg N ha-1 for wet gluten. In Lemu-Bilbilo the HLW was increased with an increased N-rate, while in Tiyo it had increased to 92 kg N ha-1. Based on parameters examined, the N rates of 92 and 138 kg ha-1 for both varieties at the Tiyo and Lemu-Bilbilo study sites were therefore economically justifiable.

Published in Journal of Chemical, Environmental and Biological Engineering (Volume 8, Issue 2)
DOI 10.11648/j.jcebe.20240802.14
Page(s) 77-87
Creative Commons

This is an Open Access article, distributed under the terms of the Creative Commons Attribution 4.0 International License (http://creativecommons.org/licenses/by/4.0/), which permits unrestricted use, distribution and reproduction in any medium or format, provided the original work is properly cited.

Copyright

Copyright © The Author(s), 2024. Published by Science Publishing Group

Keywords

Grain Yield, Gluten Index, Wet Gluten, Dry Gluten, Hectoliter Weight, Thousand Grain Weight

1. Introduction
Wheat is one of the main sources of food in the human diet and will become even more important in the future as the world population continues to grow . It is one of the most important cereal crops that are grown by small farmers under rain-field conditions in Ethiopia at high altitudes. In sub-Saharan Africa, Ethiopia is the second largest wheat producer next to South Africa . In terms of area coverage, wheat ranks third next to tef and maize, whereas it ranks second next to maize in total production in Ethiopia . Despite the long history of wheat cultivation and its importance in Ethiopian agriculture, its average yield is still very low and does not exceed 3.1 t/ha , which is below the world average of 4.0 t/ha .
The low yield and productivity of bread wheat in Ethiopia and elsewhere are linked to several biotic, abiotic, and management factors. It is necessary to clearly understand the environmental and environmental impact of genotype interaction in order to meet the expectations of the wheat market to improve high-yielding, stable genotypes with valued quality traits . Nitrogen is the vital nutrient involved in the growth and development of plants. Inadequate nitrogen supply limits crop yields more often than a lack of other essential nutrients. This is due to the fact that in different stages of growth of the plants, various phenomena can cause losses of supplied nitrogen. However, in order to achieve high N use efficiency, it is generally necessary to split the nitrogen between the sowing and a certain growth stage of the culture as a top dressing application. Top dressing of nitrogen, 4 to 6 weeks after sowing, will supplement nitrogen losses in the early season through leaching and volatilization, and provide available fertilizer nitrogen to the plant. The shared application of N is one of the methods to improve N use by the culture while reducing nutrient loss through leaching, denitrification, runoff and volatilization .
The effects of genotypes and the interaction between the environmental factors are of great importance for wheat breeders, agronomists and traders . Nowadays it is not only the amount of yield that is important, but also the quality of the grain produced, because the quality of the grain determines the direction of use. Grain quality is a function of grain composition, principally in proteins, which depends on the genotype and the environment. The genetic effect is mainly reflected by qualitative variation such as protein polymorphism and secondly by quantitative variation of total protein or of different units and subunits. In contrast, the environmental effects such as growing season, site, fertilization was mainly reflected by the quantitative variation, such as in total protein or protein unit and subunit contents . Prior to anthesis, environment affects germination, photosynthesis, tiller formation, and inflorescence development, thereby impacting grain number. After anthesis, environmental conditions primarily affect wheat seed size and composition .
Nitrogen is one of the most important components of plant nutrition, which not only determines the wheat yield to a large extent, but above all the grain quality of wheat. However, in the highlands of Ethiopia, di-ammonium phosphate and urea are the two most commonly used fertilizers for all soil types (locations) for sustainable crop production. These fertilizers are often applied as a blanket recommendation rates (150 kg ha-1 DAP and 100-150 kg ha-1 Urea) for wheat production. In the highlands of Arsi zone where this study was conducted, similar amounts of N and P were applied to enhance wheat production and productivity. Most previous fertilizer studies conducted in the highlands of Ethiopia in general and the Arsi highlands in particular did not take into account grain quality and nitrogen use efficiency; they mainly focused on grain yield and yield components of wheat . In Ethiopian highlands including study areas there is lack of research on effects of genotype, the nutrients, the environment and the interaction of these three factors on the grain quality of wheat. Therefore, the aim of this study was to determine the influence of the growth location and nitrogen fertilizer rates on some grain quality characteristics of bread wheat varieties in the highlands of the Arsi zone in southeastern Ethiopia.
2. Materials and Methods
2.1. Description of the Study Area
During the main cultivation season 2017/18, field trials were carried out in the districts of Lemu-Bilbilo and Tiyo in the Arsi zone, Oromia regional state, Ethiopia. The districts of Tiyo and Lemu Bilbilo are 175 and 235 km away from Addis Ababa in a south-easterly direction. The geographical location of the test fields is 8 01 'N and 39 09' E and 7 32 '41' 'N and 39 15' 17 '' E for the test sites Tiyo and Lemu-Bilbilo. The Tiyo test site is at 2200 m above sea level (m.a.s.l.), while the Lemu-Bilbilo test site is at 2796 m above sea level . Rainfall data recorded during the growing season showed that Lemu-Bilbilo had higher rainfall between July and August than Tiyo and it was even significant in September (Figure 1).
2.2. Soil Sampling and Analyses
Fifteen surface soil samples (0-20 cm) before sowing were randomly collected from the experimental sites in a zigzag walk and bulked into one representative composite soil sample. Three undisturbed soil samples were also collected using a core sampler to determine bulk density. Soil texture, pH, organic carbon, total nitrogen and available phosphorus, and bulk density analyzes were performed according to standard procedures.
2.3. Experimental Design and Treatment Procedures
The trial consisted of a factorial combination of five N-rates (0, 46, 92, 138 and 184 kg ha-1), two bread wheat varieties (Lemu and Wane) and two trial locations (Lemu-Bilbilo and Tiyo) arranged in a randomized complete block design with three replications. Lemu and Wane bread wheat varieties were released in 2016 by the Kulumsa Agricultural Research Center for highland and mid to highland agro-ecologies, respectively. The Lemu variety requires an annual rainfall range of 800-1100 mm while Wane requires an annual rainfall range of 700-1000 mm during its growing period. Both varieties had erect type growth habit and were moderately resistant to stem and stripe rust. The Wane variety has relatively shorter days to maturity than the Lemu variety. Lemu variety has the yield potential of 5.5-6 t/ha whereas; Wane has the yield potential of 5-6 t/ha at research field. The gross plot sizes of the experiments were 4 m long and 2.6 m wide with 20 cm inter row spacing. The net harvestable plot sizes of the experiments were 3.20 m long and 2 m wide (6.4 m2) with 16 central rows. The spacing between plots and blocks were 1 and 1.5 m, respectively. Both bread wheat varieties were sowed in rows with a manual row marker with the recommended seed rate of 125 kg ha-1. In Tiyo study site, sowing was undertaken on July 4, 2017 and the crop was harvested on December 12, 2017, and in Lemu-Bilbilo study site, the dates of sowing and harvest were July 14, 2017 and January 2, 2018, respectively. Urea (46% N) fertilizer was used as source of N and was applied in three split doses (1/3 at sowing, 1/3 at tillering and 1/3 at flowering) as top dress as per the treatments. A basal application of triple superphosphate (TSP) (20% P) at a rate of 100 kg ha-1 was used as a source of phosphorus (P) at the time of sowing on all experimental units. Other agronomic practices such as hoeing, weeding, and applying pesticides were properly performed as recommended by the areas.
2.4. Data Collection and Measurements
Grain yield (kg ha-1): It was measured from the net harvestable plot sizes of 3.20 m long and 2 m wide (6.4 m2). The samples were cleaned following harvesting and threshing, weighed using an electronic balance and adjusted to 12.5% moisture rate. Finally, the yield per plot was converted into per hectare and the average yield given in kg ha-1.
Thousand grain weights (g): It was the weight of 1000 kernels as determined by carefully counting the kernel harvest of each test plot with a kernel counter and weighing it using sensitive scales.
Hectoliter weight (HLW): Homogeneous wheat grain samples were placed in the transfer case of the hectoliter machine at standard speed. The float was then removed and ensured that the product in the transfer housing passed into the measuring housing. After part of the product remaining on the blade had been removed, the filling process was completed and the product was weighed with the fine balance and then changed to kg ha-1.
GlutenIndex(%)= Wet Gluten remained on sieve (g)Total Wet Gluten (g)×100
Wetglutenrate(%)=Total dry gluten weight(g)Weight of flour sample taken(g) × 100
Dryglutenrate(%)=Total wet gluten weight(g)Weight of flour sample taken(g) × 100.
2.5. Data Analysis
The collected data were subjected to analysis of variance using the General Linear Model procedure of R computer software version 4.0.1 . Whenever treatment effects were significant, the mean differences were separated using the Tukey test at 5% level of significance .
Table 1. Some selected soil-physical and chemical properties of the test sites before sowing.

Soil parameters

Tiyo

Rating

Lemu-Bilbilo

Rating

Reference

pH (1:2.5 Water)

5.80

Moderately acidic

5.60

Moderately acidic

Available Phosphorus (mg kg-1)

11.40

High

16.70

High

Organic carbon (%)

2.50

Low

2.54

Low

Total Nitrogen (%)

0.16

Low

0.15

Low

Sand (%)

6.30

Clayey

9.10

Silty clay

Textural class

Clay (%)

22.50

40.40

Silt (%)

71.10

50.50

Bulk Density (g cm-3)

1.30

Low

1.20

Low

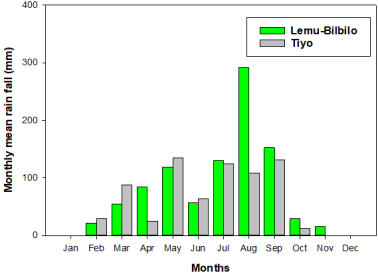
Figure 1. Average monthly rainfall at the study locations Lemu-Bilbilo and Tiyo in 2017.
3. Results and Discussion
Table 2. Mean squares of analysis of variance for location, nitrogen fertilizer rate, varieties and their interactions.

Sources of variation

DF

GYD (kg ha-1)

TGW (g)

HLW (kg hl-1)

GI (%)

WG (%)

DG (%)

Replication

2

63133.00*

12070.00ns

0.62ns

9.00ns

11.00ns

1.84ns

Variety (V)

1

170773.00**

1249830.00**

10.49**

70.00**

106.00**

25.42**

Nitrogen (N)

4

19929969.00**

534894.00**

39.42**

216.00**

130.90**

13.85**

Location (LOC)

1

0.02ns

352105.00**

5.21**

4098.00**

759.10**

119.44**

N*V

4

52201.00**

32172.00**

0.33ns

116.00**

88.20**

13.29**

V*LOC

1

95600.00**

213806.00**

1.15ns

260.00**

42.00*

16.94**

N*LOC

4

894555.00**

286705.00**

8.71**

184.00**

40.50**

3.58**

V*N*LOC

4

43652.00*

13569.00ns

0.82ns

153.00**

59.50**

16.24**

Error

38

12564.00

11441

0.32

220

9.4

1.28

CV (%)

1.77

2.60

0.69

3.29

6.67

6.40

DF=Degree of freedom, GYD=Grain yield, TGW=1000-grain weight, HLW=Hectoliter weight, GI=Gluten index, WG=Wet gluten, DG= Dry gluten, *; ** significant at p < 0.01 and P < 0.05, respectively, ns=Non significant at 5% significance level.
3.1. Grain Yield
The analysis variance results revealed that grain yield was significantly (p<0.01) influenced by the main effects of location, N rate, varieties as well as the interaction effects of location × variety, location × N rate, N rate × variety and location × N rate × varieties (Table 2). With regard to the interaction effect of variety × N rate, a significant average yield increase was observed until the nitrogen fertilizer rate of 92 kg ha-1, and further increase of N rate from 138 to 184 kg ha-1 did not give a significant increase of grain yield for both Lemu and Wane varieties (Figure 2). The rate of increase then declined as yield approached a maximum due to, particularly, increased lodging and/or disease severity with incremental N rate. With respect to the location × N rate, the grain yield was consistently increased with increasing N rate and the highest grain yield (7558.0kg ha-1) was recorded at 184 kg N ha-1 in Lemu-Bilbilo whereas; grain yield was increased up to N rate of 92 kg ha-1 and then decreasing from N rate of 138 to 184 kg ha-1 at Tiyo (Table 4). This might be due to precipitation difference among experimental location and at Lemu-Bilbilo the maximum rainfall was recorded in August which causes leaching of the applied nitrogen (Figure 1). With adequate moisture, however, grain yield at first increased rapidly with incremental increases in N application. As to the interaction effect of location × N rate × variety, grain yield significantly increased with increasing N rate and the highest grain yield was recorded at the peak N rate from both varieties at Lemu-Bilbilo experimental area while; only increasing up to N rate of 92 kg N ha-1 and then decreasing as N rate increased from 138 to 184 kg h-1for two varieties at Tiyo (Table 3). The maximum grain yield was gained at the peak N rate of 184 kg/ha for both varieties at Lemu-Bilbilo experimental site, but the yield difference obtained at N rate of 184 and 138 kg ha-1 as well as among N rate of 138 and 92 kg ha-1 was significantly at par for Lemu variety at this site whereas; the peak grain yield was recorded at N rate of 92 kg ha-1 and didn’t show significant among varieties in Tiyo at this N rate (Table 3). This clearly indicated that, responses of varieties for N rate are different across growth environments. These findings were in line with the work of who stated grain yield and quality parameters of wheat genotypes were affected by genotype and environmental interaction. It has been also suggested that genetic potential alone is not sufficient to explain grain yield in wheat since agronomic factors (soil structure, depth, fertilization, amount of rain and its distribution) and other factors, such as biotic and abiotic stress have an effect on this trait, and therefore in attempts to increase the potential of grain yield, in addition to improving the genetic structure, it is necessary to enhance biotic and abiotic factors .
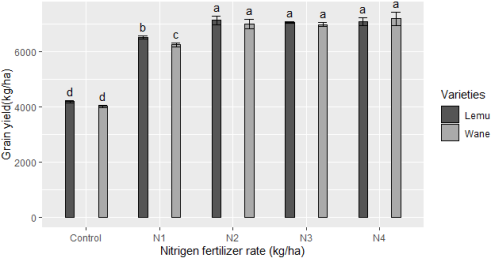
Figure 2. Interaction effect of nitrogen rate and varieties on yield of wheat. N1: 46 kg/ha, N2: 92 kg/ha, N3: 138 kg/ha, N4: 184 kg/ha.
Table 3. Interaction effects of location, N rate and varieties on grain yield and some quality attributes of bread wheat.

Location

Variety

N rate (kg ha-1)

GYD (kg ha-1)

GI (%)

WG (%)

DG (%)

Lemu-Bilbilo

Lemu

0

4086.0a

82.9ghi

47.1defg

18.0cdefg

Lemu-Bilbilo

Lemu

46

5493.0bc

80.2fgh

44.9bcdef

18.1cdefg

Lemu-Bilbilo

Lemu

92

6809.0def

78.7efg

35.8ab

13.4ab

Lemu-Bilbilo

Lemu

138

7027.0efg

87.4hi

37.1abc

14.7abc

Lemu-Bilbilo

Lemu

184

7394.0ghi

73.1def

44.2bcdef

17.0cde

Lemu-Bilbilo

Wane

0

3958.0a

87.9i

34.6a

13.4ab

Lemu-Bilbilo

Wane

46

6196.0b

77.0efg

40.2abcd

15.4abcd

Lemu-Bilbilo

Wane

92

6662.0cde

78.6efg

45.3cdef

17.8cdefg

Lemu-Bilbilo

Wane

138

7138.0fgh

86.3hi

46.8def

17.9cdefg

Lemu-Bilbilo

Wane

184

7721.0i

82.5ghi

47.1defg

17.3cdef

Tiyo

Lemu

0

4295.0a

77.8efg

40.8abcd

15.1abcd

Tiyo

Lemu

46

6541.0bcd

75.6efg

46.3cdef

17.5cdefg

Tiyo

Lemu

92

7481.0hi

64.2bc

44.5bcef

16.3bcd

Tiyo

Lemu

138

7115.0fgh

60.3bc

50.9efg

19.9efg

Tiyo

Lemu

184

6795.0def

62.6bc

53.7fg

20.5efg

Tiyo

Wane

0

4099.0a

52.2a

42.9abcde

18.4defg

Tiyo

Wane

46

6329.0bc

65.9cd

52.0efg

20.9g

Tiyo

Wane

92

7348.0ghi

71.7de

52.9fg

20.7fg

Tiyo

Wane

138

6849.0def

58.3ab

53.5fg

20.2efg

Tiyo

Wane

184

6668.0cde

60.9bc

56.6g

20.9g

CV (%)

1.8

3.3

6.7

6.4

GYD=Grain yield, GI=Gluten index, WG=Wet gluten, DG= Dry gluten. Means with the same letter(s) in the same column of each trait are not significantly different at 5% probability level.
3.2. Thousand Grain Weight
Location, varieties, N rate, and their corresponding two way interactions significantly (p<0.01) affected thousand grain weight (TGW), while their corresponding three way interactions were showed non- significant (Table 2). The results showed that the thousand grain weight of wheat significantly increased with increasing N rate and the greatest value was recorded at N rate of 184 kg ha-1 in Lemu-Bilbilo, but at Tiyo it was increased up to the N rate of 92 kg ha-1 and then decreasing from 138 to 184 kg N ha-1. The value of thousand grain weight gained at N rate of 92 kg ha-1 at Tiyo significantly at par with that of at N rate of 184 kg h-1 in Lemu-Bilbilo (Table 4). This result showed that the reaction of nitrogen fertilizers on this trait varies from location to location. This result was compared with those of who reported that the thousand grain weight was significantly influenced by the nitrogen rate. As with other quality characteristics, the authors also said that the thousand grain weight is site-specific. The interaction of varieties and N rate showed that the thousand grain weight of both Lemu and Wane varieties was significantly increased up to an N rate of 92 kg ha-1 and the application of nitrogen fertilizers above this amount gave no response (Figure 3). This suggests that, in addition to the increased N rate in the soil, it can also be attributed to the prevailing cold and windy weather conditions during the grain filling period. Similar to this finding, recent reports showed that environmental conditions and fertilizers application had a significant impact on the 1000-grain weight and hectoliter weight of various wheat genotypes .
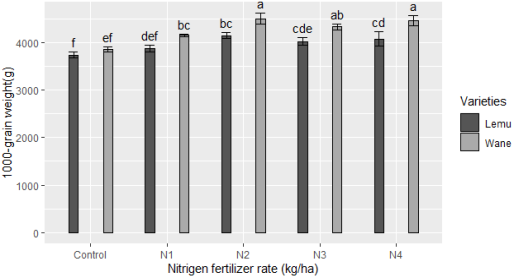
Figure 3. Interaction effect of nitrogen rate and varieties on 1000-grain weight of wheat. N1: 46 kg/ha, N2: 92 kg/ha, N3: 138 kg/ha, N4: 184 kg/ha.
Table 4. Interaction effects of location and N rate on grain yield and some quality attributes bread wheat.

Location

N rate (kg ha-1)

GYD (kg ha-1)

TGW (g)

HLW (kg hl-1)

GI (%)

WG (%)

DG (%)

Lemu-Bilbilo

0

4022.0a

3844.0ab

80.6c

85.4f

40.9a

15.7a

Lemu-Bilbilo

46

6344.0b

4075.0cd

82.0de

78.6e

42.6a

16.7ab

Lemu-Bilbilo

92

6736.0c

4171.0de

82.8ef

78.7e

40.5a

15.3a

Lemu-Bilbilo

138

7083.0d

4315.0ef

83.1ef

86.9f

41.9a

16.3a

Lemu-Bilbilo

184

7558.0e

4543.0g

83.4f

77.8e

45.7ab

17.2abc

Tiyo

0

4197.0a

3751.0a

76.2a

65.0bc

41.9a

16.8ab

Tiyo

46

6435.0b

3947.0abc

77.8b

70.7d

49.1bc

19.2cd

Tiyo

92

7415.0e

4463.0fg

82.5ef

67.9cd

48.7bc

18.5bcd

Tiyo

138

6982.0d

4033.0bcd

81.3cd

59.3a

52.2cd

20.1d

Tiyo

184

6731.0c

3987.0bcd

80.7c

61.7ab

55.1d

20.7d

CV (%)

1.8

2.6

0.7

3.3

6.7

6.4

GYD=Grain yield, TGW=Thousand grain weight, HLW=Hectoliter weight, GI=Gluten index, WG=Wet gluten, DG= Dry gluten. Means with the same letter(s) in the same column of each trait are not significantly different at 5% probability level.
3.3. Hectoliter Weight
Hectoliter weight is considered as one of the important tool in wheat grading system and imperative in the grain trade because most grains are sold at a certain hectoliter weight. The analysis of variance results clearly demonstrated that the hectoliter weight was significantly (p<0.01) affected by the main effects of locations, N rates and varieties as well as by location x N rate interactions (Table 2). It has been reported that hectoliter weight varies according to the seed shape, volume and density of grain and it is also affected by the plant’s ability of adaptation to the environment . Hectoliter weight was linearly increased with increasing N rate at Lemu-Bilbilo while significantly increased up to N rate 92 kg ha-1 in Tiyo experimental site (Table 4). The maximum hectoliter weight (83.4 kg hl-1) was recorded at 184 kg N ha-1 in Lemu-Bilbilo and didn’t show significant with N rates of 92 and 138 and with 92 kg N ha-1 at Tiyo. Agreeing with these results found that under more favorable growing conditions slight increase hectoliter weight in response to N fertilizer application. The hectoliter differences might be partially attributed due to different growing and environmental conditions prevailed during growing periods .
3.4. Gluten Index
The gluten index is defined as the percentage of wet gluten that remains on a special sieve during preparation and centrifugation according to the prescribed standardized procedure and is an important quality indicator . Analysis of variance indicated that gluten index was significantly (p<0.01) influenced by the main effects of location, varieties, N rates and their corresponding two and three way interactions (Table 2). This result was confirmed with the findings of who revealed that genotypes, growing environments, and their interaction significantly affected gluten index, with the highest effect being from the genotypes. The three-way interactions of location, N-rate and varieties showed that the gluten index was lowered from the N-unfertilized plot to N-rate of 92 kg ha-1 for both varieties in Lemu-Bilbilo, then the fluctuations of its values whereas; at Tiyo, the gluten index for the Lemu variety decreased to an N-rate of 138 kg ha-1, but conversely, the gluten index for the Wane variety rose to an N-rate of 92 kg ha-1 and the values were above this rate vary (Table 3). The gluten index (GI) values vary from 73.1 to 87.9 % at Lemu-Bilbilo whereas from 52.2 to 77.8 % at Tiyo. The gluten quality is weak (GI < 30%), normal (GI = 30–80%), or strong (GI > 80%) .
According to this rating the GI gained from both varieties at different N rates falls under normal to strong at Lemu-Bilbilo and normal gluten at Tiyo experimental site, respectively. With contrary to location with variety interactions results showed significantly the highest gluten index was recorded at Lemu-Bilbilo experimental site from both varieties than Tiyo experimental site. The more gluten index advantage of 18.2 and 33.5% were gained at Lemu-Bilbilo from Lemu and Wane varieties, respectively than at Tiyo experimental site (Table 5). These results revealed that gluten index difference of varieties were due to the function of growth locations. Significantly the peak gluten index was gained from Lamu variety than Wane at Tiyo but, the non-significant difference among varieties was observed at Lemu-Bilbilo. Agreeing these results stated that the gluten index had little dependence on the environment being determined to the greatest extent by the genotype. Confirmed with these results it was stated that the gluten index was a stable technological quality trait, dependent on the genotype . As indicated in figure 4, cross over interactions was occurred among varieties with response to nitrogen fertilizer rates and the gluten index of Lemu variety was decreased as N rate increased from 0 to 92 kg ha-1 whereas the inverse relationship was occurred for Wane variety as N rate increased from 0 to 92 kg ha-1. This shows the gluten index was depend on the variation in response of varieties to different nitrogen concentrations. Other study also found that the cultivar was the most important factor influencing gluten index, but environmental and management factors also exerted a strong influence .
Table 5. Interaction effects of location and varieties on grain yield and some quality attributes of bread wheat.

Location

Variety

GYD (kg ha-1)

TGW (g)

GI (%)

WG (%)

DG (%)

Lemu-Bilbilo

Lemu

6362.0ab

4105.0b

80.5c

41.8a

16.1a

Lemu-Bilbilo

Wane

6335.0a

4274.0c

82.5c

42.8a

16.4a

Tiyo

Lemu

6445.0b

3832.0a

68.1b

47.3b

17.9b

Tiyo

Wane

6259.0a

4240.0c

61.8a

51.6c

20.2c

CV (%)

1.8

2.6

3.3

6.7

6.4

GYD=Grain yield, TGW=Thousand grain weight, GI=Gluten index, WG=Wet gluten, DG= Dry gluten. Means with the same letter(s) in the same column of each trait are not significantly different at 5% probability level.
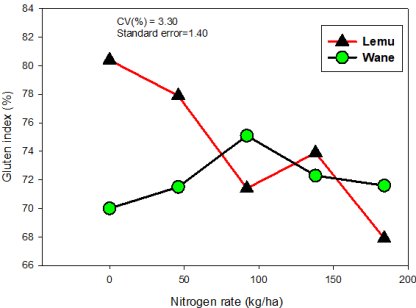
Figure 4. Interaction effect of nitrogen rate and varieties on gluten index of wheat.
3.5. Wet Gluten
Wet gluten is the rubbery mass that remains after washing the dough obtained from wheat flour, with water or other solution, in certain conditions, to remove the starch and other soluble compounds of the sample . It was significantly (p<0.01) affected by the main and two as well as three interaction effects of location, N rates and varieties (Table 2). The three way interactions of location, N rate and variety showed that the wet gluten of Wane variety significantly increased with increasing N rate at both Lemu-Bilbilo and Tiyo experimental sites, but the wet gluten of Lemu variety was increased with increasing N rate only at Tiyo and consistently decreased up to N rate of 92 kg ha-1 then showed fluctuation of its values at Lemu-Bilbilo experimental sites (Table 3). The highest wet gluten (47.1%) was recorded at unfertilized plot and at N rate of 184 kg ha-1 from Lamu and Wane, respectively at Lemu-Bilbilo and showed non-significant with N rate of 46 kg ha-1. This difference might be due to genetic makeup of varieties. At Tiyo experimental site the wet gluten obtained from both varieties didn’t show significant among all N rates. The interaction effects of location and N rate presented in Table 4. The wet gluten difference between N rates at Lemu-Bilbilo showed non-significant and showed significant at Tiyo. The peak wet gluten (20.7%) was recorded from N rate of 184 kg ha-1 and didn’t show significant with the N rates of 46, 92 and 138 kg ha-1 at Tiyo whereas showed significant with all N rates at Lemu-Bilbilo experimental site. As showed in figure 5 the wet gluten of Wane variety slightly increased with increasing N rates whereas the wet gluten of Lemu variety was decreased sharply from N rates of 46 to 92 kg ha-1 then increased as N rate changed from 92 to 184 kg ha-1 and non-significant differences were observed among N rate of 46 kg ha-1 and above this rates for both varieties.
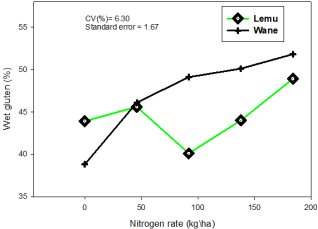
Figure 5. Interaction effect of nitrogen rate and varieties on wet gluten of wheat.
3.6. Dry Gluten
Dry gluten gives the dry matter of gluten protein present in flour and water absorption capacity of gluten present in flour. It was significantly (p<0.01) affected by the main effects of location, N rates, and varieties plus by their two way interactions and three way interactions of location × N rate × varieties (Table 2). With respect to three way interactions of location, N rate and variety, the results revealed that the dry gluten of Wane variety significantly increased with increasing N rate up to N rate of 138 kg ha-1 at Lemu-Bilbilo and from 92 to 184 kg N ha-1 for Lemu variety at Tiyo experimental site (Table 3). Consistent with this result a recent study by found that genetics, management and environment can have an effect on wheat quality. Significantly the higher dry gluten was obtained from both varieties at Tiyo experimental site and didn’t show significant among varieties at Lemu-Bilbilo whereas significantly the higher dry gluten (20.2 %) was gained from Wane variety at Tiyo experimental site (Table 5). The interaction effects of location and N rate displayed in Table 4. The highest value of dry gluten (20.7%) was recorded at Tiyo and showed significant with all N treatments at Lemu-Bilbilo, but only showed significant with unfertilized plot at Tiyo. With concern to the interactions effect of N rate and varieties the dry gluten of Lemu variety was increased with increasing N rate up to 92 kg ha-1 whereas for Wane variety dry gluten was increased from N rate 92 to 184 kg ha-1, but the dry gluten recorded at 46 kg N ha-1 didn’t show significant with the rest N rates except with control plot for both varieties (Figure 6).
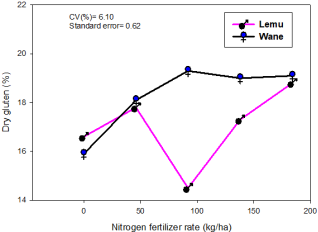
Figure 6. Interaction effect of nitrogen rate and varieties on dry gluten of wheat.
4. Conclusions
The pre-experiment soil analysis results showed that the soils of Tiyo and Lemu-Bilbilo experimental sites had clayey and silty clay textural classes, which were classified as moderate acidity, low organic carbon, low total nitrogen, and high available phosphorus, respectively. The results of this study also concluded that main effects of N fertilization, location, varieties as well as their two and three-way interactions have a large impact on grain yield, gluten index, wet and dry gluten of bread wheat. The 1000-grain weight was influenced by the main effects N rate, location, varieties and their corresponding two way interactions while hectoliter weight was significantly affected by the interaction effects of location and N rate in addition to the main effects. The highest grain yield was achieved at 184 kg N ha-1 for both varieties at Lemu-Bilbilo and was not significant at 138 kg N ha-1 for the Lemu variety, while at 92 kg N ha-1 on the Tiyo test site for both varieties. The thousand grain weight and the hectoliter weight were significantly increased with increasing N rate in Lemu-Bilbilo, but up to an N rate of 92 kg ha-1 in Tiyo. The gluten index values vary from 73.1 to 87.9% for Lemu-Bilbilo, while they vary from 52.2 to 77.8% for Tiyo. The wet gluten of the Wane variety increased significantly with increasing N-rates at both locations, but in Tiyo the wet gluten obtained from both varieties did not show significant below all of the N-rates. The dry gluten of the Wane variety was increased to an N rate of 138 kg ha-1 in Lemu-Bilbilo and from 92 to 184 kg N ha-1 for the Lemu variety on the Tiyo test site. Thus, the N rate of 92 at Tiyo and 138 kg ha-1 at Lemu-Bilbilo were economically feasible to produce grains of the Lemu and Wane varieties with good quality characteristics. However, even though this experiment was conducted at two locations in a single cropping season, it is better to add locations and cropping year to give sound recommendation.
Abbreviations

CSA

Central Statistical Agency

RCBD

Randomized Complete Block Design

Acknowledgments
I would like to acknowledge the Ethiopian Institute of Agricultural Research and Kulumsa Agricultural Research Center for their support in providing finance and logistics to conduct this study.
Conflicts of Interest
The authors declare no conflicts of interest.
References
[1] Abdulkerim, J., Tana, T. and Eticha, F., 2015. Response of bread wheat (Triticum aestivum L.) varieties to seeding rates at Kulumsa, South Eastern Ethiopia. Asian Journal of Plant Sciences, 14(2), p. 50.
[2] Bouacha, O. D., Nouaigui, S. and Rezgui, S., 2014. Effects of N and K fertilizers on durum wheat quality in different environments. Journal of cereal science, 59(1), pp. 9-14.
[3] Braun, H. J., Atlin, G. and Payne, T., 2010. Multi-location testing as a tool to identify plant response to global climate change. Climate change and crop production, 1, pp. 115-138.
[4] Clarke, F. R., Clarke, J. M., Pozniak, C. J., Knox, R. E. and McCaig, T. N., 2009. Protein concentration inheritance and selection in durum wheat. Canadian journal of plant science, 89(4), pp. 601-612.
[5] Costa, R., Pinheiro, N., Almeida, A. S. and Maçãs, B., 2012. Influence of enhanced UV-B radiation on wheat production in relation with abiotic, biotic and socioeconomics constraints. Emirates Journal of Food & Agriculture (EJFA), 24(6).
[6] Costa, R., Pinheiro, N., Almeida, A. S., o Gomes, C., Coutinho, J., o Coco, J., Costa, A. and Maçãs, B., 2013. Effect of sowing date and seeding rate on bread wheat yield and test weight under Mediterranean conditions. Emirates Journal of Food and Agriculture, pp. 951-961.
[7] CSA. 2022. Agricultural sample survey: Report on area and production of major crops (Private peasant holdings, Meher Season). Volume I Statistical Bulletins 593, Addis Ababa, Ethiopia.
[8] Cubadda, R., Carcea, M. and Pasqui, L. A., 1992. Suitability of the gluten index method for assessing gluten strength in durum wheat and semolina. Cereal foods world (USA).
[9] Dadrasi, A., Chaichi, M., Nehbandani, A., Soltani, E., Nemati, A., Salmani, F., Heydari, M. and Yousefi, A. R., 2023. Global insight into understanding wheat yield and production through Agro-Ecological Zoning. Scientific Reports, 13(1), p. 15898.
[10] Dobocha, D., Abera, G. and Worku, W., 2019. Grain quality and nitrogen use efficiency of bread wheat (Triticum aestivum L.) varieties in response to nitrogen fertilizer in Arsi highlands, southeastern Ethiopia. African Journal of Agricultural Research, 14(32), pp. 1544-1552.
[11] DuPont, F. M. and Altenbach, S. B., 2003. Molecular and biochemical impacts of environmental factors on wheat grain development and protein synthesis. Journal of cereal science, 38(2), pp. 133-146.
[12] Ferrari, M. C., Clerici, M. T. P. S. and Chang, Y. K., 2014. A comparative study among methods used for wheat flour analysis and for measurements of gluten properties using the Wheat Gluten Quality Analyser (WGQA). Food Science and Technology, 34(2), pp. 235-242.
[13] Gerba, L., Getachew, B., & Walelign, W. (2013). Nitrogen fertilization effects on grain quality of durum wheat (Triticum turgidum L. var. durum) varieties in central Ethiopia.
[14] Gil, D. H., Bonfil, D. J. and Svoray, T., 2011. Multi scale analysis of the factors influencing wheat quality as determined by Gluten Index. Field Crops Research, 123(1), pp. 1-9.
[15] Gomez, K. A. and Gomez, A. A., 1984. Statistical procedures for agricultural research. John wiley & sons.
[16] Hazelton, P. and Murphy, B., 2016. Interpreting soil test results: What do all the numbers mean?. CSIRO publishing.
[17] Hossain, M. M., Hossain, A., Alam, M. A., Sabagh, A. E. L., Murad, K. F. I., Haque, M. M. and Das, S., 2018. Evaluation of fifty irrigated spring wheat genotypes grown under late sown heat stress condition in multiple environments of Bangladesh. Fresen. Environ. Bull, 27, pp. 5993-6004.
[18] Kaushik, R., Chawla, P., Kumar, N., Janghu, S. and Lohan, A., 2018. Effect of premilling treatments on wheat gluten extraction and noodle quality. Food Science and Technology International, 24(7), pp. 627-636.
[19] Kizilgeci, F., 2019. Physiological, agronomical and quality response of bread wheat to phosphorus application under dryland condition. Appl Ecol Environ Res, 17(2), pp. 1979-1987.
[20] Landon, J. R., 2014. Booker tropical soil manual: a handbook for soil survey and agricultural land evaluation in the tropics and subtropics. Routledge.
[21] Mutwali, N. I., Mustafa, A. I., Gorafi, Y. S. and Mohamed Ahmed, I. A., 2016. Effect of environment and genotypes on the physicochemical quality of the grains of newly developed wheat inbred lines. Food Science & Nutrition, 4(4), pp. 508-520.
[22] Nadeem, M. A., Karaköy, T., Yeken, M. Z., Habyarimana, E., Hatipoğlu, R., Çiftçi, V., Nawaz, M. A., Sönmez, F., Shahid, M. Q., Yang, S. H. and Chung, G., 2020. Phenotypic characterization of 183 Turkish common bean accessions for agronomic, trading, and consumer-preferred plant characteristics for breeding purposes. Agronomy, 10(2), p. 272.
[23] Shiferaw, B., Smale, M., Braun, H. J., Duveiller, E., Reynolds, M. and Muricho, G., 2013. Crops that feed the world 10. Past successes and future challenges to the role played by wheat in global food security. Food Security, 5(3), pp. 291-317.
[24] Tadesse, T., Haque, I. and Aduayi, E. A., 1991. Soil, plant, water, fertilizer, animal manure & compost analysis manual.
[25] Terefe, D., Desalegn, T. and Ashagre, H., 2018. Effect of nitrogen fertilizer levels on grain yield and quality of malt barley (Hordeum vulgare L.) varieties at Wolmera District, Central Highland of Ethiopia. International Journal of Research Studies in Agricultural Sciences4, 4, pp. 29-43.
[26] Tidiane Sall, A., Chiari, T., Legesse, W., Seid-Ahmed, K., Ortiz, R., Van Ginkel, M. and Bassi, F. M., 2019. Durum wheat (Triticum durum Desf.): Origin, cultivation and potential expansion in Sub-Saharan Africa. Agronomy, 9(5), p. 263.
[27] Triboi, E., Abad, A., Michelena, A., Lloveras, J., Ollier, J. L. and Daniel, C., 2000. Environmental effects on the quality of two wheat genotypes: 1. Quantitative and qualitative variation of storage proteins. European Journal of Agronomy, 13(1), pp. 47-64.
[28] Vázquez, D., Berger, A. G., Cuniberti, M., Bainotti, C., de Miranda, M. Z., Scheeren, P. L., Jobet, C., Zúñiga, J., Cabrera, G., Verges, R. and Peña, R. J., 2012. Influence of cultivar and environment on quality of Latin American wheats. Journal of Cereal Science, 56(2), pp. 196-203.
[29] Vida, G., Szunics, L., Veisz, O., Bedő, Z., Láng, L., Árendás, T., Bónis, P. and Rakszegi, M., 2014. Effect of genotypic, meteorological and agronomic factors on the gluten index of winter durum wheat. Euphytica, 197(1), pp. 61-71.
[30] Wang, S., Wang, X., Qu, Y., Cheng, X. and Shen, H., 2019. R Software Implementation Based on Exploratory Factor Analysis.
[31] Yadav, M. R., Kumar, R., Parihar, C. M., Yadav, R. K., Jat, S. L., Ram, H., Meena, R. K., Singh, M., Verma, A. P., Kumar, U. J. A. R. and Ghosh, A., 2017. Strategies for improving nitrogen use efficiency: A review. Agricultural Reviews, 38(1), pp. 29-40.
Cite This Article
  • APA Style

    Dobocha, D., Negasa, G., Abera, G. (2024). Interactive Effects of Location and N- Fertilizer Rates on Grain Quality Traits of Bread Wheat Varieties at Arsi Zone, South-Eastern Ethiopia. Journal of Chemical, Environmental and Biological Engineering, 8(2), 77-87. https://doi.org/10.11648/j.jcebe.20240802.14

    Copy | Download

    ACS Style

    Dobocha, D.; Negasa, G.; Abera, G. Interactive Effects of Location and N- Fertilizer Rates on Grain Quality Traits of Bread Wheat Varieties at Arsi Zone, South-Eastern Ethiopia. J. Chem. Environ. Biol. Eng. 2024, 8(2), 77-87. doi: 10.11648/j.jcebe.20240802.14

    Copy | Download

    AMA Style

    Dobocha D, Negasa G, Abera G. Interactive Effects of Location and N- Fertilizer Rates on Grain Quality Traits of Bread Wheat Varieties at Arsi Zone, South-Eastern Ethiopia. J Chem Environ Biol Eng. 2024;8(2):77-87. doi: 10.11648/j.jcebe.20240802.14

    Copy | Download

  • @article{10.11648/j.jcebe.20240802.14,
      author = {Dereje Dobocha and Gobena Negasa and Girma Abera},
      title = {Interactive Effects of Location and N- Fertilizer Rates on Grain Quality Traits of Bread Wheat Varieties at Arsi Zone, South-Eastern Ethiopia
    },
      journal = {Journal of Chemical, Environmental and Biological Engineering},
      volume = {8},
      number = {2},
      pages = {77-87},
      doi = {10.11648/j.jcebe.20240802.14},
      url = {https://doi.org/10.11648/j.jcebe.20240802.14},
      eprint = {https://article.sciencepublishinggroup.com/pdf/10.11648.j.jcebe.20240802.14},
      abstract = {Nowadays it is not only the amount of yield that is important, but also the quality of the grain produced, because the quality of the grain determines the direction of use. In view of this, the current work was conducted in 2017/2018 cropping season with factorial combinations of two bread wheat varieties (Lemu and Wane), five N-rates (0, 46, 92,138 and 184 kg N ha-1) and two different locations (Lemu-Bilbilo and Tiyo). The experiment was laid down using a RCBD with three replications. The results explained that, with the exception of 1000 grain weight (TGW) and hectoliter weight (HLW), the remaining parameters included in this study are significantly influenced by the interactions of location x N-rate x variety, while the two-way interactions of location x variety and N-rate x variety were affected all studied parameters except HLW which didn’t affected by the interaction effects of location x variety. The maximum grain yield (7721 and 7481 kg ha-1) was achieved from Wane and Lemu at Lemu-Bilbilo and Tiyo at N-rates of 184 and 92 kg ha-1, respectively. The peak value of gluten index (GI) (87.9 and 87.4%) was determined in Wane and Lemu varieties, respectively, in unfertilized plot and at N rate of 138 kg ha-1, sequentially and at par with 138 and 184 kg ha-1 for wane and at par with N rate of 46 kg ha-1 plus with unfertilized plot for Lemu variety in Lemu-Bilbilo. The value of GI recorded at unfertilized plots and N-rate of 46 kg ha-1 was significantly at par for Lemu variety, while for wane significantly the same as the GI obtained at N-rate of 46 and 92 kg ha-1 at Tiyo. The effects of N rates at Lemu-Bilbilo was significantly on the same level, but the peak value of wet gluten (55.1%) and dry gluten (20.7%) were gained at 184 kg N ha-1 in Tiyo and significantly the level of 46, 92 & 138 kg N ha-1 for dry gluten and 138 kg N ha-1 for wet gluten. In Lemu-Bilbilo the HLW was increased with an increased N-rate, while in Tiyo it had increased to 92 kg N ha-1. Based on parameters examined, the N rates of 92 and 138 kg ha-1 for both varieties at the Tiyo and Lemu-Bilbilo study sites were therefore economically justifiable.
    },
     year = {2024}
    }
    

    Copy | Download

  • TY  - JOUR
    T1  - Interactive Effects of Location and N- Fertilizer Rates on Grain Quality Traits of Bread Wheat Varieties at Arsi Zone, South-Eastern Ethiopia
    
    AU  - Dereje Dobocha
    AU  - Gobena Negasa
    AU  - Girma Abera
    Y1  - 2024/12/31
    PY  - 2024
    N1  - https://doi.org/10.11648/j.jcebe.20240802.14
    DO  - 10.11648/j.jcebe.20240802.14
    T2  - Journal of Chemical, Environmental and Biological Engineering
    JF  - Journal of Chemical, Environmental and Biological Engineering
    JO  - Journal of Chemical, Environmental and Biological Engineering
    SP  - 77
    EP  - 87
    PB  - Science Publishing Group
    SN  - 2640-267X
    UR  - https://doi.org/10.11648/j.jcebe.20240802.14
    AB  - Nowadays it is not only the amount of yield that is important, but also the quality of the grain produced, because the quality of the grain determines the direction of use. In view of this, the current work was conducted in 2017/2018 cropping season with factorial combinations of two bread wheat varieties (Lemu and Wane), five N-rates (0, 46, 92,138 and 184 kg N ha-1) and two different locations (Lemu-Bilbilo and Tiyo). The experiment was laid down using a RCBD with three replications. The results explained that, with the exception of 1000 grain weight (TGW) and hectoliter weight (HLW), the remaining parameters included in this study are significantly influenced by the interactions of location x N-rate x variety, while the two-way interactions of location x variety and N-rate x variety were affected all studied parameters except HLW which didn’t affected by the interaction effects of location x variety. The maximum grain yield (7721 and 7481 kg ha-1) was achieved from Wane and Lemu at Lemu-Bilbilo and Tiyo at N-rates of 184 and 92 kg ha-1, respectively. The peak value of gluten index (GI) (87.9 and 87.4%) was determined in Wane and Lemu varieties, respectively, in unfertilized plot and at N rate of 138 kg ha-1, sequentially and at par with 138 and 184 kg ha-1 for wane and at par with N rate of 46 kg ha-1 plus with unfertilized plot for Lemu variety in Lemu-Bilbilo. The value of GI recorded at unfertilized plots and N-rate of 46 kg ha-1 was significantly at par for Lemu variety, while for wane significantly the same as the GI obtained at N-rate of 46 and 92 kg ha-1 at Tiyo. The effects of N rates at Lemu-Bilbilo was significantly on the same level, but the peak value of wet gluten (55.1%) and dry gluten (20.7%) were gained at 184 kg N ha-1 in Tiyo and significantly the level of 46, 92 & 138 kg N ha-1 for dry gluten and 138 kg N ha-1 for wet gluten. In Lemu-Bilbilo the HLW was increased with an increased N-rate, while in Tiyo it had increased to 92 kg N ha-1. Based on parameters examined, the N rates of 92 and 138 kg ha-1 for both varieties at the Tiyo and Lemu-Bilbilo study sites were therefore economically justifiable.
    
    VL  - 8
    IS  - 2
    ER  - 

    Copy | Download

Author Information
  • Abstract
  • Keywords
  • Document Sections

    1. 1. Introduction
    2. 2. Materials and Methods
    3. 3. Results and Discussion
    4. 4. Conclusions
    Show Full Outline
  • Abbreviations
  • Acknowledgments
  • Conflicts of Interest
  • References
  • Cite This Article
  • Author Information