Research Article | | Peer-Reviewed

Geoinformatics-Based Assessment of Salt Mining and Its Socio-economic Impact on Uburu Community, Ebonyi State, Nigeria

Received: 20 December 2024     Accepted: 2 January 2025     Published: 17 February 2025
Views:       Downloads:
Abstract

The aim of the study is to assess the geo-economic impact of salt mining activities on the people of Uburu community in Ebonyi State, Nigeria. The objective of the study is to identify, map and examine the geographic pattern of the salt mining lake in the area using Geoinformatics method to capture (GPS and Remote Sensing), analyze and map (GIS and cartography) the time series changes in salt lake. Questionnaire was used to solicit for information on salt mining method, health, tools/materials and financial challenges in salt business in Uburu. The study shows the spatial location of the Salt Lake where salt mining activities take place. The study revealed that within a period of twelve years (12) between 2010-2022, there has been changes in the spatial extent of the lake. GIS analysis revealed that in 2010 the salt lake covered an area of 89.8 m2. In 2016 it was revealed to be 89 m2 which shows a spatial decrease in the extent of 0.8 m2. The shrinking of the lake can be attributed to mining activities and the effects of climate change. Conversely, the study showed that in 2022, the extent of the Salt Lake was 114.5 m2 indicating an increase of 25.5 m2. This is, however, attributed to the decline in the salt mining activities in the area. Since the lake has no outlet other than evaporation, the minerals accumulate and give the lake high salinity. The methods adopted by the miners in salt processing were identified to be mainly traditional as about 95% of the respondents indicated having no health challenge since they have been part of the activities. The study further revealed the use of locally made tools and materials such as clay pot, drum, calabash, firewood, bucket, etc. for salt mining and processing. The majority of the respondents (65%) incurred cost of more than N5,000 in the purchase of tools and materials and labor for salt mining business. Likewise, the study revealed factors such as modern technology, cost of materials and good market, if put in place, can improve salt mining business in the area. The t-test revealed that respondent’s monthly income from the salt mining business has no significant determinant relationship with the respondent’s educational qualification and housing type in the study area. Improved modern salt mining system is recommended.

Published in Earth Sciences (Volume 14, Issue 1)
DOI 10.11648/j.earth.20251401.12
Page(s) 17-32
Creative Commons

This is an Open Access article, distributed under the terms of the Creative Commons Attribution 4.0 International License (http://creativecommons.org/licenses/by/4.0/), which permits unrestricted use, distribution and reproduction in any medium or format, provided the original work is properly cited.

Copyright

Copyright © The Author(s), 2025. Published by Science Publishing Group

Keywords

Salt Mining, Geoinformatics, GIS, Uburu, Satellite Image, Mineral

1. Introduction
The term “salt” has different meanings and definitions to different people as its importance and production has become a source of income for many . Chemically, salt is a generic term given to anyone of a class of similar compounds formed when all or part of hydrogen irons of an acid are replaced with a metal or a metallic radical. According to Kostick , “Salt” also is the specific name given to Sodium Chloride. Salt also known as Sodium Chloride, the most common evaporate, is an ionic chemical compound with a chemical formula NaClO3 . Salt can also be regarded as a natural mineral composed of two elements: Sodium and Chlorine, usually in white cube-shaped crystals. It naturally occurs in many parts of the world and has been mined for centuries . In nature, salt appears either as rock salt, or integrated with surrounding sediments, as well as melted in water (sea, salty lakes and springs). Salt or Sodium Chloride is widely recognized as a crucial commodity for ancient communities, just as it is for modern ones though in the modern world, a very small proportion of the salt produced is used in the preparation and consumption of food, it is that use which we tend to think of when we speak of salt as an environmental resource . Salt is an inexpensive bulk mineral also known as halite which can be found in concave rocks of coastal areas or in lagoons where sea water gets trapped and deposits salt as it evaporates in the sun .
Globally, salt is a universal mineral commodity used by virtually every person in the world . Even though it is a very common mineral today, at one time, it was considered as precious as gold in certain cultures . During the early stage of human development, salt was a necessity of life and communities blessed with natural salty springs jealously preserved them as gifts from God. Other communities could have access to these salty springs only on the acceptance of those that owned them . Thus, salt is one of the major natural resources that has continued to find relevance in all aspects of human endeavors. Originally, salt was produced for human consumption purposes and later other significant applications were discovered. This has made salt one of the most important commodities for centuries, comparable to the importance of oil in present times . The use of salt as a food preservative together with its economic importance began to decline after the industrial revolution. Instead, it began to be extensively used in the chemical industry and other application areas . Overall, there are more than 14,000 reported usages of halite. This salt type along with other salts, have played a very important role in human life ; hence, their identification and mapping as environmental resources has been made possible with the introduction and adoption of Geoinformatics technologies. Consequently, the positive roles of Geoinformatics technologies such as Aerospace Remote Sensing, Geographic Information System (GIS), Global Positioning System (GPS), Digital Cartography, collaborative web-mapping (CWM) and Volunteered Geographic Information (VGI) in resource identification and mapping has been well established in literature .
Historically, the importance of salt in regional trade, dowry payment, seasoning, trade currency, wedding rituals, gift to nursing mothers, appeasement of a discontented party, royal privileges among others cannot be over emphasized . Diagne maintains that salt was an essential item in regional trade on the Guinea and Equatorial coasts in the 16th Century under Portuguese hegemony. This corroborate the findings of Bouwer et al. . It was also a vital item in the early regional trade in central Tanzania and throughout Ethiopia in East Africa. The Kongo kingdom and other neighboring kingdoms in central Africa traded in salt as part of regional trade. The significance attached to salt trade was because, among other things, it was a requirement of life and expressly to people who lived mainly on vegetable Foods. Salt as a mineral resource is a necessity of life and so, communities blessed with natural salty springs jealously preserved them as gifts from God. Other communities could have access to these salty springs only on the acceptance of those that owned them .
Kostick further remarked that geologically, salt is found almost in every country of the world. The ocean is the largest resource for salt containing about 46 quadrillion short tons. Continental deposits consist of beds of salts left from the evaporation of ancient seas that retreated, salt domes that intruded upward through old sediments and dry lakes. Today, there are three methods used to produce dry salt based on the method of recovery . Figure 1 shows a typical approach.
a. Underground mining
Also known as rock salt mining, this process involves conventional mining of the underground deposits through drilling and blasting whereby solid rock salt is removed. Mining is carried out at depths between 100m to more than 1500m below the surface.
b. Solar evaporation method
This method involves extraction of salt from oceans and saline water bodies by evaporation of water in solar ponds leaving salt crystals which are then harvested using mechanical means. Solar and wind energy is used in the evaporation process. The method is used in regions where the evaporation rate exceeds the precipitation rate.
c. Solution mining
Evaporated or refined salt is produced through solution mining of underground deposits. The saline brine is pumped to the surface where water is evaporated using mechanical means such as steam-powered multiple effect or electric powered vapour compression evaporators . In the process, thick slurry of brine and salt crystals is formed. During the stone age, the ways in which salt was produced in ancient times vary from area to area, and could use briquetage, deep mining (as at Hallstatt), or the technique specific to Transylvania, based on wooden troughs, perforated in the base. How these troughs functioned is still uncertain. In the Iron Age a different technique was employed, involving deep shafts dug down to the rock salt surface. As well as technological considerations, it is crucial to understand the social and economic importance of salt in the ancient world . The application of technology in the identification and mapping of resource deposits is inevitable .
Similar to Geographic Information System (GIS) , Geoinformatics is the science and the technology which develops and uses information science infrastructure to address the problems of geography, cartography, geosciences and related branches of science and engineering . Geoinformatics has been described as "the science and technology dealing with the structure and character of spatial information, its capture, its classification and qualification, its storage, processing, portrayal and dissemination, including the infrastructure necessary to secure optimal use of this information" or "the art, science or technology dealing with the acquisition, storage, processing production, presentation and dissemination of geoinformation" . In essence, Geoinformatics is a scientific field primarily within the domains of Computer Science and technical geography that has become very relevant in environmental resources identification, modeling and visualization . It usefulness for handling salt mining spatial distribution and its attendant activities within a geographic space knows no bound; hence, its adoption in this study.
Source: Westphal, et al.,

Download: Download full-size image

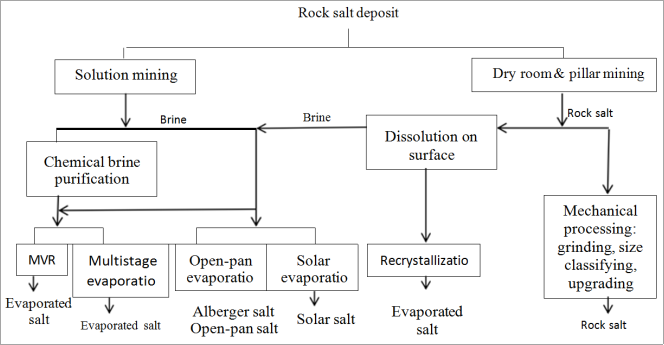
Figure 1. Processes for the Production of Crystallized Salt Based on Rockalt Deposits.
2. Material and Methods
2.1. Study Area
Uburu community in Ohaozara Local Government Area of Ebonyi State, South-Eastern Nigeria (Figure 2) is one of the communities in the states rich in mineral resources. It lies approximately between latitude 6° 00’ N and 6° 05’N, and longitude 7° 40’E and 7° 45’E. The town is located in Ohaozara local government area of the state .
According to the NPC 2016 estimation from the 2006 general population census in the country, it has the population of 2,880,700 . The drainage system of Uburu community is dendritic in pattern. The rivers showed a parallel drainage pattern at their upper course and a dendritic pattern in their lower course (northwest through to the southeast). The drainage is controlled by the Cross River and its tributaries . All the river systems on the eastern part of the divide flow southeast while those on the western part of the divide flows southwest. Groundwater of good quality is obtained from some of the UNICEF owned shallow boreholes . The topography of Uburu can be described as comprising irregular ridges and gentle sloping hills . The highlands range from 45 to 65 m above mean sea level, and the lowlands have an average elevation of 30 m. These topographical features are controlled by the bedrock geology . As argued by Ekpe, et al., and corroborated by Ogbodo , Uluru community is underlain at depth by the Precambrian Basement Complex and by Cretaceous sedimentary rocks and spans through Southern Benue Trough and Anambra Basin. Twith gravely subsoil, characterized the upland location which is adjacent the lowland areas in the area . The comfort of residents of anyplace is enhanced to a very large extent by its climate. Uburu is characterized by a tropical savanna climate. The summers are much rainier than the winters in the area . This climate is considered to be Aw according to the Koppen- Geiger climate classification . The area lies within the Rainforest Belt of eastern Nigeria. Annual precipitation averages about 1800 mm, and over 90% of the rains fall between April and October with the wettest months being August and September . Temperature range of the area is between 27°C to 30°C and its relative density is 508.0/km2. The temperature is highest from February to April and it is about 31°C . Geographically, the study area is located in the savannah zone and so the vegetation is dominantly of semi-savannah grassland with forests and swamps . Economically, features of the dwellers of Uburu community are based around agriculture, mainly of yams, rice, oil palm, and cassava crops. A key minor industry is mining due to the availability of the Salt Lake, the community is made up of Igbo speaking dialect . Likewise, the role of hydro-chemistry and tectonic activities largely affect salt distribution and availability in a given geographic space . While different techniques abound for salt mining globally , a number of factors are responsible for the prevailing method use in a given location which is considered peculiar to the indigenous people like Uburu in Ebonyi State, Nigeria.
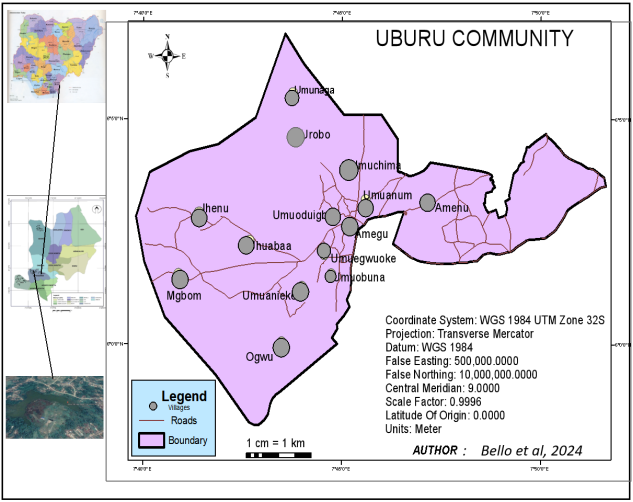
Figure 2. Uburu Community, Ebonyi State, Nigeria.
2.2. Research Methodology
The underlying character of the study calls for the adoption of survey research design and measurement research design in the study area. The adoption of survey research design is for the fact that its involves drawing up a set of questions on various subjects or on various aspects of a subject to which selected members of a population are required to react. These questions were prepared in the form of questionnaires. On the other hand, measurement research design was adopted because it supports collection of data on geographical features through measuring instruments using GPS to identify and geo-tag the salt lake and then using satellite images of different time period that are remotely sensed to map the salt lake using the Geoinformatics-based approach to capture, store, retrieve, manipulate, analyse and visualize image maps of the time series results of the various spatial extent of the salt lake. Thus, the survey research design and measurement research design were appropriate for this study because they enabled the researcher to obtain opinions, attitudes and orientations dominant among a large population which is the sampled population of Uburu Community.
2.2.1. Data for the Study
The type of data used in this study (Table 1) includes:
i the number one objective of the study is to identify and map the spatial location of the salt mining lakes in Uburu community:
a) Data need for the name, location (xy) of the salt mining sites.
b) Existing map of the study area.
ii to examine the health impact of the methods adopted by the miners in salt processing. Data required were respondent response on the methods of salt mining and processing;
a) the tools/instruments used for mining
b) Health status of the respondents.
iii to assess the socio-economic characteristics of salt miners in Uburu community Basic data required includes;
a) Level of income,
b) Housing type,
c) Level of education,
d) Occupation,
e) Age, marital status.
The study area consists of fourteen (14) wards, these are Amaenu, Amegu, Ihennu, Mgbom, Obiozara, Ogwu, Ubuaba, Umuagwu- Oke, Umuaneketa, Umuanum, Umuchima, Umuabuma, Umuodu-Igbo, and Urobo. It has a population of 20,041 in accordance with the 2006 Census and as projected for 2022 . For the purpose of this study, random sampling technique was adopted as it gives every member of the population from which the sample is selected an equal chance of being selected. Using Taro Yamane’s formula;
n=N1+Ne2(1)
Therefore, n=200411+200410.052=392
2.2.2. Materials for the Study
Table 1 shows the data used for the study.
Table 1. Materials for the study.

S/N

NAME

(HARDWARE/SOFTWARE)

PRODUCT

PURPOSE

1

Global Positioning System (GPS)

Hardware

Collect parcel coordinates

2

Laptop Computer (Windows 10)

Hardware/Software

HP 650 Notebook PC

Data input, storage, processing and analysis

4

ArcGIS (Version 10.5)

Software

ESRI

Mapping and analysis

5

Scanner

Hardware

HP

Scan hardcopy layout plan of the study area

6

M.S. Visio

Software

Design flow chat

7

SPSS (Version 20)

Software

IBM

Data analysis

In order to achieve the objectives of this study, results were presented in maps, chats, simple percentages and frequency. Also, regression analysis was used to show relationship between socio-economy and salt mining of the respondent in the area using SPSS version 20.
3. Results and Discussions
3.1. The Spatial Pattern of Salt Mining and Processing Sites in Uburu Community
Figures 3, 4 and 5 shows the image maps of the spatial dynamics (time series) of the spatial extent of Salt Lake in Uburu Community from 2010 to 2022 accordingly. In specific terms, Figure 3 shows the extent of the Salt Lake as of the year 2010 which revealed that in 2010, the lake covers an area of 80.9 m2.
Figure 4 shows the spatial extent of the Salt Lake between 2010 and 2016 for the interval of seven (6) years. Its revealed that in 2016 the lake covers 89 m2 which shows a spatial decrease in the extent of 0.8 m2. The shrinking of the lake can be attributed to mining activities and due to climate change effects. Figure 5 shows the spatial extent of the Salt Lake between 2016 and 2022, an interval of six (6) years. Its revealed that in 2022 the extent of the Salt Lake was 114.5 m2, an increase of 25.5 m2. This can be attributed to the decline in the mining activities in the area. Since the lake has no outlet beside evaporation, the minerals accumulate and give the lake high salinity (far saltier than the seawater) and density. Figure 6 shows the lat/long location and traditional materials used for Salt Processing.
Source: Authors’ GIS Analysis, 2024

Download: Download full-size image

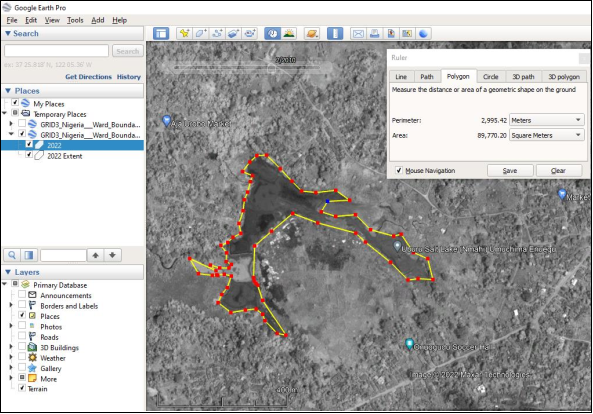
Figure 3. 2010 Salt Lake Extent (89.8 m2).
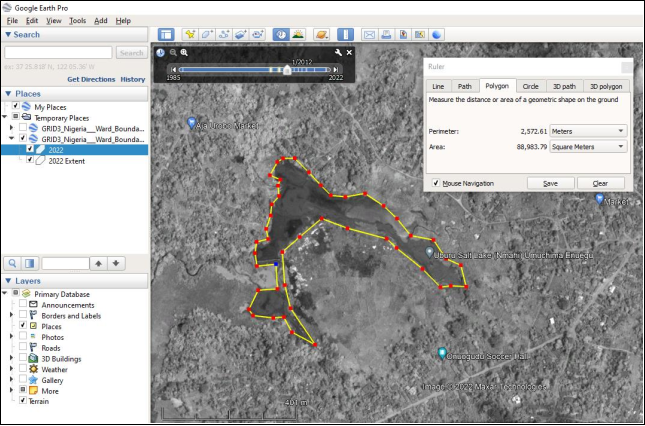
Figure 4. 2016 Salt Lake Extent (89 m2).
Source: Author GIS Analysis, 2024

Download: Download full-size image

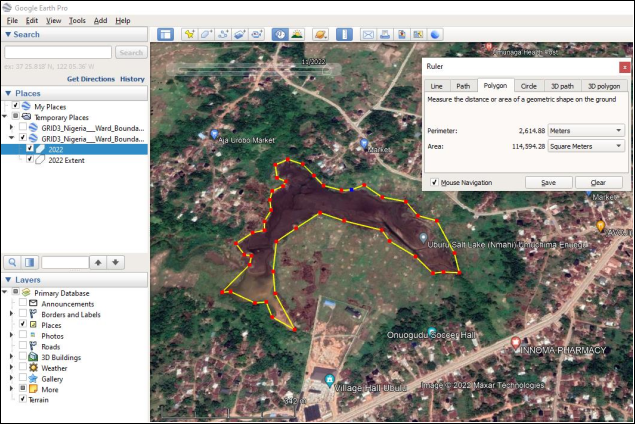
Figure 5. 2022 Salt Lake Extent (114.59 m2).
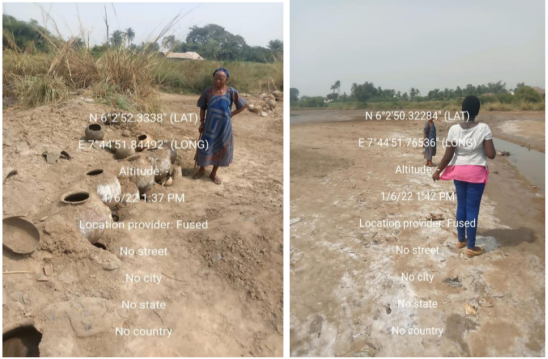
Figure 6. Location (latitude/longitude) of Materials used for Salt Processing in Uburu Community.
3.2. Analysis of the Socio-economic Characteristics of the Respondents in Uburu Salt Mining Community
This section presents and discusses the socio-economic charismatics of the salt mining studied group in Uburu community in Ebonyi State, Nigeria. The emphasis here as presented in Table 1 is age groups, gender, marital status, occupation, educational levels, monthly income, and housing type as well as the nature of household.
Table 2. Socioeconomic Characteristics of Studied Group.

Variable

Frequency

Percentage%

15-25

11

3.1

26-35

38

10.7

36-45

121

34.7

46-55

92

26.2

56 Above

89

25.3

Total

351

100

Gender

Male

53

15.1

Female

298

84.9

Total

351

100

Marital Status

Married

141

40.1

Single

13

3.8

Widow

126

35.9

Widower

31

8.8

Divorced

40

11.4

Total

351

100

Occupation

Civil servant

32

9.1

Farming

133

37.9

Artisan/Labourer

44

12.5

Trading

121

34.5

Others

21

6.0

Total

351

100

Educational Qualification

Primary

99

28.2

SSCE

76

21.6

Tertiary

21

6.0

Others

155

44.2

Total

351

100

Monthly Income (N)

N5,000

45

12.8

N5,000- 10,000

119

33.9

N10,000-20,000

144

41.0

N20,000 Above

43

12.3

Total

351

100

Housing Types

Standalone rooms

157

44.7

Self-contain

77

21.9

Two-bedrooms and above

117

33.4

Total

351

100

Nature of Household

Nuclear family

204

58.1

Extended family

147

41.9

Total

351

100

Source: Field survey, 2024
About 121 (34.7%) of respondents were within 36 and 45 years and constitutes the majority of respondent group. 92 (26.2%) of the respondents were between 46 and 55 years, 89 (25.3%) of the respondents were among those within the ages of 56 and above, 38 (10.7%) respondents were between the ages of 26 and 35 years, while 11 (3.1%) of the respondents fall between 15 and 25 years. Based on gender, 298 (84.9%) of the respondents were female, while 53 (15.1%) were male. This indicates that the majority of people who involve in salt mining business in Uburu are mostly female. On the distribution of respondent’s base on marital status, 141 (40.1%) making the majority are married, 126 (35.9%) are widow, 40 (11.4%) are divorce, and about 31 (8.8%) are widower, while 13 (3.8%) are singles. Result of the distribution of respondents based on occupation reveals that none of the respondents were idle, this implies that all of the respondents had something doing to earn a living. 133 (37.9%) were farmers and also form the majority, 121 (34.5%) were traders, 44 (12.5%) were artisan/Laborers, 32 (9.1%) were civil servants, while 21 (6.0%) falls to other categories of occupation. With respect to the educational level attained by the respondents, 155 (44.2%) of the respondents fall under others, 99 (28.2%) had only primary education, 76 (21.6%) had SSCE education, while 21 (6.0%) of the respondents had only Islamic education.
With respect to the distribution of respondents based on income level; the study reveals that the majority of the respondents 144 (41.0%) earn between N10,000 and N20,000 per month, 119 (33.9%) earn between N5,000 and N10,000 per month, 45 (12.8%) earn N5,000 and possibly less per month, while 43 (12.3%) of the respondents earn N20,000 and above per month. With respect to the housing type, the majority 157 (44.7%) housing type are standalone rooms, 117 (33.4%) are two-bedroom and above, while 77 (21.9%) are self-contain. On the distribution of respondent’s nature of household, majority of the respondents 204 (58.1%) are nuclear family, while 147 (41.9%) are extended family. From the findings above, it is obvious to state that the majority of the respondents were females owing to the fact that they are the one majorly involved in salt mining business. Also, the level of income of the household is considered low in view of the level of work input which is considered not commensurate. This could be attributed to the fact that majority of the respondents were not educated who also engages in farming activities to feed their families and raise some fund to purchase other items they don’t produce.
3.3. Health Implication of Salt Mining and Processing in Uburu
Issues discussed under this section includes the respondent’s duration of stay in the study area, respondent’s involvement in salt mining activities, reasons for involving in salt mining business, methods used for salt mining/processing, tools/instruments used for salt mining, and heath challenges experienced from salt mining activities. This approach corroborates the findings of Gordon et al., in Kenya. On the issue of respondent’s duration of stay in Uburu community, the study reveals that 80% of the respondents, making the majority, have spent 40 years and above, 12% have spent 21 to 30 years, 4% of respondent have also spent between 11 and 20 years, while 4% of the respondents have spent less than 10 years living in the area. The implications of this findings is that the studied group have lived in the study area long enough to have requisite knowledge on salt mining in Uburu Community, hence their responses are reliable to make informed judgement. The study further shows that 81.8% of the respondents indicate been part of the salt mining business in the area, while 18.2% indicate not partaking in the salt mining business. This means that most of the respondents are people who partake in the salt mining activities and will have a good knowledge of the salt mining business.
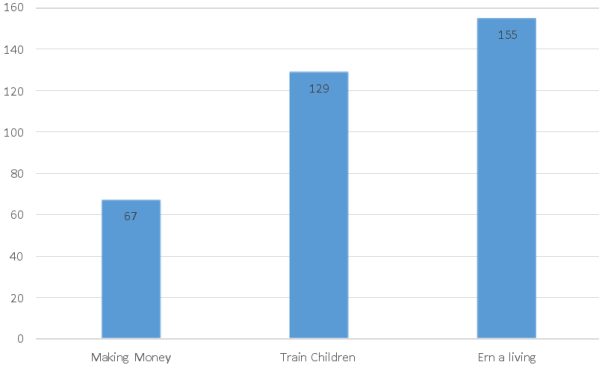
Figure 7. Reasons for Involving Salt Mining.
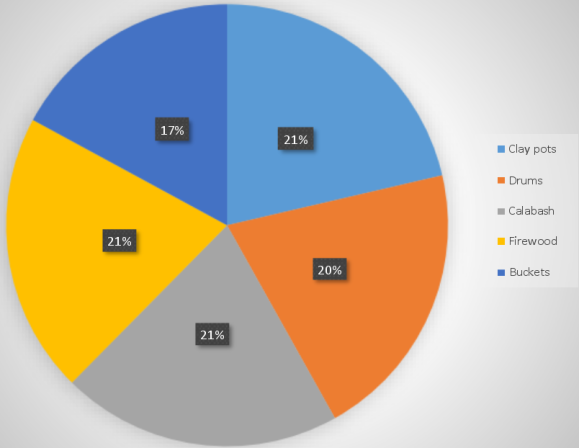
Figure 8. Tools for Salt Mining.
Figure 7 shows the various reasons for involving in the salt mining and processing business as 155 (44.2%) agreed to involving in salt mining business to earn a living, 129 (36.6%) indicate involving in salt mining business in order to train their children in school, while 67 (19.2%) indicate they involve in the salt mining business to make money as well. On the method adopted in salt mining and processing, 97% of the respondents indicate using traditional methods (cultural), while 3% indicate using scientific method. Figure 8 presents information on the tools/instruments used for salt mining to include Clay pots (21%), drums (20%), calabash (21%), fire wood (21%), and bucket (17%). The study further revealed that 95% of the respondents indicate having no health challenge since they have been part of the activities, 3% says that have health challenges while only 2% of the respondents indicate otherwise because they are not really sure if the ailment they had can be associated with salt mining activities in Uburu Community.
3.4. Socio-economic Impacts of Salt Mining Business in Uburu Community
Issues discussed under this section includes cost for purchase of tools/instruments and labor, challenges in the salt mining and processing business, rate of salt mining activities currently with the precious year, factors responsible for decline in salt mining activities, and ways to improve on the salt mining activities. these variables are enumerated for discussion in the to understand the impact of the salt mining business on the respondents.
On the cost for the purchase of tools/instruments and labor needed for salt mining and processing business, result contained in Figure 9 shows that 65% of the respondents, which makes the majority, spend from five thousand Naira and above (> N5000), followed by 24% of the respondents that spends from three-four thousand Naira (N3000 - N4000), 6% spends from two-three thousand Naira (N2000 - N3000), 4% of the respondents indicate they use one-two thousand Naira (N1000 - N2000), while 1% of the respondents spend less than one thousand Naira (< N1000). Figure 10 presents the challenges in salt mining and processing business faced by the respondents. The study reveals that 201 (57.3%) of the respondents, which is the majority, are faced with the challenge of too much labor, 141 (40.2%) respondents indicate financial challenge, 4 (1.1%) of the respondents said health challenge, while 5 (1.4%) of the respondents indicate others. Figure 11 revealed information on the current rate of salt mining activities when compared with the previous year.
The study shows that about 87% of the respondents, making the majority, indicate massive decrease in the salt mining business, 12% show moderate, while 1% of the respondent observed massive increase respectively. From the analysis, it is abundantly clear to note that there is massive decrease in the salt mining business over the years which could be attributed to the none profitability of the business when compared with the labour and capital required to invest in the mining and processing. With respect to factors responsible for the decline in salt mining activities, the study reveals that 27% of the respondents attributed it to too much labor, about 28% claimed high cost of local materials, 24% indicate it’s because of low income, while 21% claimed lack of modern materials.
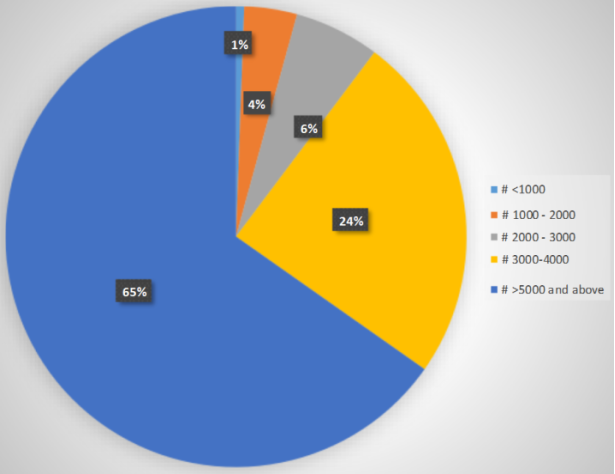
Figure 9. Cost of Labor and Tools.
The findings shows that the factors mentioned contribute so much to the decline in the salt mining business in Uburu. Table 3 presents information on the ways to improve on the salt mining business in the area. From the analysis, 152 (43.3%) which is a good number of the respondents indicate All of the above. 70 (19.9%) of the respondents choose good market for salt, 67 (19.1%) suggested the use of modern technology, while 62 (17.7%) respondents indicate low cost of materials. This implies that all of the variables are so important in trying to improve on salt mining business.
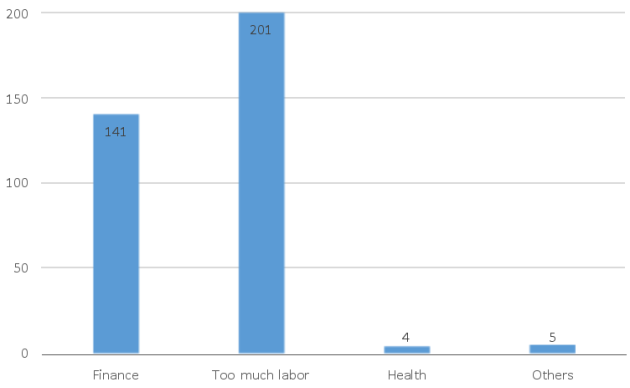
Figure 10. Challenges in the Salt Mining.
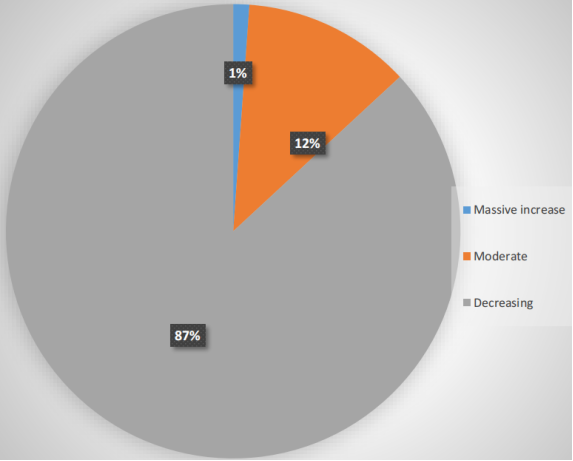
Figure 11. Rate of Salt Mining Activities compared with the Precious Years.
Table 3. Ways to Improve on the Salt Mining Activities in Uburu Community.

Variable

Frequency

Percentage (%)

Use of modern technology

67

19.1

Low cost of materials

62

17.7

Good market for salt

70

19.9

All of the above

152

43.3

Total

351

100

Source: Field survey, 2024
3.5. Relationship Between the Mining Monthly Income and Their Educational Qualification and Housing Type
Specific results of salt mining and its socio-economic effects in Uburu community are examined below.
3.5.1. Model Validity Check
In an attempt to ensure that results of this study is robust and valid for interpretation, several diagnostic tests such as Durbin Watson test, variance inflation factor (VIF), tolerance statistics were performed as presented in tables 4, 5, and 6 respectively.
3.5.2. Test for Autocorrelation
The Durbin Watson statistics is used to test for the presence of autocorrelation among the variables in this study. The Durbin Watson statistics for the model is estimated at 0.060. This figure is less than 2 (see table 5). This indicates that the assumption of independent error is not tenable for this study since Durbin Watson statistics is below 2. This result further confirms that the model used in this study is not suffering from incidence of autocorrelation and, as such, there is no possibility of spurious regression .
3.5.3. Test for Multicollinearity
Variance inflation factor (VIF) statistics, tolerance statistics and correlation matrix are used to test for the presence of Multicollinearity among the variables in the model. In respect to Multicollinearity test using VIF, table 6 present results of the variance inflation factor (VIF). Although, there is no formal VIF value for determining the presence of Multicollinearity, values of VIF that exceeds 10 are often regarded as indicating Multicollinearity, but in weaker models, values above 2.5 maybe a cause for concern .
Table 4. Correlations.

Monthly Income

Educational qualification

Housing Type

Pearson Correlation

Sig. (1-tailed)

N

Monthly Income

1.000

.864

.848

Educational qualification

.864

1.000

.904

Housing Type

.848

.904

1.000

Monthly Income

.

.000

.000

Educational qualification

.000

.

.000

Housing Type

.000

.000

.

Monthly Income

351

351

351

Educational qualification

351

351

351

Housing Type

351

351

351

Source: Researchers Computation Using SPSS, Version 20
Table 5. Model Summaryb.

Model

R

R Square

Adjusted R Square

Std. Error of the Estimate

Change Statistics

Durbin-Watson

R Square Change

F Change

df1

df2

Sig. F Change

1

.878a

.771

.770

.416

.771

585.848

2

348

.000

.060

a. Predictors: (Constant), Housing Type, Educational qualification
b. Dependent Variable: Monthly Income
Source: Researchers Computation Using SPSS, Version 20
3.5.4. Test of Hypotheses (T-Test Statistics)
T-test is used to test the significance of the relationship between variables. It is done at 5% level of significance with n-l degree of freedom. This was done in line with the decision rule. This test is used to test the following hypotheses:
(i). Test of Hypotheses One
H01: Educational qualification has a significant relationship with monthly income of the respondents in the study area. In testing the first hypothesis, the results in table 6 revealed that educational qualification had a t-calculated value of 8.919 and a correspondent significant probability statistic of 0.000 which falls above the 5% level of significance. This leads to the rejection of the null hypothesis and accepting the alternative hypothesis. The study therefore concludes that there is no significant relationship between respondent’s monthly income and their educational qualification.
(ii). Test of Hypothesis Two
H02: Housing type has no significant relationship with respondent’s monthly income in the study area. Again, in testing the second hypothesis, the results in table 6 revealed that housing type had at- calculated value of 6.089 and a correspondent significant probability statistic of 0.000 which also fall above the 5% level of significance. This leads to the rejection of the null hypothesis. The study therefore concludes that respondent’s monthly income has no significant with the respondent’s housing type in the area. From the results shown in table 5, all the tested variables have no significant correlation as regards respondent’s monthly income in the study area.
Bearing in mind the above criteria, the variance inflation factor (VIF) statistics for all the independent variables of this study consistently fall below 6. This indicates the absence of multicollinearity among the variables. This implies that the model exhibit low risk of potential multicollinearity problems as all the independent variables have a variance of inflation factor (VIF) below 5.5. Also, the tolerance values continuously lie within 0.183 (see tables 5, 6). Again, this is more than 0.1; this further substantiates the absence of multicollinearity problems among the independent variables. It is being suggested that tolerance values less than 0.1 almost or certainly indicates a serious collinearity problem. Finally, tables 5, 6 of the correlation matrix as presented shows the absence of multicollinearity among the explanatory variables. High correlation causes problems about the relative contribution of each predictor variable to the success of the model . From tables 5, 6, all correlation values with respect to the study variables are less than 0.78. Correlation values above 0.78 are considered harmful for the purpose of analysis .
Table 6. Coefficientsa.

Model

Unstandardized Coefficients

Standardized Coefficients

t

Sig.

Correlations

Collinearity Statistics

B

Std. Error

Beta

Zero- order

Partial

Part

Tolerance

VIF

(Constant)

1 Educational qualification

Housing Type

.892

.053

16.769

.000

.358

.040

.534

8.919

.000

.864

.431

.229

.183

5.455

.361

.059

.365

6.089

.000

.848

.310

.156

.183

5.455

a. Dependent Variable: Monthly Income
Source: Researchers Computation Using SPSS, Version 20
Table 6 presents the model coefficients for all variables used in the study. The regression line as shown in the result reveals an intercept of .053. This simply implies that when all the other variables are not considered, Tobin Q ratio (relationship) of listed variable considered in the study is significantly estimated 5.3% occasioned by factors not incorporated in this study.
However, the result of the estimated model shows that monthly income determines educational qualification and the housing type of the respondents in the study area as beta coefficients of .365 and .534 respectively. This implies that a unit change in respondent’s monthly income will lead to a significant change in their educational qualification and housing type at .365 and .534 respectively thus indicating a significant positive impact. This is similar to the findings of Vagholikar and Moghe .
4. Conclusion and Recommendation
The aim of this study was to assess the socio-economic impact of salt mining activities on the people of Uburu community in Ebonyi State, Nigeria. The objective of the study was to identify, map and examine the spatial extent of the salt mining lake over the year (2010 to 2022) in the area using Geoinformatics method to capture (GPS and Remote Sensing), analyze and map (GIS) the time series (spatial changes) in the salt lake. The study reveals that the traditional method of salt mining in the area posed no traceable health challenges to the miners as perceptually examined. The study also found that socio-economic activities of the people of Uburu community has not been encouraging. The study further found that there exist a negative linear relationship between the salt mining business and the socio-economic characteristics of the people in the area. From the study, factors such as the method adopted for salt mining, amount incurred for the purchase of tool/ materials and poor market value of the product are responsible for the perceived draw-back in salt business in the rural Africa Community of Uburu in Ebonyi State, Nigeria. The study revealed that salt production is still a major economic activity in the Uburu Community despite the low patronage and limited production rates which should be given proper attention. Thus, the improved salt production could be considered as an alternative for enhancing the livelihood status and sustainable development in the area.
In view of the above findings, there is a need for improvement in the method of salt mining and processing, cost of tools/materials and a good market value for the salt product in the area; hence the following specific recommendations:
i. Local and international stakeholders, including NGOs, should be encouraged to provide improved mining materials to salt producers.
ii. The study calls for modern technological interventions for salt mining and processing; as the salt raw materials have the capabilities of meeting the salt needs of Uburu community and the State at large.
iii. The study also calls on relevant authorities to ensure a good market is available for the salt products in the area with a view to improving their socio-economic well-being and quality of life.
Abbreviations

GIS

Geographic Information System

SPSS

Special Package on Social Science

NGOs

Non-Governmental Organizations

VIF

Variance of Inflation Factor

GPS

Global Positioning System

M.S

MicroSoft

HP

Hewlet Packad

ESRI

Environmental System Research Institute

IBM

International Business Management

NPC

National Population Commission

C4G

Center for Geoinformatics

VGI

Volunteered Geographic Information

CWM

Collaborative Web Map

Conflicts of Interest
The authors declare no conflicts of interest.
References
[1] Abu-Khader, M. M. Viable Engineering Options to Enhance the NaCl Quality from the Dead Sea in Jordan. Journal of Cleaner Production. 2006, 14(1), 80-86,
[2] Adeboye, J. O. Effects of Varying Levels of Salt (Sodium Chloride) on the Performance Characteristics of Snails (Archachatina Marginata). Nutrition and Food Science. 2008, 38(6), 555-558,
[3] Anthony, H. Salt Exploitation in the Later Prehistory of the Carpathian Basin. Documenta Praehistorica. 2015, 42(3), 211,
[4] Antonites, A. Archaeological Salt Production at the Baleni Spring, Northeastern South Africa. The South African Archaeological Bulletin. 2013, 68(198), 105- 118,
[5] Bello, I. E. Critical Issues in the Methods of Data Collection in Geoinformatics and Environmental Sciences. International Journal of Social Sciences and Management Research. 2023. 9(8), 18–28.
[6] Bello, I. E. & Ojigi, L. Collaborative Web Mapping and Volunteered Geographic Information: A Study in Nigeria. Applied GIS. 2013, 9(2), 1-17,
[7] Boniface, C. E. & Kalu O. U. Hydrogeochemistry, Contaminant Transport and Tectonic Effects in the Okposi-Uburu Salt Lake Area of Imo State, Nigeria. Hydrological Sciences Journal. 1986, 31(2), 205-221,
[8] Boubacar, S. B., Hajime, K., Makoto, N., Akira, I., Ichizen, M., Mohamed, E. & Tolno, E. Socio-Economic Analysis of Small-Scale Salt Production Techniques in the Coastal Area of Guinea: As an Alternative for Improving Livelihood Status and Sustainable Mangrove Forest Management. International Journal of Research in Engineering, IT and Social Sciences. 2013, 3(9).
[9] Bouwer, H. Groundwater Hydrology. Open Journal of Hydrology. 1978, 2(4), 112,
[10] C4G. 2022. Louisiana State University (LSU) Center for Geoinformatics, Definition of Geoinformatics.
[11] Charles, B. A. A. & Osuala, U. S. The Socio-Economic Effects of Colonial Tin Mining on the Jos Plateau. 2007, 1904-1960.
[12] Ekpe, I. I., Okpone E. G., Ogbodo E. N. & Nwite, J. N. Physico-chemical Properties of Four Ultisor under Different Vegetation Cover in South-Eastern Nigeria. Journal of Science of Agriculture, Food Technology and Environment. 2005, (5), 74-78.
[13] Freeze, R. A. & Cherry, J. A. Groundwater. Prentice-Hall, Englewoods Cliffs, New Jersey, USA. American Journal of Water Resources, 1979, 7(4), 146-154,
[14] Gary, M. & Susana, M. The Contribution of the Mining Sector to Socioeconomic Public Disclosure Authorized and Human Development. Extractive Industries for Development, 2014.
[15] Gordon, O. O., Martin, M. B., Gilbert, W. A., Ongere, P., Henry, K. M., Paul, M., Stella, M., Hausner, K. W., & Peter, K. K.. Environmental Issues and Socio-economic Problems Emanating from Salt Mining in Kenya; A Case Study of Magarini District. International Journal of Humanities and Social Science. 2013, 3(3), 213,
[16] Harding, A. & Kavruk, V. Explorations in Salt Archaeology in the Carpathian Zone, Budapest. Archaeolingua. 2013, 89 (343): 237-239,
[17] Hillary, K. Characterization of Raw Materials for Salt Extraction from Lake Katwe, Uganda. 2013.
[18] Ishiagu, Sustainable Agricultural Development in A Changing Environment: Proceedings of the 32nd Annual Conference of the Agricultural Society of Nigeria, held at Federal College of Agriculture, Ebonyi State, 13- 16 September 1998.
[19] Diagne, P. “African Political, Economic and Social Structures during this Period.” In General History of Africa V: Africa from the Sixteenth to the Eighteenth Century, edited by B. A. Ogot, 1992. 23-45. California: Heinemann.
[20] Ivana, P. The Exploitation of Salt in the Eneolithic (Eksploatacija Soli U Eneolitiku). 2018, 325-335,
[21] Kah, H. Ritual Use of Currency in Laimbwe History, Cameroon. Journal of Contemporary Research. 2016, 14(3).
[22] Kah, H. K. (2017). Salt, History and Culture in the Western Grasslands of Cameroon. Ogirisi: A New Journal of African Studies. 2017, 6(5), 224-229,
[23] Kilic, Ö. & Kilic, A. M. Recovery of Salt Co-Products during Salt Production from Brine. Desalination. 2005, 186(3), 11-19,
[24] Korovessis, N. A. & Lekkas, T. D. Salt Works’ Wetland Function. Global NEST Journal. 2009, 11(1), 49-57.
[25] Kostick, D. S. The Material Flow of Salt. Information Circular, United States, Bureau of Mines. Journal of Archaeological Science. 2002, 35(6), 1453-1462.
[26] Durbin, J. & Watson, G. S. Testing for Serial Correlation in Least Squares Regression, II. Biometrika. 1951, 38(1–2), 159–179.
[27] Gujarati, D. & Sangeetha, N. Basic Econometric. 4th Edn. New Delhi. Tata Mcgraw-Hill Publishing Company Ltd. 2007.
[28] NPC. National Bureau of Statistics. 2006. Retrieved 21 December 2021 from
[29] Obialo, S., Onwuka, E. P., & Chimankpam, K., E. Hydrogeology of Uburu and Environs, Southern Eastern, Nigeria. Communication in Physical Sciences. 2018, 3(1), 67- 75.
[30] Offodile, M. E. Hydrogeochemical interpretation of the middle Benue and Abakaliki brine fields. J. in. Geol. 1976, 13(2), 79,
[31] Ogbodo, E. N. (2013). Assessment and management strategies for the receding watersheds of Ebonyi State, Southeast Nigeria. Journal of Environment and Earth Science. 2013, 3(3).
[32] Onwe-Moses, F. D., Ozumba, M. B. & Chijiuka, O. Geology and Mineral Resources of Ebonyi State, Southeastern Nigeria. African Journal of Engineering and Environment Research, 2020, 122-155.
[33] Onyeneke, R. U. Empirical Trend Analysis of Climate Variability in Ebonyi State, Nigeria. Nigeria Agricultural Journal, 2020.
[34] Orajaka, S. Salt water resources of east Central State of Nigeria. Journal of Natural Sciences Research. 1972, 3(3).
[35] Prakash, A. Introducing Geoinformatics for Earth System Science Education. Journal of Geoscience Education. 2006, 54(5), 555-560,
[36] Sedivy, V. M. Environmental Balance of Salt Production Speaks In Favour of Solar Salt Works. Global Nest Journal. 2009, 11: 41-48.
[37] Star, J., & Estes, J. Geographic information systems. An Introduction. Englewood Cliffs, New Jersey (USA), 2000.
[38] TERI, Overview of Mining and Mineral Industry in India New Delhi. Environment Development and Sustainability. 2001, 9(3): 283-303,
[39] Tomlinson, R. Thinking about GIS: Geographic Information System Planning for Managers. ESRI Press, New York. 2007.
[40] Vagholikar, N. & Moghe, K. A. Undermining India: Impacts of Mining on Ecologically Sensitive Areas, Kalpavriksh. Association for Tropical Biology and Convertion. 2003, 39(5), 575-577,
[41] Virrantaus, K. & Haggrén, H. Curriculum of Geoinformatics-Integration of Remote Sensing and Geographical Information Technology. International achieves of Photogrammetry and Remote Sensing. 2000, 33(6), 288-294,
[42] Westphal, G., Kristen, G., Wegener, W., Ambatiello, P., Geyer, H., Epron B, Bonal C, Steinhauser G, & Götzfried, F. “Sodium Chloride”. 2010, Wiley-VCH Verlag GmbH & Co. KGaA, Weinheim.
[43] Yamane, T. Statistics: An Introductory Analysis. 1967, 2nd Edition, Harper and Row, New York.
[44] Yankowski, A. Asinan Documenting Bohol’s Traditional Method of Salt Production and the Importance of Salt in the Region’s Early Economy. Philippine Quarterly of Culture and Society. 2007, 35(1/2): 24-47,
Cite This Article
  • APA Style

    Bello, I. E., Uta-Daniel, B. O., Iheanacho, N. M., Oluyomi, H. O. (2025). Geoinformatics-Based Assessment of Salt Mining and Its Socio-economic Impact on Uburu Community, Ebonyi State, Nigeria. Earth Sciences, 14(1), 17-32. https://doi.org/10.11648/j.earth.20251401.12

    Copy | Download

    ACS Style

    Bello, I. E.; Uta-Daniel, B. O.; Iheanacho, N. M.; Oluyomi, H. O. Geoinformatics-Based Assessment of Salt Mining and Its Socio-economic Impact on Uburu Community, Ebonyi State, Nigeria. Earth Sci. 2025, 14(1), 17-32. doi: 10.11648/j.earth.20251401.12

    Copy | Download

    AMA Style

    Bello IE, Uta-Daniel BO, Iheanacho NM, Oluyomi HO. Geoinformatics-Based Assessment of Salt Mining and Its Socio-economic Impact on Uburu Community, Ebonyi State, Nigeria. Earth Sci. 2025;14(1):17-32. doi: 10.11648/j.earth.20251401.12

    Copy | Download

  • @article{10.11648/j.earth.20251401.12,
      author = {Innocent Ehiaguina Bello and Blessing Ogonnaya Uta-Daniel and Nnaemeka Michael Iheanacho and Helen Olubunmi Oluyomi},
      title = {Geoinformatics-Based Assessment of Salt Mining and Its Socio-economic Impact on Uburu Community, Ebonyi State, Nigeria
    },
      journal = {Earth Sciences},
      volume = {14},
      number = {1},
      pages = {17-32},
      doi = {10.11648/j.earth.20251401.12},
      url = {https://doi.org/10.11648/j.earth.20251401.12},
      eprint = {https://article.sciencepublishinggroup.com/pdf/10.11648.j.earth.20251401.12},
      abstract = {The aim of the study is to assess the geo-economic impact of salt mining activities on the people of Uburu community in Ebonyi State, Nigeria. The objective of the study is to identify, map and examine the geographic pattern of the salt mining lake in the area using Geoinformatics method to capture (GPS and Remote Sensing), analyze and map (GIS and cartography) the time series changes in salt lake. Questionnaire was used to solicit for information on salt mining method, health, tools/materials and financial challenges in salt business in Uburu. The study shows the spatial location of the Salt Lake where salt mining activities take place. The study revealed that within a period of twelve years (12) between 2010-2022, there has been changes in the spatial extent of the lake. GIS analysis revealed that in 2010 the salt lake covered an area of 89.8 m2. In 2016 it was revealed to be 89 m2 which shows a spatial decrease in the extent of 0.8 m2. The shrinking of the lake can be attributed to mining activities and the effects of climate change. Conversely, the study showed that in 2022, the extent of the Salt Lake was 114.5 m2 indicating an increase of 25.5 m2. This is, however, attributed to the decline in the salt mining activities in the area. Since the lake has no outlet other than evaporation, the minerals accumulate and give the lake high salinity. The methods adopted by the miners in salt processing were identified to be mainly traditional as about 95% of the respondents indicated having no health challenge since they have been part of the activities. The study further revealed the use of locally made tools and materials such as clay pot, drum, calabash, firewood, bucket, etc. for salt mining and processing. The majority of the respondents (65%) incurred cost of more than N5,000 in the purchase of tools and materials and labor for salt mining business. Likewise, the study revealed factors such as modern technology, cost of materials and good market, if put in place, can improve salt mining business in the area. The t-test revealed that respondent’s monthly income from the salt mining business has no significant determinant relationship with the respondent’s educational qualification and housing type in the study area. Improved modern salt mining system is recommended.
    },
     year = {2025}
    }
    

    Copy | Download

  • TY  - JOUR
    T1  - Geoinformatics-Based Assessment of Salt Mining and Its Socio-economic Impact on Uburu Community, Ebonyi State, Nigeria
    
    AU  - Innocent Ehiaguina Bello
    AU  - Blessing Ogonnaya Uta-Daniel
    AU  - Nnaemeka Michael Iheanacho
    AU  - Helen Olubunmi Oluyomi
    Y1  - 2025/02/17
    PY  - 2025
    N1  - https://doi.org/10.11648/j.earth.20251401.12
    DO  - 10.11648/j.earth.20251401.12
    T2  - Earth Sciences
    JF  - Earth Sciences
    JO  - Earth Sciences
    SP  - 17
    EP  - 32
    PB  - Science Publishing Group
    SN  - 2328-5982
    UR  - https://doi.org/10.11648/j.earth.20251401.12
    AB  - The aim of the study is to assess the geo-economic impact of salt mining activities on the people of Uburu community in Ebonyi State, Nigeria. The objective of the study is to identify, map and examine the geographic pattern of the salt mining lake in the area using Geoinformatics method to capture (GPS and Remote Sensing), analyze and map (GIS and cartography) the time series changes in salt lake. Questionnaire was used to solicit for information on salt mining method, health, tools/materials and financial challenges in salt business in Uburu. The study shows the spatial location of the Salt Lake where salt mining activities take place. The study revealed that within a period of twelve years (12) between 2010-2022, there has been changes in the spatial extent of the lake. GIS analysis revealed that in 2010 the salt lake covered an area of 89.8 m2. In 2016 it was revealed to be 89 m2 which shows a spatial decrease in the extent of 0.8 m2. The shrinking of the lake can be attributed to mining activities and the effects of climate change. Conversely, the study showed that in 2022, the extent of the Salt Lake was 114.5 m2 indicating an increase of 25.5 m2. This is, however, attributed to the decline in the salt mining activities in the area. Since the lake has no outlet other than evaporation, the minerals accumulate and give the lake high salinity. The methods adopted by the miners in salt processing were identified to be mainly traditional as about 95% of the respondents indicated having no health challenge since they have been part of the activities. The study further revealed the use of locally made tools and materials such as clay pot, drum, calabash, firewood, bucket, etc. for salt mining and processing. The majority of the respondents (65%) incurred cost of more than N5,000 in the purchase of tools and materials and labor for salt mining business. Likewise, the study revealed factors such as modern technology, cost of materials and good market, if put in place, can improve salt mining business in the area. The t-test revealed that respondent’s monthly income from the salt mining business has no significant determinant relationship with the respondent’s educational qualification and housing type in the study area. Improved modern salt mining system is recommended.
    
    VL  - 14
    IS  - 1
    ER  - 

    Copy | Download

Author Information
  • National Space Research and Development Agency, Obasanjo Space Centre, Abuja, Nigeria

  • National Space Research and Development Agency, Obasanjo Space Centre, Abuja, Nigeria

  • National Space Research and Development Agency, Obasanjo Space Centre, Abuja, Nigeria

  • National Space Research and Development Agency, Obasanjo Space Centre, Abuja, Nigeria

  • Abstract
  • Keywords
  • Document Sections

    1. 1. Introduction
    2. 2. Material and Methods
    3. 3. Results and Discussions
    4. 4. Conclusion and Recommendation
    Show Full Outline
  • Abbreviations
  • Conflicts of Interest
  • References
  • Cite This Article
  • Author Information