Abstract
Khaya senegalensis is an emblematic African mahogany species of the Sudanian and Sahelian regions that is increasingly threatened by overexploitation and habitat fragmentation. This study assessed the genetic diversity and structure of six maternal progenies derived from a natural stand of K. senegalensis in northern Côte d'Ivoire using microsatellite (SSR) markers, including eight loci transferred from Swietenia macrophylla and one species-specific locus. Sixty individuals were successfully genotyped. The SSR markers revealed a relatively high level of expected genetic diversity (He = 0.54; mean PIC = 0.78), but a pronounced deficit of observed heterozygosity (Ho = 0.12). Genetic differentiation among maternal progenies was high (FST = 0.31), whereas the estimated gene flow was limited (Nm = 0.73), suggesting restricted genetic connectivity within the studied stand. High null allele frequencies, particularly at locus Sm12 (up to 0.89), indicate that part of the observed homozygote excess and elevated fixation index (FIS = 0.75) may be attributable to technical amplification bias associated with the transfer of heterologous SSR markers. Bayesian clustering and Neighbor-Joining analysis consistently identified three genetic clusters, a pattern further supported by AMOVA, which attributed 30% of the total genetic variation to differences among maternal progenies and 70% to variation within progenies. These findings highlight the need for species-specific markers and provide valuable information for the seed selection, conservation, and sustainable management of this economically important African timber species.
|
Published in
|
Biochemistry and Molecular Biology (Volume 11, Issue 4)
|
|
DOI
|
10.11648/j.bmb.20261104.12
|
|
Page(s)
|
80-95 |
|
Creative Commons
|

This is an Open Access article, distributed under the terms of the Creative Commons Attribution 4.0 International License (http://creativecommons.org/licenses/by/4.0/), which permits unrestricted use, distribution and reproduction in any medium or format, provided the original work is properly cited.
|
|
Copyright
|
Copyright © The Author(s), 2026. Published by Science Publishing Group
|
Keywords
Khaya Senegalensis, Côte D'Ivoire, Microsatellites Markers, Genetic Diversity, Genetic Structure, Habitat Fragmentation
1. Introduction
Genetic diversity is a fundamental component of biodiversity, as it provides the genetic variation necessary for populations to adapt to environmental changes, maintain evolutionary resilience, and persist over time
| [1] | Hunter ME, da Silva JM, Mastretta-Yanes A, & Hoban SM (2024). A new era of genetic diversity conservation through novel tools and accessible data. Frontiers in Ecology and the Environment, 22, 740.
https://doi.org/10.1002/fee.2740 |
[1]
. In forest tree species, genetic diversity is particularly important because of their long generation times and exposure to rapidly changing environmental conditions, which may increase the importance of maintaining sufficient adaptive capacity across generations
| [2] | Milesi P, Kastally C, Dauphin B, Milesi P, Kastally C, Dauphin B, Cervantes S, Bagnoli F, Budde KB, Cavers S, Fady B, Faivre-Rampant P, González-Martínez SC, Grivet D, Gugerli F, Jorge V, Kupin IL, Ojeda DI, Olsson S, Opgenoorth L, Pinosio S, Plomion C, Rellstab C, Rogier O, Scalabrin S, Scotti I, Vendramin GG, Westergren M, Lascoux M, Pyhäjärvi T (2024). Resilience of genetic diversity in forest trees over the Quaternary. Nature Communications 15, 8538.
https://doi.org/10.1038/s41467-024-52612-y |
[2]
. Consequently, conserving forest genetic resources is essential for maintaining the evolutionary potential, resilience, and long-term sustainability of forest ecosystems, particularly under increasing anthropogenic pressures and environmental change
| [3] | Konrad H, George JP, Szukala A (2025). The state of forest genetic diversity: anthropogenic impacts and conservation initiatives. In: Lapin K, Oettel J, Braun M, Konrad H (eds) Ecological Connectivity of Forest Ecosystems. Springer, Cham. pp 55-89. https://doi.org/10.1007/978-3-031-82206-3_4 |
[3]
. Forest genetic resources are increasingly threatened by deforestation, habitat degradation, overexploitation, and other anthropogenic pressures, highlighting the need for their effective conservation and sustainable management
| [4] | Food and Agriculture Organization of the United Nations (FAO). 2025. The Second Report on the State of the World’s Forest Genetic Resources. Rome.
https://doi.org/10.4060/cd4838en |
[4]
(FAO, 2025). These pressures can reduce effective population size, disrupt pollen and seed dispersal, and restrict gene flow, potentially increasing genetic drift, inbreeding, and genetic differentiation among forest populations
| [5] | Sebbenn A. (2011). Effects of forest fragmentation on the effective and realized gene flow of Neotropical tree species: implications for genetic conservation. BMC Proceedings, 5 (Suppl 7): 06.
https://doi.org/10.1186/1753-6561-5-S7-O6 |
[5]
. Such processes are of particular concern in tropical tree species, where the maintenance of genetic connectivity is essential for preserving evolutionary potential and long-term population viability.
The genus
Khaya A. Juss. (Meliaceae), commonly known as African mahogany, comprises several high-value tropical hardwood species, with
Khaya anthotheca,
Khaya grandifoliola,
Khaya ivorensis and
Khaya senegalensis being among the most important timber species in tropical Africa
. Their wood has physicochemical properties comparable to the Brazilian mahogany
(Swietenia macrophylla) | [8] | Pinheiro AL, Couto L, Pinheiro DT, Brunetta JMFC (2011). Ecologia, silvicultura e tecnologia de utilização dos mognos-africanos (Khaya spp.). 1. ed. Viçosa: Sociedade Brasileira de Agrossilvicultura, Produqao Independente, Viqosa, 102pp. |
[8]
. The wood is highly valued for its quality, workability and aesthetic properties and is widely used for furniture, decorative veneers, plywood, interior finishing, boat building and other high-end applications
| [9] | Momolli DR, Caldeira MVW, Gomes GSL, Gomes R, Duarte VBR, Godinho TDO, da Silva JGM, dos Santos VB, Vidaurre GB, Faria JCT, et al (2024). Stem longitudinal gradient for basic density, Carbon, Nitrogen, and CN ratio in Khaya spp.: improved correlation using diameter instead of commercial height. Forests, 15, 1923.
https://doi.org/10.3390/f15111923 |
[9]
.
These species therefore represent an important source of valuable tropical hardwood and have gained increasing attention for plantation forestry and sustainable timber production beyond their native range
| [10] | Houehanou B & Gaoue OG (2025). Proximity to forests, fire and plantation characteristics influence understory plant species richness more than phylogenetic diversity in African mahogany plantations. Scientific Reports 15, 31422.
https://doi.org/10.1038/s41598-025-03104-6 |
[10]
. However, the high economic value of
Khaya timber has also driven intensive exploitation of natural populations, while habitat degradation and fragmentation further threaten the conservation of their genetic resources
| [11] | Langa AM, Padonou EA, Akabassi GC, Akakpo BA & Assogbadjo AE (2024). Diversity and Structure of Khaya Senegalensis (desr.) A. Juss Habitats Along Phytogeographical Zones in Chad (Central Africa): Implications for Conservation and Sustainable Use. Journal of Environmental Geography, 17, 45-56. https://doi.org/10.14232/jengeo-2024-45530 |
[11]
. Understanding the genetic diversity and population structure of these species is consequently essential for developing effective conservation and sustainable management strategies, particularly for
K. senegalensis, one of the most widely distributed
Khaya species in the Sudano-Sahelian region.
Among the economically important tropical timber species of West Africa,
K. senegalensis (Desr.) A. Juss. (Meliaceae) occupies a prominent position owing to its high-quality timber, medicinal properties and ecological importance. Nevertheless, extensive harvesting and the progressive degradation of its natural habitats raise growing concerns regarding the conservation of its genetic resources
| [12] | Amekpo KS, Dourma M, Lamboni P, Batawila, K, & Akpagana, K (2025). Usage, disponibilité et étude de la vulnérabilité de Khaya senegalensis (Desr.) A. Juss chez les populations riveraines de la Reserve de Faune d’Alédjo au Togo [Use, availability and study of the vulnerability of Khaya senegalensis (Desr.) A. Juss in the riverine populations of the Alédjo Wildlife Reserve in Togo]. Revue Ecosystèmes Et Paysages, 5(2), https://doi.org/10.59384/recopays.tg.v5i2.171 |
[12]
. Although the species is widely distributed throughout the Sudanian and Sahelian zones of Africa, information on the genetic structure and diversity of many natural populations remains limited.
The development of species-specific microsatellite markers has considerably advanced the study of genetic diversity in
K. senegalensis. Sexton et al.
| [13] | Sexton GJ Frere CH, Dieters MJ, Godwin ID, Prentis PJ (2010). Development and characterization of microsatellite loci for Khaya senegalensis (Meliaceae). American Journal of Botany, 97(11), e111-e113. https://doi.org/10.3732/ajb.1000300 |
[13]
first developed and characterized polymorphic microsatellite loci for the species, and Karan et al.
| [14] | Karan M, Evans DS, Reilly D, Schulte K, Wright C, Innes D, Holton TA, Nikles DG & Dickinson GR (2012). Rapid microsatellite marker development for African mahogany (Khaya senegalensis) using next-generation sequencing. Molecular Ecology Resources, 12(2), 344-353.
https://doi.org/10.1111/j.1755-0998.2011.03080.x |
[14]
subsequently expanded the available set by developing additional highly polymorphic SSR markers. Using these molecular tools, Sexton et al.
| [15] | Sexton JP, Hangartner SB, Hoffmann AA (2015a). Genetic isolation by environment or distance: Which pattern of gene flow is most common? Evolution, 68(1), 1-15.
https://doi.org/10.1111/evo.12258 |
[15]
demonstrated that the genetic structure of
K. senegalensis across its natural distribution has been shaped by historical biogeographic processes, including putative forest refugia and barriers to gene flow. More broadly, microsatellite markers remain among the most informative molecular markers for population genetic studies because of their codominant inheritance, high polymorphism, reproducibility, and ability to detect both intra- and inter-population genetic variation
| [16] | Kalia RK, Rai MK, Kalia S, Singh R, & Dhawan AK (2011). Microsatellite markers: An overview of the recent progress in plants. Euphytica, 177(3), 309-334.
https://doi.org/10.1007/s10681-010-0286-9 |
| [17] | Vieira M. L. C., Santini L., Diniz A. L., & Munhoz C. F. (2016). Microsatellite markers: What they mean and why they are so useful. Genetics and Molecular Biology, 39(3), 312-328.
https://doi.org/10.1590/1678-4685-GMB-2016-0027 |
[16, 17]
.
Previous studies have revealed moderate to high levels of genetic diversity in species of the genus Khaya, together with genetic structuring associated with geographical distribution and historical patterns of gene flow. However, substantial knowledge gaps remain regarding the genetic diversity and structure of K. senegalensis, particularly in West Africa, where increasing anthropogenic pressure may accelerate habitat fragmentation, reduce landscape connectivity, and promote genetic drift and inbreeding.
Côte d'Ivoire lies within the western part of the natural distribution range of K. senegalensis, yet molecular information describing the genetic diversity of its natural stands remains scarce. Such information is essential for understanding the genetic resources maintained within natural populations and for developing effective conservation, seed collection, and sustainable management strategies.
The general objective of this study was to generate genetic information on six maternal progenies of Khaya senegalensis to support the conservation and sustainable management of its genetic resources and inform reforestation efforts.
Specifically, we aimed to: (i) characterize the genetic diversity within the six maternal progenies of Khaya senegalensis; and (ii) assess the extent of genetic differentiation and the genetic relationships among the six maternal progenies. We hypothesized that the six maternal progenies of Khaya senegalensis would maintain substantial levels of genetic diversity within the studied natural stand. We further predicted that the maternal progenies would exhibit significant genetic differentiation and distinct patterns of genetic relatedness, reflecting a non-random distribution of genetic variation among maternal families.
2. Materials and Methods
2.1. Plant Material
Thirty seeds collected beneath each of six Khaya senegalensis mother trees were sown, yielding a total of 180 seedlings representing six maternal populations. These individuals were initially evaluated using agromorphological traits and subsequently screened with nine SSR primer pairs. All 180 seedlings were considered for molecular screening, and only individuals that produced clear amplification profiles at all nine SSR loci were retained for molecular characterization. Individuals that failed to produce amplification at one or more loci were excluded from the molecular dataset. Following this screening, 60 individuals (10 individuals per maternal progeny) were selected for DNA analysis, corresponding to the same six maternal progenies included in the agromorphological assessment. Importantly, the 60 individuals were retained solely on the basis of successful amplification across all nine SSR loci and were not selected according to their agromorphological characteristics or other phenotypic criteria. Thus, the reduction from 180 to 60 individuals resulted from the molecular genotyping quality-control procedure. Young leaves were collected from these seedlings for DNA extraction. The six mother trees originated from the Lataha Research Station of the National Center for Agronomic Research (CNRA) in Korhogo, northern Côte d'Ivoire. After collection, the leaves were dried and preserved as herbarium specimens until further processing.
2.2. DNA Extraction and Quality Assessment
Genomic DNA was extracted from approximately 100 mg of young leaf tissue using the cetyltrimethylammonium bromide (CTAB) method of Murray and Thompson
, with minor modifications to improve DNA recovery from tissues rich in secondary metabolites. Leaf samples were ground in liquid nitrogen and incubated in a preheated CTAB extraction buffer containing 2% CTAB, 1.4 M NaCl, 100 mM Tris-HCl (pH 8.0), 20 mM EDTA (pH 8.0), and 2% polyvinylpyrrolidone (PVP-40) at 65°C for 30 min. DNA was purified by two successive chloroform extractions, precipitated with cold isopropanol, washed twice with 70% ethanol, air-dried, resuspended in 100 μL TE buffer (10 mM Tris-HCl, 1 mM EDTA, pH 8.0), and treated with RNase A (10 mg mL⁻
1) at 37°C for 30 min to remove residual RNA. DNA concentration and purity were determined using a NanoDrop ND-1000 spectrophotometer (Thermo Fisher Scientific, Wilmington, DE, USA). Samples with an A260/A280 ratio between 1.7 and 2.0 were considered suitable for downstream analyses. DNA integrity was verified by electrophoresis on 1% agarose gels stained with ethidium bromide.
2.3. Primer Selection, PCR Amplification and Gel Electrophoresis
Nine microsatellite primer pairs were selected based on their reported polymorphism and amplification efficiency. Eight primer pairs (Sm series) corresponded to microsatellite loci originally developed for Swietenia macrophylla and subsequently shown to be transferable to Khaya senegalensis by Lemes et al.
| [19] | Lemes MR, Esashika T, Gaoue OG (2011). Microsatellites for mahoganies: twelve new loci for Swietenia macrophylla and its high transferability to Khaya senegalensis. American Journal of Botany, 98(8), e207-9. https://doi.org/10.3732/ajb.1100074 |
[19]
. The remaining primer pair (Ks008) was a species-specific microsatellite locus developed for K. senegalensis by Sexton
et al.
| [13] | Sexton GJ Frere CH, Dieters MJ, Godwin ID, Prentis PJ (2010). Development and characterization of microsatellite loci for Khaya senegalensis (Meliaceae). American Journal of Botany, 97(11), e111-e113. https://doi.org/10.3732/ajb.1000300 |
[13]
. PCR amplification conditions were adapted from Sexton et al.
| [13] | Sexton GJ Frere CH, Dieters MJ, Godwin ID, Prentis PJ (2010). Development and characterization of microsatellite loci for Khaya senegalensis (Meliaceae). American Journal of Botany, 97(11), e111-e113. https://doi.org/10.3732/ajb.1000300 |
[13]
. The primer sequences, repeat motifs, expected allele size ranges, and annealing temperatures are presented in
Table 1.
Primer pairs were initially screened using two individuals from each maternal progeny to assess amplification success and polymorphism before genotyping the complete dataset. PCR amplifications were performed in a 20 μL reaction volume containing 20 ng of genomic DNA, 10× PCR Master Mix, 0.3 μM of each primer, and nuclease-free water to the final volume. Thermal cycling consisted of an initial denaturation at 94°C for 5 min, followed by 30 cycles of 94°C for 1 min, 56°C for 1 min, and 72°C for 1 min, with a final extension at 72°C for 7 min. PCR products were separated by electrophoresis on 2% agarose gels prepared in 1× TAE buffer and compared with a 100-bp DNA ladder (HyperLadder IV; Bioline, Meridian Bioscience) to estimate fragment sizes.
Table 1.
Characteristics of the nine microsatellite primers used for the molecular diversity analysis of six populations of Khaya senegalensis, including eight Sm loci transferred from Swietenia macrophylla | [19] | Lemes MR, Esashika T, Gaoue OG (2011). Microsatellites for mahoganies: twelve new loci for Swietenia macrophylla and its high transferability to Khaya senegalensis. American Journal of Botany, 98(8), e207-9. https://doi.org/10.3732/ajb.1100074 |
| [13] | Sexton GJ Frere CH, Dieters MJ, Godwin ID, Prentis PJ (2010). Development and characterization of microsatellite loci for Khaya senegalensis (Meliaceae). American Journal of Botany, 97(11), e111-e113. https://doi.org/10.3732/ajb.1000300 |
Primer | Allele size (pb) | Repeat | Sequences (5′−3′) | Ta (°C) | Reference |
Ks008 | 249-275 | (AG) 19 | D: GCGCGATTGATTGACTTC | 56 | | [13] | Sexton GJ Frere CH, Dieters MJ, Godwin ID, Prentis PJ (2010). Development and characterization of microsatellite loci for Khaya senegalensis (Meliaceae). American Journal of Botany, 97(11), e111-e113. https://doi.org/10.3732/ajb.1000300 |
[13] |
I: GCGCTTAGCATTATTCTCC |
Sm05 | 240-262 | (AG) 17GG (AG) 6 | D: GCATGAGCTTGAGAGAATC | 60 | | [19] | Lemes MR, Esashika T, Gaoue OG (2011). Microsatellites for mahoganies: twelve new loci for Swietenia macrophylla and its high transferability to Khaya senegalensis. American Journal of Botany, 98(8), e207-9. https://doi.org/10.3732/ajb.1100074 |
[19] |
I: CAGAGGACTGAAGTAGCTGA |
Sm12 | 196-224 | (AG) 24 | D: AGAGTGTTCGAGAGCCTCAA | 56 | | [19] | Lemes MR, Esashika T, Gaoue OG (2011). Microsatellites for mahoganies: twelve new loci for Swietenia macrophylla and its high transferability to Khaya senegalensis. American Journal of Botany, 98(8), e207-9. https://doi.org/10.3732/ajb.1100074 |
[19] |
I: AGAGCCGAATTCACCGAT |
Sm18 | 196-232 | (AG) 19 | D: CTGTCATGCATATCGTTGGA | 56 | | [19] | Lemes MR, Esashika T, Gaoue OG (2011). Microsatellites for mahoganies: twelve new loci for Swietenia macrophylla and its high transferability to Khaya senegalensis. American Journal of Botany, 98(8), e207-9. https://doi.org/10.3732/ajb.1100074 |
[19] |
I: GGGCAGATAAAGAGGAACAAG | | |
Sm20 | 158-200 | (AG) 28 | D: CAACTCGTGAGGAATTTACC | 56 | | [19] | Lemes MR, Esashika T, Gaoue OG (2011). Microsatellites for mahoganies: twelve new loci for Swietenia macrophylla and its high transferability to Khaya senegalensis. American Journal of Botany, 98(8), e207-9. https://doi.org/10.3732/ajb.1100074 |
[19] |
I: TGGGATTTGTGTTCACCTT |
Sm28 | 126-166 | (AG) 25 | D: GCTCGGTGGTGTTACAGTT | 56 | | [19] | Lemes MR, Esashika T, Gaoue OG (2011). Microsatellites for mahoganies: twelve new loci for Swietenia macrophylla and its high transferability to Khaya senegalensis. American Journal of Botany, 98(8), e207-9. https://doi.org/10.3732/ajb.1100074 |
[19] |
I: CAGTATGACAGTATCAAGGGGA | |
Sm36 | 200-238 | (AG) 19 | D: CGTGGTTGCTACCTATATGC | 56 | | [19] | Lemes MR, Esashika T, Gaoue OG (2011). Microsatellites for mahoganies: twelve new loci for Swietenia macrophylla and its high transferability to Khaya senegalensis. American Journal of Botany, 98(8), e207-9. https://doi.org/10.3732/ajb.1100074 |
[19] |
I: TATACCGACCGCGTTAAGT |
Sm39 | 154-202 | (AG) 19 | D: CAGTCATGGAGCGTAGCTAA | 56 | | [19] | Lemes MR, Esashika T, Gaoue OG (2011). Microsatellites for mahoganies: twelve new loci for Swietenia macrophylla and its high transferability to Khaya senegalensis. American Journal of Botany, 98(8), e207-9. https://doi.org/10.3732/ajb.1100074 |
[19] |
I: TGCAGTTTCAGAACCTGAATC |
Sm49 | 136-174 | (AG) 19 | D: GAACTGGCAATGTGCTGACT | 64 | | [19] | Lemes MR, Esashika T, Gaoue OG (2011). Microsatellites for mahoganies: twelve new loci for Swietenia macrophylla and its high transferability to Khaya senegalensis. American Journal of Botany, 98(8), e207-9. https://doi.org/10.3732/ajb.1100074 |
[19] |
I: TCGGCAATAGCAAGACATTC |
Bp: base pairs, F: Forward primer, R: Reverse primer, Ta: optimal annealing temperature
2.4. Genetic Data Analysis
The genotypic profiles obtained after scoring the electrophoresis gels were used to assess the level of polymorphism of the microsatellite markers. The polymorphism information content (PIC) of each locus was determined according to the method proposed by Guo & Elston
. The generated data were also used to estimate genetic diversity parameters within and among maternal progenies. The assessment of genetic diversity within progeny groups was based on several parameters, including the percentage of polymorphic loci (P), the mean number of alleles per locus (A), the effective number of alleles (Ae), observed heterozygosity (Ho), expected heterozygosity (He), Shannon’s diversity index (I), and the fixation index (F
IS). These parameters were calculated for all studied progeny groups and for each primer used.
Genetic differentiation among the six maternal progenies was estimated with the Wright
Fstatistics using the Weir and Cockerham
| [22] | Weir BS & Cockerham CC (1984). Estimating F-statistics for the analysis of population structure. Evolution 38 (6), 1358-1370. https://doi.org/10.2307/2408641 |
[22]
estimators. The estimated parameters were genetic differentiation among groups (F
ST), differentiation of individuals within groups (F
IS), differentiation between individuals and the total sample (F
IT), and gene flow (Nm).
In addition, the partitioning of genetic variation among the six maternal progenies was investigated using analysis of molecular variance (AMOVA). The significance of the AMOVA was tested using a numerical permutation approach with 9,999 permutations. The AMOVA was based on Φ-statistics (Phi-statistics), which are analogous to Wright’s F-statistics, to quantify the degree of genetic differentiation among progeny groups and estimate gene flow
| [23] | Excoffier L, Smouse PE & Quattro JM (1992). Analysis of molecular variance inferred from metric distances among DNA Haplotypes: Application to human mitochondrial DNA restriction data. Genetics 131, 479-491.
https://doi.org/10.1093/genetics/131.2.479 |
[23]
. The different genetic diversity parameters were calculated using GenAlEx version 6.5 software
| [24] | Peakall R and Smouse PE (2012). GenAlEx 6.5: Genetic Analysis in Excel. Population Genetic Software for Teaching and Research-An Update. Bioinformatics Application Note, 28, 2537-2539. http://dx.doi.org/10.1093/bioinformatics/bts460 |
[24]
. Genetic relationships among the six maternal progenies were assessed through principal coordinate analysis (PCoA) performed using GenAlEx 6.5.
To identify genetic similarities and group individuals according to their genetic composition, a model-based clustering approach was used to determine the most likely number of genetic clusters. This algorithm assigns individuals to genetic groups and estimates the level of admixture among groups. The STRUCTURE software version 2.3.4
was used for this analysis. The most likely number of genetic clusters was determined by testing values of K ranging from 1 to 10, with 20 independent runs performed to assess the reproducibility of the results. The admixture model was applied.
The genetic relationships among the six maternal progenies were further analyzed using a dendrogram constructed according to the Neighbor-Joining method
, based on Nei’s genetic distances
. This analysis was performed using the PHYLIP software package
. To evaluate the robustness of the inferred relationships, bootstrap analysis with 1,000 replicates was first performed using the Seqboot program. Genetic distances were subsequently calculated using the Gendist program based on allele frequencies. Phylogenetic trees were generated using the Neighbor program, and a consensus tree was obtained using the Consensus program. Finally, the resulting tree was visualized using FigTree v1.4.3 software
.
3. Results
3.1. Genetic Diversity of Progeny Groups and Polymorphism of Microsatellite Markers
The main genetic diversity parameters estimated for the nine microsatellite (SSR) markers across the six maternal progenies of
Khaya senegalensis are summarized in
Table 2. Marker informativeness and genetic diversity were evaluated using the number of observed alleles (A), effective number of alleles (Ae), observed heterozygosity (Ho), expected heterozygosity (He), fixation index (F), Shannon diversity index (I), and polymorphism information content (PIC). The number of observed alleles ranged from 2.33 (Sm12) to 5.67 (Sm05), averaging 3.94 alleles per locus. Sm05, Ks008, Sm18, and Sm28 were the most polymorphic loci, whereas Sm12 and Sm36 showed the lowest allelic diversity. The effective number of alleles varied from 1.86 (Sm36) to 4.07 (Sm05), indicating unequal allele frequencies across loci. Observed heterozygosity was low (0.00-0.23), while expected heterozygosity ranged from 0.39 to 0.73, revealing a marked deficit of heterozygotes. This pattern was supported by high fixation index values (0.36-1.00), with most loci exceeding 0.70, suggesting the effects of inbreeding, mating among related individuals, population subdivision (Wahlund effect), or restricted gene flow. The Shannon diversity index ranged from 0.66 (Sm36) to 1.49 (Sm05), confirming greater diversity at Sm05, Sm28, Sm18, and Ks008. PIC values ranged from 0.67 to 0.88 (mean = 0.78). Following Botstein et al. (1980), all loci were highly informative (PIC > 0.50), with Sm05 being the most informative marker. Overall, the nine SSR markers exhibited high polymorphism and strong discriminatory power for assessing genetic diversity in
Khaya senegalensis. Although the low observed heterozygosity and high fixation index indicate substantial heterozygote deficiency and genetic structuring, the high He, I, and PIC values confirm the suitability of these markers for studies of genetic diversity, population structure, conservation, and breeding of
K. senegalensis.
Genetic diversity varied among the six maternal progenies of Khaya senegalensis (
Table 3). The percentage of polymorphic loci (P%) was 100% in Gen1, Gen2, Gen3, Gen5, and Gen6, whereas Gen4 showed 77.78%, indicating that two of the nine SSR loci were monomorphic.
Table 2. Genetic diversity parameters of the nine microsatellite markers (SSR) used for the analysis of Khaya senegalensis progeny groups.
Locus | A | Ae | Ho | He | F | I | PIC |
KS008 | 5.00 | 2.55 | 0.15 | 0.57 | 0.74 | 1.15 | 0.85 |
Sm05 | 5.67 | 4.07 | 0.15 | 0.73 | 0.80 | 1.49 | 0.88 |
Sm12 | 2.33 | 2.00 | 0.00 | 0.46 | 1.00 | 0.71 | 0.67 |
Sm18 | 5.00 | 3.36 | 0.08 | 0.66 | 0.88 | 1.30 | 0.78 |
Sm20 | 3.83 | 2.43 | 0.08 | 0.50 | 0.80 | 0.96 | 0.73 |
Sm28 | 5.00 | 3.33 | 0.15 | 0.67 | 0.76 | 1.34 | 0.79 |
Sm36 | 2.50 | 1.86 | 0.10 | 0.39 | 0.75 | 0.66 | 0.80 |
Sm39 | 3.00 | 1.96 | 0.23 | 0.41 | 0.36 | 0.73 | 0.80 |
Sm49 | 3.17 | 1.98 | 0.09 | 0.44 | 0.67 | 0.78 | 0.68 |
Mean | 3.94 | 2.62 | 0.12 | 0.54 | 0.75 | 1.01 | 0.78 |
The mean number of alleles per locus (A) ranged from 2.89 (Gen4) to 5.22 (Gen5), while the effective number of alleles (Ae) varied from 1.91 (Gen3) to 3.37 (Gen5). Similarly, the Shannon diversity index (I) ranged from 0.76 (Gen4) to 1.45 (Gen5), indicating that Gen5 possessed the highest allelic diversity, whereas Gen4 exhibited the lowest.
Observed heterozygosity (Ho) remained low across all groups (0.08-0.24), whereas expected heterozygosity (He) ranged from 0.43 to 0.67. In every progeny group, Ho was lower than He, indicating a consistent deficit of heterozygotes. This pattern was supported by high positive fixation coefficients (FIS = 0.67-0.87), with the highest values observed in Gen1 and Gen4 and the lowest in Gen5.
Overall, Gen5 exhibited the greatest genetic diversity, combining the highest values of A, Ae, I, Ho, and He with the lowest fixation coefficient. In contrast, Gen4 showed the lowest diversity, characterized by fewer polymorphic loci, lower allelic richness, lower He and I values, and the highest fixation coefficient.
Table 3. Genetic diversity parameters within the six maternal progenies of Khaya senegalensis estimated using nine microsatellite (SSR) markers.
Progeny groups | N (mean individuals/locus) | (P%) | A | (Ae) | Ho | He | F | I |
Gen1 | 10 | 100 | 4.11 | 2.78 | 0.08 | 0.57 | 0.87 | 1.11 |
Gen2 | 10 | 100 | 3.78 | 2.62 | 0.12 | 0.55 | 0.76 | 1.00 |
Gen3 | 9.56 | 100 | 3.56 | 1.91 | 0.11 | 0.45 | 0.68 | 0.83 |
Gen4 | 10 | 77.78 | 2.89 | 2.09 | 0.10 | 0.43 | 0.87 | 0.76 |
Gen5 | 9.89 | 100 | 5.22 | 3.37 | 0.23 | 0.67 | 0.67 | 1.45 |
Gen6 | 10 | 100 | 4.00 | 2.20 | 0.09 | 0.49 | 0.80 | 1.03 |
Mean | 9.91 | 96.30 | 3.93 | 2.50 | 0.12 | 0.53 | 0.77 | 1.03 |
3.2. Genetic Differentiation Among the Six Maternal Progenies
Wright's fixation indices (Weir & Cockerham, 1984) estimated from the nine SSR markers revealed genetic differentiation among the six maternal progenies of
Khaya senegalensis (
Table 4). The within-group inbreeding coefficient (F
IS) ranged from 0.429 (Sm39) to 1.000 (Sm12), with a mean of 0.777 ± 0.051, indicating a generalized deficit of heterozygotes within progeny groups. Similarly, the overall inbreeding coefficient (F
IT) ranged from 0.707 to 1.000, averaging 0.855 ± 0.026, reflecting a pronounced heterozygote deficiency across all groups. Genetic differentiation (F
ST) varied from 0.147 (Sm18) to 0.488 (Sm39), with a mean of 0.307 ± 0.043. The highest differentiation was observed at Sm39 and Sm36, whereas Sm18, Sm28, and Sm05 showed the lowest values. Gene flow was indirectly estimated from F
ST using the classical island-model relationship: Nm=(1−F
ST)/(4F
ST), where F
ST represents genetic differentiation among groups and Nm represents the theoretical effective number of migrants per generation. This approximation assumes, among other conditions, migration-drift equilibrium, approximately equal population sizes, symmetrical migration among groups, and random mating. Therefore, the resulting Nm values should be interpreted as indirect estimates under the island-model framework rather than as direct measurements of contemporary migration. Using this relationship, gene flow (Nm) ranged from 0.263 (Sm39) to 1.451 (Sm18), with a mean of 0.734 ± 0.159 migrants per generation. As expected from the mathematical relationship between F
ST and Nm, loci with lower F
ST values yielded higher inferred Nm values. Overall, the mean F
ST of 0.307 indicates appreciable genetic differentiation among the sampled maternal progenies, while the corresponding mean Nm of 0.734 represents a relatively low indirect estimate of gene exchange under the island-model approximation. However, these estimates should be interpreted cautiously given the sampling design. The six groups consisted of maternal progenies derived from mother trees originating from the same research station/stand, rather than geographically isolated populations. Thus, the observed F
ST values reflect genetic differentiation among the sampled maternal progenies, and the corresponding Nm values should not be interpreted as direct estimates of contemporary gene flow among geographically distinct populations. Instead, they provide an indirect indication of the level of migration that, under the assumptions of the island model, would be associated with the observed degree of genetic differentiation.
Table 4. Wright's fixation indices (FIS, FIT, and FST) and indirect estimates of gene flow (Nm) for the nine microsatellite loci in the six maternal progenies of Khaya senegalensis.
Locus | FIS | FIT | FST | Nm |
KS008 | 0.74 | 0.82 | 0.34 | 0.50 |
Sm05 | 0.79 | 0.83 | 0.17 | 1.21 |
Sm12 | 1.00 | 1.00 | 0.32 | 0.52 |
Sm18 | 0.87 | 0.89 | 0.15 | 1.45 |
Sm20 | 0.83 | 0.89 | 0.32 | 0.54 |
Sm28 | 0.78 | 0.81 | 0.15 | 1.39 |
Sm36 | 0.75 | 0.87 | 0.48 | 0.27 |
Sm39 | 0.43 | 0.71 | 0.49 | 0.26 |
Sm49 | 0.80 | 0.87 | 0.35 | 0.46 |
Mean ± SE | 0.78 ± 0.05 | 0.85 ± 0.03 | 0.31 ± 0.04 | 0.73 ± 0.16 |
Seventy percent of the total genetic variation was distributed within the six maternal progenies, whereas 30% occurred among groups (
Table 5). The fixation index (ΦPT) was estimated at 0.298 (
P < 0.001), indicating significant genetic differentiation among the six maternal progenies. The estimated gene flow was low (Nm = 0.589), suggesting limited genetic exchange among groups.
Table 5. Analysis of molecular variance (AMOVA) showing the partitioning of genetic variation among and within the six maternal progenies of Khaya senegalensis.
Source of variation | Df | SS | MS | Estimated variance | Percentage of total variation (%) | ΦPT | p |
Among populations | 5 | 253.350 | 50.67 | 4.10 | 30 | 0.298 | p < 0.001 |
Within populations | 54 | 521.700 | 9.66 | 9.66 | 70 | - | - |
Total | 59 | 775.05 | 13.76 | 13.76 | 100% | | |
3.3. Cluster and Assignment Analysis
The principal coordinate analysis (PCoA) based on Nei's genetic distances showed that the first two axes explained 85.47% of the total genetic variation, with the first and second axes accounting for 50.85% and 34.61%, respectively (
Table 6). This high proportion of explained variance indicates that the two-dimensional ordination accurately represents the genetic relationships among the six maternal progenies.
Table 6. Eigenvalues, percentage of genetic variation explained, and coordinates of the six maternal progenies on the first two axes of the principal coordinate analysis (PCoA).
Principal coordinate | Axis 1 | Axis 2 |
Eigenvalue | 0.586 | 0.399 |
Variation explained (%) | 50.85 | 34.61 |
Cumulative variation explained (%) | 50.85 | 85.47 |
Gen1 | 0.407 | 0.021 |
Gen2 | 0.423 | 0.058 |
Gen3 | -0.007 | -0.331 |
Gen4 | -0.310 | -0.327 |
Gen5 | -0.338 | 0.217 |
Gen6 | -0.175 | 0.363 |
Gen1-Gen6: maternal progeny 1-6
The PCoA ordination identified three distinct genetic clusters (
Figure 1). Gen1 and Gen2 grouped closely together, indicating high genetic similarity, while Gen3 and Gen4 formed a second cluster. Gen5 and Gen6 clustered separately, constituting a third genetically distinct group. These results demonstrate clear genetic differentiation among the three progeny group pairs (Gen1-Gen2, Gen3-Gen4, and Gen5-Gen6).
Figure 1. Principal coordinate analysis (PCoA) of the six Khaya senegalensis maternal progenies based on Nei's genetic distances.
The Population structure inferred by Bayesian clustering analysis implemented in STRUCTURE version 2.3.4. The analysis was performed under an admixture model with correlated allele frequencies. The number of genetic clusters (K) was evaluated from K = 1 to K = 10, with 20 independent runs for each K. Each run consisted of a burn-in period of 100,000 iterations followed by 100,000 MCMC Markov Chain Monte Carlo (MCMC) iterations. The most informative value of K was assessed using the Evanno method, based on the magnitude of ΔK, calculated from the second-order rate of change in the log probability of the data [LnP (D)] between successive K values (Evanno et al., 2005). The mean LnP (D) increased progressively from −1971.23 at K = 1 to −1130.41 at K = 10. However, the highest LnP (D) value at K = 10 was not interpreted alone as indicating the optimal number of clusters, because LnP (D) commonly increases as K increases. Instead, the Evanno analysis revealed a pronounced maximum in ΔK at K = 3 (ΔK = 309.27), substantially higher than the values obtained for the other K values. Accordingly, K = 3 was retained as the most informative hierarchical level of genetic subdivision according to the Evanno criterion (
Figure 2). This result should be interpreted as the clustering level most strongly supported by the ΔK criterion rather than as definitive evidence that three biologically distinct populations exist.
Figure 2. Determination of the most informative number of genetic clusters (K) in the 60 Khaya senegalensis individuals using STRUCTURE analysis.
(a) Evanno method showing the distribution of ΔK across the tested K values (K = 1-10), with the highest ΔK value observed at K = 3 (ΔK = 309.27). (b) Mean log probability of the data [LnP (D)] across the tested K values.
The STRUCTURE bar plot generated at K = 3 showed the assignment probabilities of the 60 individuals to the inferred genetic clusters. Individuals with high membership coefficients greater than 0.80 were considered predominantly assigned to a single cluster, whereas individuals with lower or mixed membership coefficients were considered to exhibit mixed ancestry components. These mixed membership patterns were interpreted as evidence of shared genetic ancestry or genetic admixture in the sampled individuals, rather than being taken as direct evidence of historical gene flow (
Figure 3).
The first inferred cluster (orange) consisted mainly of individuals from Gen1 and Gen2 maternal progenies individuals, which were phenotypically characterized by lower growth performance. The second cluster (purple) included individuals from the Gen3 and Gen4 maternal progenies, which exhibited larger stem diameters. The third cluster (blue) was predominantly composed of individuals from the Gen 5 and Gen6 maternal progenies which showed superior growth performance (
Figure 3). However, these associations should be interpreted cautiously because all individuals originated from maternal progenies established from mother trees within the same research station/stand. Thus, the three STRUCTURE clusters represent genetic ancestry components detected within the sampled material and should not be interpreted as three geographically isolated or independently evolving populations. Comparison with the morphological classification revealed partial correspondence between the two approaches. Although both analyses identified three major groups, Gen5, which clustered with Gen1 and Gen2 based on morphological traits, grouped with Gen6 in the SSR-based analysis. This partial correspondence suggests that phenotypic differentiation in growth-related traits does not completely mirror the genetic ancestry patterns detected using the eight SSR markers. However, given the common geographic origin of the maternal progenies and the relatively small number of individuals analyzed per progeny, these differences should be interpreted as patterns of genetic differentiation within the sampled stand rather than evidence of distinct geographic populations.
Figure 3. Population genetic structure of 60 individuals from six maternal progenies (Gen1-Gen6) inferred using the Bayesian clustering algorithm implemented in STRUCTURE at K = 3.
Each vertical bar represents an individual, and the different colors indicate the estimated membership coefficients (Q values) for the three inferred genetic clusters. Individuals are grouped according to their maternal progenies.
The Neighbor-Joining (NJ) dendrogram constructed from Nei’s genetic distances provided additional insights into the genetic relationships among the six maternal progenies. The resulting dendrogram revealed two major genetic groups (
Figure 4). The first major group (GI) consisted of two subgroups: Gen1-Gen2 (SGI) and Gen5-Gen6 (SGII). The stability of the inferred clustering was assessed using 1,000 bootstrap replicates. The Gen1-Gen2 and Gen5-Gen6 groupings were supported by the bootstrap percentages shown at the corresponding nodes in
Figure 4. Likewise, the bootstrap percentages observed at the different nodes provided an assessment of the stability of the inferred clusters and overall dendrogram topology. The second major group (GII) comprised Gen3 and Gen4, which clustered closely together and were clearly differentiated from the Gen1-Gen2 and Gen5-Gen6 groups.
Figure 4. Neighbor-Joining dendrogram showing the genetic relationships among the six maternal progenies of Khaya senegalensis based on Nei’s genetic distances.
4. Discussion
4.1. Genetic Diversity and Informativeness of SSR Markers in Khaya Senegalensis
The nine microsatellite markers used in this study revealed substantial levels of genetic variation among the sampled maternal progenies of
Khaya senegalensis. The high level of polymorphism (mean PIC = 0.78; mean number of observed alleles, A = 3.94) supports the utility of SSR markers originally developed for
Swietenia macrophylla for detecting genetic variation in
K. senegalensis, reflecting the transferability of these markers between closely related species within the Meliaceae. The relatively high allelic richness and expected heterozygosity (He = 0.39-0.73) further indicate that the sampled progenies harbor appreciable genetic variation, an essential component of the adaptive potential of tree populations under changing environmental conditions
. However, these diversity estimates should be interpreted with caution because only 10 individuals were retained per maternal progeny after molecular screening. The relatively small number of individuals per progeny may reduce the precision of allele-frequency estimates and the probability of detecting rare alleles, and may increase sampling variance in estimates of genetic differentiation among progenies. Nevertheless, the equal representation of 10 individuals per maternal progeny provides a balanced sampling design for comparisons among the six progenies. Accordingly, allele-frequency and genetic-differentiation estimates were interpreted cautiously, particularly with respect to rare alleles and small differences among progenies. The levels of genetic diversity observed are consistent with previous studies on
K. senegalensis. Karan et al.
| [14] | Karan M, Evans DS, Reilly D, Schulte K, Wright C, Innes D, Holton TA, Nikles DG & Dickinson GR (2012). Rapid microsatellite marker development for African mahogany (Khaya senegalensis) using next-generation sequencing. Molecular Ecology Resources, 12(2), 344-353.
https://doi.org/10.1111/j.1755-0998.2011.03080.x |
[14]
developed species-specific microsatellite markers that proved highly polymorphic, while Sexton et al.
| [31] | Sexton GJ, Frere CH, Kalinganire A, Uwamariya A, Lowe AJ, Godwin ID, Prentis PJ, Dieters MJ (2015b) Influence of putative forest refugia and biogeographic barriers on genetic variation in Khaya senegalensis. Tree Genetics & Genomes, 11, 103.
https://doi.org/10.1007/s11295-015-0933-3 |
[31]
reported greater genetic diversity in West African than in East African populations, identifying West Africa as a region of comparatively high genetic diversity for the species. Because the material analyzed in the present study originated from Côte d'Ivoire, within the western part of the species' natural range, the relatively high diversity detected here is broadly consistent with this regional pattern. However, given the limited number of sampled individuals and the fact that all progenies originated from a single research station, these results should not be extrapolated directly to the genetic diversity of the entire West African range of
K. senegalensis. Comparable patterns have also been reported in other African mahogany species. Bouka et al.
| [32] | Bouka-Dipelet UG, Doumenge C, Ekué MRM, Duminil J, Florence J, Degen B, Loumeto J-J, McKey DB & Hardy OJ (2024). Genetic differentiation in Khaya ivorensis A. Chev., a threaten tree of evergreen African rainforests. Tree Genetics & Genomes, 20(6), 41, 14 p.
https://doi.org/10.1007/s11295-024-01676-4 |
[32]
, for example, found pronounced genetic differentiation among
Khaya ivorensis populations from West and Central Africa (F
ST = 0.28), highlighting the influence of historical biogeographic processes and restricted gene flow on the genetic structure of the genus. Together, these findings suggest that historical and contemporary evolutionary processes may contribute to shaping genetic variation and differentiation within
Khaya. Nevertheless, the present study was conducted on maternal progenies originating from a single stand, and therefore cannot by itself distinguish the relative contributions of historical biogeography, gene flow, or other evolutionary processes to the patterns observed here.
The Shannon diversity index (I = 0.66-1.49) corroborated the substantial allelic variation detected across the sampled loci, with loci Sm05, Sm18, and Sm28 contributing most strongly to overall genetic variation through their relatively high allele richness, expected heterozygosity, and effective number of alleles.
All loci were highly informative, with PIC values ranging from 0.67 to 0.88, exceeding the threshold of 0.50 proposed by Botstein et al.
| [33] | Botstein D, White RL, Skolnick M & Davis RW (1980). Construction of a genetic linkage map in man using restriction fragment length polymorphisms. American Journal of Human Genetics, 32, 314-331. |
[33]
. Among them, Sm05 consistently showed the highest values for PIC, allele richness, effective allele number, expected heterozygosity, and Shannon diversity, making it the most informative marker among those evaluated in the present dataset for assessing genetic variation in
K. senegalensis. Although Sm12 exhibited comparatively lower diversity, its PIC value remained well above the threshold for highly informative markers, confirming its continued usefulness for detecting genetic variation in the sampled
K. senegalensis progenies.
4.2. Heterozygote Deficiency, Null Alleles, and Methodological Considerations
Although the SSR markers revealed substantial allelic diversity, the maternal progenies of
Khaya senegalensis exhibited a pronounced deficit of heterozygotes, with observed heterozygosity (Ho = 0.00-0.23) consistently lower than expected heterozygosity (He = 0.39-0.73). This pattern was reflected in the high fixation index values (F
IS = 0.36-1.00), indicating a substantial deficit of heterozygotes relative to Hardy-Weinberg expectations. Such heterozygote deficiencies are frequently reported in tropical tree species and are generally associated with biological processes such as habitat fragmentation, reduced effective population size, restricted gene flow, and mating among related individuals
| [34] | Hamrick J L & Godt MJW (1996). Effects of life history traits on genetic diversity in plant species. Philosophical Transactions of the Royal Society of London. Series B: Biological Sciences, 351(1345), 1291-1298.
https://doi.org/10.1098/rstb.1996.0112 |
| [35] | Holland B (2004). Ecological Genetics: Design, Analysis, and Application by Andrew Lowe, Stephen Harris & Paul Ashton (2004), xi + 326 pp., Blackwell Publishing, Oxford, UK. Oryx, 38(4), 466-466.
https://doi.org/10.1017/S0030605304260860 |
[34, 35]
. These mechanisms are plausible in
K. senegalensis, whose natural populations have undergone extensive logging and fragmentation across much of West Africa. However, because the present samples consisted of maternal progenies originating from mother trees within the same research station, these broader population-level mechanisms cannot be inferred directly from the present data. The biological interpretation of these results should be treated with caution because methodological factors may also have contributed to the observed heterozygote deficiency. The analyses indicated relatively high frequencies of putative null alleles (>0.20 for most loci; data not shown), particularly at Sm12, where estimated frequencies ranged from 0.32 to 0.89 among maternal progenies. The absence of heterozygotes at this locus (Ho = 0.00; F
IS = 1.00) is consistent with the possibility of allelic dropout caused by mutations in primer-binding sites. Such mismatches are a recognized limitation of cross-species SSR transfer, where sequence divergence between the source species (
Swietenia macrophylla) and the target species (
K. senegalensis) can reduce primer annealing efficiency. Nevertheless, the presence of putative null alleles does not by itself demonstrate that allelic dropout occurred, and this possibility should therefore be considered as a potential methodological explanation rather than a confirmed cause.
Genotyping methodology may have further contributed to the observed pattern. Unlike fluorescent capillary electrophoresis, agarose gel electrophoresis provides limited resolution for microsatellite alleles differing by only a few base pairs. Consequently, closely sized alleles may not be distinguished reliably, increasing the likelihood of scoring heterozygotes as homozygotes and thereby reducing observed heterozygosity while inflating fixation indices. This limitation is particularly relevant when allele sizes differ by only a few base pairs and may have contributed to the low Ho values observed in the present study.
Taken together, these results suggest that the high fixation indices likely reflect a combination of biological processes and methodological factors, although their relative contributions cannot be separated with the present dataset. Although population fragmentation and restricted gene flow may have increased homozygosity, the contribution of null alleles and limited marker resolution cannot be overlooked. Because these factors can also bias estimates of population differentiation, the reported FST values may be affected by the presence of null alleles and potential allele-scoring errors. In particular, null alleles can lead to an upward bias in estimates of genetic differentiation, so the FST values should be interpreted cautiously and should not be considered definitive estimates of differentiation or gene flow without further validation.
Future studies using additional species-specific SSR markers or higher-resolution genotyping platforms, such as fluorescent capillary electrophoresis or SNP-based approaches, would help to distinguish biological processes from methodological artefacts and provide more robust estimates of heterozygosity, genetic differentiation, and gene flow in K. senegalensis. Such approaches would also allow the potential effects of null alleles and allele-size misclassification to be assessed more directly.
4.3. Genetic Differentiation and Effects of Habitat Fragmentation
Before interpreting the estimates of genetic differentiation, it is important to consider the sampling design adopted in this study. The six groups analyzed represent maternal progenies derived from six mother trees sampled within a single natural stand in Lataha (northern Côte d'Ivoire), rather than geographically distinct populations spanning the natural distribution of Khaya senegalensis. Consequently, the observed genetic differentiation reflects genetic variation among maternal progenies within a local stand rather than broad-scale population structure. Despite this local sampling scale, the maternal progenies provide valuable insights into the genetic diversity maintained within the stand and constitute an important genetic resource for conservation, seed collection, and future tree improvement programs.
The SSR data revealed measurable genetic differentiation among the maternal progenies of Khaya senegalensis, as evidenced by the relatively high FST and PhiPT estimates and the corresponding estimates of gene flow. Although most of the genetic variation was maintained within progenies, the significant proportion of variation among progenies indicates genetic differentiation at the scale of the sampled stand.
In tropical forest trees, high levels of gene flow mediated by pollen and seed dispersal generally reduce genetic differentiation among populations
| [34] | Hamrick J L & Godt MJW (1996). Effects of life history traits on genetic diversity in plant species. Philosophical Transactions of the Royal Society of London. Series B: Biological Sciences, 351(1345), 1291-1298.
https://doi.org/10.1098/rstb.1996.0112 |
[34]
. Conversely, limited pollen or seed dispersal, spatially restricted mating, and reduced reproductive connectivity can contribute to localized genetic differentiation through increased genetic drift. Habitat fragmentation may further restrict gene exchange when populations become spatially isolated; however, this mechanism cannot be directly evaluated from the present sampling design because all maternal progenies were sampled within a single natural stand.
The genetic differentiation observed in the present study may therefore reflect the combined influence of reproductive biology, spatially restricted pollen or seed dispersal, localized mating patterns, and historical demographic processes affecting K. senegalensis. Although the historical fragmentation of West African forests associated with logging and land-use change may have contributed to the broader demographic history of the species, the present data do not provide direct evidence that habitat fragmentation caused the observed differentiation among the sampled maternal progenies.
Because the sampling was based on maternal progenies within a single natural stand rather than geographically distant populations, the detected differentiation most likely reflects fine-scale spatial genetic structure and localized mating patterns. Such patterns have been reported in many tropical tree species, where limited pollen and seed dispersal can increase relatedness among neighboring individuals and generate significant genetic structure even at local spatial scales. Comparable trends have been described in other African Meliaceae. Bouka et al.
| [31] | Sexton GJ, Frere CH, Kalinganire A, Uwamariya A, Lowe AJ, Godwin ID, Prentis PJ, Dieters MJ (2015b) Influence of putative forest refugia and biogeographic barriers on genetic variation in Khaya senegalensis. Tree Genetics & Genomes, 11, 103.
https://doi.org/10.1007/s11295-015-0933-3 |
[31]
, for example, reported pronounced genetic differentiation among
Khaya ivorensis populations, highlighting the contribution of historical biogeographic processes and restricted gene flow to the genetic structure of the genus. However, because the study by Bouka et al. involved geographically distinct populations, its results are not directly comparable in spatial scale to the present study. Nevertheless, together with the present findings, these studies indicate that both historical and contemporary processes may contribute to the distribution of genetic diversity in
Khaya species.
Nevertheless, the magnitude of genetic differentiation should be interpreted cautiously because the relatively high frequencies of putative null alleles and the use of heterologous SSR markers may have inflated estimates of homozygosity and, consequently, FST. Since gene flow (Nm) is inferred from genetic differentiation, its magnitude may also be affected by potential upward bias in FST. Additional studies based on species-specific SSR markers or high-resolution SNP genotyping would therefore be valuable to validate these estimates and better quantify genetic connectivity and contemporary gene flow.
From a conservation perspective, the predominance of within-progeny genetic variation indicates that each maternal progeny contributes to the genetic diversity represented in the sampled stand. At the same time, the significant differentiation among progenies emphasizes the need to sample seeds from multiple maternal trees to maximize genetic representation in conservation, restoration, and breeding programs for K. senegalensis.
4.4. Integration of Molecular and Morphological Diversity for Conservation
The combined analysis of molecular and morphological data
| [36] | Gbotto AA, Yao GAK, Akaza JM, Junior AE, Gore BBN & Akaffou SD (2026). Growth and Development Dynamics Among Khaya senegalensis Progenies in Côte d’Ivoire. American Journal of Life Sciences, 14(3), 60-69.
https://doi.org/10.11648/j.ajls.20261403.11 |
[36]
revealed partial congruence between genetic structure and phenotypic differentiation among the six maternal progenies of
Khaya senegalensis. Both approaches consistently identified three major groups, although Gen5 showed contrasting assignments: it clustered with Gen1-Gen2 based on growth traits but grouped with Gen6 according to the SSR analyses. This discrepancy indicates that morphological differentiation does not entirely reflect the neutral genetic structure of the studied progenies. However, the correspondence between the two approaches should be interpreted cautiously, as the three groups identified by STRUCTURE represent inferred genetic ancestry components within the sampled material rather than geographically isolated populations. The concordance observed for the Gen1-Gen2 and Gen3-Gen4 groups suggests that some of the observed phenotypic differentiation may be associated with underlying genetic differences. In contrast, the different placement of Gen5 highlights the well-recognized distinction between neutral molecular variation and adaptive phenotypic traits. Microsatellite markers primarily capture demographic history, gene flow, and genetic drift, whereas growth-related traits are typically quantitative, controlled by multiple genes, and influenced by environmental conditions and phenotypic plasticity. Consequently, genetically similar progenies may express contrasting phenotypes, while morphologically similar individuals may differ at neutral loci. Therefore, the observed correspondence between molecular and morphological groupings should not be interpreted as direct evidence that the measured growth traits are controlled by the neutral genetic variation detected by the SSR markers.
Similar discrepancies between neutral genetic structure and phenotypic variation have been reported in several tropical tree species, including
Swietenia macrophylla | [19] | Lemes MR, Esashika T, Gaoue OG (2011). Microsatellites for mahoganies: twelve new loci for Swietenia macrophylla and its high transferability to Khaya senegalensis. American Journal of Botany, 98(8), e207-9. https://doi.org/10.3732/ajb.1100074 |
[19]
, emphasizing that neutral markers alone cannot fully capture adaptive variation. This morpho-molecular divergence may stem from environmental plasticity, localized natural selection acting on adaptive growth traits undetected by neutral SSRs, or genetic effects involving genomic regions that are not adequately represented by the neutral SSR markers used in this study. Integrating molecular and phenotypic information therefore provides a more comprehensive assessment of forest genetic resources by combining estimates of neutral genetic diversity with traits of potential adaptive and silvicultural importance. From a conservation perspective, these findings highlight the importance of preserving both genetic diversity and phenotypic variability. While the genetic differentiation detected among maternal progenies should be considered when designing conservation strategies, particularly to maintain the observed breadth of genetic variation, progenies exhibiting superior growth performance, such as Gen6, may represent valuable sources of reproductive material for restoration, domestication, and tree improvement programs. Nevertheless, the superior growth observed in Gen6 should not, on the basis of the present data alone, be interpreted as evidence of greater adaptive value, and its potential use as a source of reproductive material should be evaluated through additional multi-environment and/or common-garden assessments. More broadly, combining neutral molecular markers with phenotypic evaluation provides a more informative framework for the sustainable conservation and utilization of
K. senegalensis genetic resources.
4.5. Conservation Implications of Genetic Diversity Patterns in Khaya Senegalensis
The genetic patterns observed in this study have important implications for the conservation and sustainable management of Khaya senegalensis. The predominance of genetic variation within maternal progenies indicates that substantial genetic diversity is maintained among individuals within the sampled maternal progenies, while the significant differentiation among progenies highlights the value of maintaining multiple maternal sources. Conservation and seed-collection programs should therefore avoid relying on a small number of mother trees and instead include multiple maternal sources to maximize the representation of existing genetic variation. The contrasting molecular and morphological patterns further suggest that conservation strategies should consider both neutral genetic diversity and phenotypic variation. In particular, progenies exhibiting superior growth performance, such as Gen6, may be of interest for restoration and breeding, but their use should be balanced with the conservation of genetically differentiated maternal sources. However, the superior growth performance observed in Gen6 should not be interpreted as evidence of greater genetic diversity or adaptive superiority, because the SSR markers used in this study primarily provide information on neutral genetic variation. Moreover, the STRUCTURE analysis identified genetic ancestry components within the sampled material rather than geographically isolated populations, since all individuals originated from maternal progenies established from mother trees within the same research station/stand. Given the potential influence of null alleles on the present estimates, these recommendations should be further validated using species-specific markers or higher-resolution genomic approaches. Integrating genetic, phenotypic, and ecological information would provide a stronger basis for conserving the evolutionary potential of K. senegalensis and supporting its long-term restoration and sustainable utilization.
5. Conclusion
This study demonstrates the usefulness of heterologous microsatellite markers transferred from Swietenia macrophylla for characterizing genetic diversity in Khaya senegalensis. The SSR markers revealed substantial allelic diversity and identified three main genetic groups among the six maternal progenies, while AMOVA indicated that most genetic variation was maintained within progenies. At the same time, the significant differentiation among maternal progenies and the relatively low estimated gene flow suggest restricted genetic exchange at the scale of the studied stand. Because the SSR markers used in this study are considered neutral markers and all sampled individuals originated from a single natural stand, these patterns should be interpreted as evidence of neutral genetic structure rather than as evidence of adaptive differentiation among progenies. The pronounced heterozygote deficiency should, however, be interpreted with caution, as the high frequencies of putative null alleles detected may have contributed to inflated estimates of homozygosity and fixation. Thus, both biological processes and methodological effects are likely to have influenced the observed patterns of genetic structure. The comparison between neutral molecular variation and previously documented morphological traits further revealed only partial correspondence between genetic clustering and growth performance. In particular, the grouping of Gen5 and Gen6 based on SSR markers, despite their contrasting phenotypic characteristics, highlights the complementary nature of molecular and morphological assessments. Importantly, the observed correspondence between genetic clusters and phenotypic variation should not be interpreted as evidence that any molecular cluster or maternal progeny possesses superior growth performance, adaptive differentiation, or greater breeding value. Neutral SSR markers provide valuable information on genetic structure and diversity but may not fully capture the genetic basis of quantitative and potentially adaptive traits. Therefore, the present molecular data cannot be used to infer the adaptive significance or genetic basis of the observed differences in growth-related traits. Overall, these findings provide a preliminary characterization of neutral genetic diversity and structure in the sampled K. senegalensis material and support the complementary use of molecular and phenotypic information in conservation research. Sampling multiple maternal sources and, ideally, multiple natural stands will be important for obtaining a more comprehensive representation of genetic diversity in K. senegalensis. Further validation using species-specific markers and higher-resolution genomic approaches, combined with broader geographic sampling and appropriate phenotypic or common-garden studies, would be required to investigate adaptive differentiation, genetic connectivity, and the genetic basis of growth-related traits. Such an integrative framework could provide a stronger scientific basis for future conservation, restoration, and breeding research for this economically and ecologically important species.
Limitations of the study
Several methodological limitations should be considered when interpreting the genetic estimates obtained in this study. First, the use of heterologous microsatellite primers originally developed for Swietenia macrophylla may have introduced genotyping bias. The relatively high frequencies of putative null alleles detected, reaching 0.89 at Sm12, suggest that some heterozygotes may have been misclassified as homozygotes because of allelic dropout. This effect may partly explain the pronounced heterozygote deficiency observed in the dataset.
Second, genotype scoring based on agarose gel electrophoresis may have limited the resolution of closely sized microsatellite alleles. Alleles differing by only a few base pairs may not have been reliably distinguished, potentially resulting in underestimation of observed heterozygosity and overestimation of fixation and differentiation indices. Consequently, the estimates of Ho, FIS, FST, and gene flow should be interpreted with caution.
Finally, the use of neutral SSR markers provides limited information on adaptive genetic variation, particularly for quantitative traits such as growth and development. In addition, the sampling of maternal progenies from a single natural stand restricts the extent to which the results can be extrapolated to population structure and gene flow across the broader distribution range of K. senegalensis in Côte d'Ivoire. Future studies incorporating species-specific SSR markers or high-resolution genomic approaches, together with geographically broader sampling, would help provide more robust estimates of genetic diversity, differentiation, connectivity, and adaptive variation in the species.
Abbreviations
AMOVA | Analysis of Molecular Variance |
CTAB | Cetyltrimethylammonium Bromide |
EDTA | EthyleneDiamine Tetraacetic Acid |
FAO | Food and Agriculture Organization |
FIS | Fixation Index Within Populations |
FIT | Fixation Index in the Total Population |
FST | Fixation Index Among Subpopulations |
He | Expected Heterozygosity |
Ho | Observed Heterozygosity |
I | Shannon Diversity Index |
M | Molaire |
mM | Millimolaire |
μL | Microlitre |
μM | Micromolaire |
NaCl | Sodium Chloride |
PCoA | Principal Coordinates Analysis |
PIC | Polymorphism Information Content |
PVP | Polyvinylpyrrolidone |
QTL | Quantitative Traits Loci |
RNase | Ribonuclease |
SSR | Simple Sequence Repeat |
TAE | Tris-Acétate-EDTA |
TE | Tampon Tris-EDTA |
tpm | Tours Par Minute |
Tris | Tris (Hydroxyméthyl) Aminométhane |
IUCN | International Union for Conservation of Nature |
Acknowledgments
This study was partially supported by the Biochemistry Undergraduate Research and Training Program (BURT-P), Raleigh, NC, USA. The authors gratefully acknowledge the Fulbright Visiting Scholar Program, funded by the U.S. Department of State, Bureau of Educational and Cultural Affairs, for providing the opportunity to conduct this research abroad. The authors also express their heartfelt gratitude to José Trinidad Ascencio-Ibáñez for hosting this research in his laboratory at the Department of Molecular and Structural Biochemistry, North Carolina State University, Raleigh, NC, USA.
Author Contributions
Anique Ahou Gbotto: Conceptualization, Data curation, Formal Analysis, Investigation, Methodology, Resources, Software, Validation, Visualization, Writing – original draft, Writing – review & editing
Ella Konan N’Dri: Conceptualization, Data curation, Writing – original draft, Writing – review & editing
Olivier Any Komenan: Conceptualization, Data curation, Formal Analysis, Methodology
Georges Abéssika Kouakou Yao: Methodology, Resources, Software, Supervision, Visualization
Kadio Gnigouan Guy Rolland Anzara: Investigation, Methodology, Resources, Writing – original draft
José Trinidad Ascencio-Ibáñez: Funding acquisition, Supervision, Writing – review & editing
Selastique Doffou Akaffou: Conceptualization, Funding acquisition, Investigation, Methodology, Project administration, Supervision
Conflicts of Interest
The authors declare no conflicts of interest.
References
| [1] |
Hunter ME, da Silva JM, Mastretta-Yanes A, & Hoban SM (2024). A new era of genetic diversity conservation through novel tools and accessible data. Frontiers in Ecology and the Environment, 22, 740.
https://doi.org/10.1002/fee.2740
|
| [2] |
Milesi P, Kastally C, Dauphin B, Milesi P, Kastally C, Dauphin B, Cervantes S, Bagnoli F, Budde KB, Cavers S, Fady B, Faivre-Rampant P, González-Martínez SC, Grivet D, Gugerli F, Jorge V, Kupin IL, Ojeda DI, Olsson S, Opgenoorth L, Pinosio S, Plomion C, Rellstab C, Rogier O, Scalabrin S, Scotti I, Vendramin GG, Westergren M, Lascoux M, Pyhäjärvi T (2024). Resilience of genetic diversity in forest trees over the Quaternary. Nature Communications 15, 8538.
https://doi.org/10.1038/s41467-024-52612-y
|
| [3] |
Konrad H, George JP, Szukala A (2025). The state of forest genetic diversity: anthropogenic impacts and conservation initiatives. In: Lapin K, Oettel J, Braun M, Konrad H (eds) Ecological Connectivity of Forest Ecosystems. Springer, Cham. pp 55-89.
https://doi.org/10.1007/978-3-031-82206-3_4
|
| [4] |
Food and Agriculture Organization of the United Nations (FAO). 2025. The Second Report on the State of the World’s Forest Genetic Resources. Rome.
https://doi.org/10.4060/cd4838en
|
| [5] |
Sebbenn A. (2011). Effects of forest fragmentation on the effective and realized gene flow of Neotropical tree species: implications for genetic conservation. BMC Proceedings, 5 (Suppl 7): 06.
https://doi.org/10.1186/1753-6561-5-S7-O6
|
| [6] |
Olatunji TL, Odebunmi CA & Adetunji AE (2021). Biological activities of limonoids in the Genus Khaya (Meliaceae): a review. Future Journal of Pharmaceutical Sciences, 7, 74.
https://doi.org/10.1186/s43094-021-00197-4
|
| [7] |
Feraz Filho AC, Ribeiro A, Bouka GUD, Junior MF, Gilberto MT (2021). African Mahogany Plantation Highlights in Brazil. Floresta e Ambiente. 28 (3), e20200081.
https://doi.org/10.1590/2179-8087-FLORAM-2020-0081
|
| [8] |
Pinheiro AL, Couto L, Pinheiro DT, Brunetta JMFC (2011). Ecologia, silvicultura e tecnologia de utilização dos mognos-africanos (Khaya spp.). 1. ed. Viçosa: Sociedade Brasileira de Agrossilvicultura, Produqao Independente, Viqosa, 102pp.
|
| [9] |
Momolli DR, Caldeira MVW, Gomes GSL, Gomes R, Duarte VBR, Godinho TDO, da Silva JGM, dos Santos VB, Vidaurre GB, Faria JCT, et al (2024). Stem longitudinal gradient for basic density, Carbon, Nitrogen, and CN ratio in Khaya spp.: improved correlation using diameter instead of commercial height. Forests, 15, 1923.
https://doi.org/10.3390/f15111923
|
| [10] |
Houehanou B & Gaoue OG (2025). Proximity to forests, fire and plantation characteristics influence understory plant species richness more than phylogenetic diversity in African mahogany plantations. Scientific Reports 15, 31422.
https://doi.org/10.1038/s41598-025-03104-6
|
| [11] |
Langa AM, Padonou EA, Akabassi GC, Akakpo BA & Assogbadjo AE (2024). Diversity and Structure of Khaya Senegalensis (desr.) A. Juss Habitats Along Phytogeographical Zones in Chad (Central Africa): Implications for Conservation and Sustainable Use. Journal of Environmental Geography, 17, 45-56.
https://doi.org/10.14232/jengeo-2024-45530
|
| [12] |
Amekpo KS, Dourma M, Lamboni P, Batawila, K, & Akpagana, K (2025). Usage, disponibilité et étude de la vulnérabilité de Khaya senegalensis (Desr.) A. Juss chez les populations riveraines de la Reserve de Faune d’Alédjo au Togo [Use, availability and study of the vulnerability of Khaya senegalensis (Desr.) A. Juss in the riverine populations of the Alédjo Wildlife Reserve in Togo]. Revue Ecosystèmes Et Paysages, 5(2),
https://doi.org/10.59384/recopays.tg.v5i2.171
|
| [13] |
Sexton GJ Frere CH, Dieters MJ, Godwin ID, Prentis PJ (2010). Development and characterization of microsatellite loci for Khaya senegalensis (Meliaceae). American Journal of Botany, 97(11), e111-e113.
https://doi.org/10.3732/ajb.1000300
|
| [14] |
Karan M, Evans DS, Reilly D, Schulte K, Wright C, Innes D, Holton TA, Nikles DG & Dickinson GR (2012). Rapid microsatellite marker development for African mahogany (Khaya senegalensis) using next-generation sequencing. Molecular Ecology Resources, 12(2), 344-353.
https://doi.org/10.1111/j.1755-0998.2011.03080.x
|
| [15] |
Sexton JP, Hangartner SB, Hoffmann AA (2015a). Genetic isolation by environment or distance: Which pattern of gene flow is most common? Evolution, 68(1), 1-15.
https://doi.org/10.1111/evo.12258
|
| [16] |
Kalia RK, Rai MK, Kalia S, Singh R, & Dhawan AK (2011). Microsatellite markers: An overview of the recent progress in plants. Euphytica, 177(3), 309-334.
https://doi.org/10.1007/s10681-010-0286-9
|
| [17] |
Vieira M. L. C., Santini L., Diniz A. L., & Munhoz C. F. (2016). Microsatellite markers: What they mean and why they are so useful. Genetics and Molecular Biology, 39(3), 312-328.
https://doi.org/10.1590/1678-4685-GMB-2016-0027
|
| [18] |
Murray H. G. and Thompson W. F. (1980) Rapid isolation of high molecular weight DNA. Nucleic Acids Research, 8, 4321-4325.
http://dx.doi.org/10.1093/nar/8.19.4321
|
| [19] |
Lemes MR, Esashika T, Gaoue OG (2011). Microsatellites for mahoganies: twelve new loci for Swietenia macrophylla and its high transferability to Khaya senegalensis. American Journal of Botany, 98(8), e207-9.
https://doi.org/10.3732/ajb.1100074
|
| [20] |
Guo X, Elston RC (1999). Linkage information content of polymorphic genetic markers. Human Heredity, 49(2), 112-8.
https://doi.org/10.1159/000022855
|
| [21] |
Wright S (1965). The interpretation of population structure by F-statistics with special regard to systems of mating. Evolution, 19, 395-420.
https://doi.org/10.1111/j.1558-5646.1965.tb01731.x
|
| [22] |
Weir BS & Cockerham CC (1984). Estimating F-statistics for the analysis of population structure. Evolution 38 (6), 1358-1370.
https://doi.org/10.2307/2408641
|
| [23] |
Excoffier L, Smouse PE & Quattro JM (1992). Analysis of molecular variance inferred from metric distances among DNA Haplotypes: Application to human mitochondrial DNA restriction data. Genetics 131, 479-491.
https://doi.org/10.1093/genetics/131.2.479
|
| [24] |
Peakall R and Smouse PE (2012). GenAlEx 6.5: Genetic Analysis in Excel. Population Genetic Software for Teaching and Research-An Update. Bioinformatics Application Note, 28, 2537-2539.
http://dx.doi.org/10.1093/bioinformatics/bts460
|
| [25] |
Pritchard JK, Stephens M, Donnelly P (2000). Inference of population structure using multilocus genotype data. Genetics, 155(2), 945-59.
https://doi.org/10.1093/genetics/155.2.945
|
| [26] |
Saitou N & Nei M (1987). The Neighbor-Joining Method: A New Method for Reconstructing Phylogenetic Trees. Molecular Biology and Evolution, 4, 406-425.
https://doi.org/10.1093/oxfordjournals.molbev.a040454
|
| [27] |
Nei M. (1972). Genetic Distance between Populations. The American Naturalist, 106(949), 283-292.
https://doi.org/10.1086/282771
|
| [28] |
Felsenstein J (1989). PHYLIP-Phylogeny inference package (Version 3.2). Cladistics, 5, 164-166.
https://ci.nii.ac.jp/naid/10003763325
|
| [29] |
Rambaut A. (2016). FigTree v1.4.3: Tree Figure Drawing Tool. Institute of Evolutionary Biology, University of Edinburgh. Available at:
http://tree.bio.ed.ac.uk/software/figtree/
|
| [30] |
Frankham R, Ballou JD, Briscoe DA (2010). Introduction to Conservation Genetics (2nd edition). Cambridge University Press, Cambridge.
http://dx.doi.org/10.1017/CBO9780511809002
|
| [31] |
Sexton GJ, Frere CH, Kalinganire A, Uwamariya A, Lowe AJ, Godwin ID, Prentis PJ, Dieters MJ (2015b) Influence of putative forest refugia and biogeographic barriers on genetic variation in Khaya senegalensis. Tree Genetics & Genomes, 11, 103.
https://doi.org/10.1007/s11295-015-0933-3
|
| [32] |
Bouka-Dipelet UG, Doumenge C, Ekué MRM, Duminil J, Florence J, Degen B, Loumeto J-J, McKey DB & Hardy OJ (2024). Genetic differentiation in Khaya ivorensis A. Chev., a threaten tree of evergreen African rainforests. Tree Genetics & Genomes, 20(6), 41, 14 p.
https://doi.org/10.1007/s11295-024-01676-4
|
| [33] |
Botstein D, White RL, Skolnick M & Davis RW (1980). Construction of a genetic linkage map in man using restriction fragment length polymorphisms. American Journal of Human Genetics, 32, 314-331.
|
| [34] |
Hamrick J L & Godt MJW (1996). Effects of life history traits on genetic diversity in plant species. Philosophical Transactions of the Royal Society of London. Series B: Biological Sciences, 351(1345), 1291-1298.
https://doi.org/10.1098/rstb.1996.0112
|
| [35] |
Holland B (2004). Ecological Genetics: Design, Analysis, and Application by Andrew Lowe, Stephen Harris & Paul Ashton (2004), xi + 326 pp., Blackwell Publishing, Oxford, UK. Oryx, 38(4), 466-466.
https://doi.org/10.1017/S0030605304260860
|
| [36] |
Gbotto AA, Yao GAK, Akaza JM, Junior AE, Gore BBN & Akaffou SD (2026). Growth and Development Dynamics Among Khaya senegalensis Progenies in Côte d’Ivoire. American Journal of Life Sciences, 14(3), 60-69.
https://doi.org/10.11648/j.ajls.20261403.11
|
Cite This Article
-
APA Style
Gbotto, A. A., N’Dri, E. K., Komenan, O. A., Yao, G. A. K., Anzara, K. G. G. R., et al. (2026). Microsatellite-based Assessment of Genetic Diversity and Differentiation Among Maternal Progenies of Khaya Senegalensis in Northern Côte d'Ivoire. Biochemistry and Molecular Biology, 11(4), 80-95. https://doi.org/10.11648/j.bmb.20261104.12
 Copy
|
 Download
ACS Style
Gbotto, A. A.; N’Dri, E. K.; Komenan, O. A.; Yao, G. A. K.; Anzara, K. G. G. R., et al. Microsatellite-based Assessment of Genetic Diversity and Differentiation Among Maternal Progenies of Khaya Senegalensis in Northern Côte d'Ivoire. Biochem. Mol. Biol. 2026, 11(4), 80-95. doi: 10.11648/j.bmb.20261104.12
Copy
|
Download
AMA Style
Gbotto AA, N’Dri EK, Komenan OA, Yao GAK, Anzara KGGR, et al. Microsatellite-based Assessment of Genetic Diversity and Differentiation Among Maternal Progenies of Khaya Senegalensis in Northern Côte d'Ivoire. Biochem Mol Biol. 2026;11(4):80-95. doi: 10.11648/j.bmb.20261104.12
Copy
|
Download
-
@article{10.11648/j.bmb.20261104.12,
  author = {Anique Ahou Gbotto and Ella Konan N’Dri and Olivier Any Komenan and Georges Abéssika Kouakou Yao and Kadio Gnigouan Guy Rolland Anzara and José Trinidad Ascencio-Ibáñez and Selastique Doffou Akaffou},
  title = {Microsatellite-based Assessment of Genetic Diversity and Differentiation Among Maternal Progenies of Khaya Senegalensis in Northern Côte d'Ivoire},
  journal = {Biochemistry and Molecular Biology},
  volume = {11},
  number = {4},
  pages = {80-95},
  doi = {10.11648/j.bmb.20261104.12},
  url = {https://doi.org/10.11648/j.bmb.20261104.12},
  eprint = {https://article.sciencepublishinggroup.com/pdf/10.11648.j.bmb.20261104.12},
  abstract = {Khaya senegalensis is an emblematic African mahogany species of the Sudanian and Sahelian regions that is increasingly threatened by overexploitation and habitat fragmentation. This study assessed the genetic diversity and structure of six maternal progenies derived from a natural stand of K. senegalensis in northern Côte d'Ivoire using microsatellite (SSR) markers, including eight loci transferred from Swietenia macrophylla and one species-specific locus. Sixty individuals were successfully genotyped. The SSR markers revealed a relatively high level of expected genetic diversity (He = 0.54; mean PIC = 0.78), but a pronounced deficit of observed heterozygosity (Ho = 0.12). Genetic differentiation among maternal progenies was high (FST = 0.31), whereas the estimated gene flow was limited (Nm = 0.73), suggesting restricted genetic connectivity within the studied stand. High null allele frequencies, particularly at locus Sm12 (up to 0.89), indicate that part of the observed homozygote excess and elevated fixation index (FIS = 0.75) may be attributable to technical amplification bias associated with the transfer of heterologous SSR markers. Bayesian clustering and Neighbor-Joining analysis consistently identified three genetic clusters, a pattern further supported by AMOVA, which attributed 30% of the total genetic variation to differences among maternal progenies and 70% to variation within progenies. These findings highlight the need for species-specific markers and provide valuable information for the seed selection, conservation, and sustainable management of this economically important African timber species.},
 year = {2026}
}
Copy
|
Download
-
TY  - JOUR
T1  - Microsatellite-based Assessment of Genetic Diversity and Differentiation Among Maternal Progenies of Khaya Senegalensis in Northern Côte d'Ivoire
AU  - Anique Ahou Gbotto
AU  - Ella Konan N’Dri
AU  - Olivier Any Komenan
AU  - Georges Abéssika Kouakou Yao
AU  - Kadio Gnigouan Guy Rolland Anzara
AU  - José Trinidad Ascencio-Ibáñez
AU  - Selastique Doffou Akaffou
Y1  - 2026/11/14
PY  - 2026
N1  - https://doi.org/10.11648/j.bmb.20261104.12
DO  - 10.11648/j.bmb.20261104.12
T2  - Biochemistry and Molecular Biology
JF  - Biochemistry and Molecular Biology
JO  - Biochemistry and Molecular Biology
SP  - 80
EP  - 95
PB  - Science Publishing Group
SN  - 2575-5048
UR  - https://doi.org/10.11648/j.bmb.20261104.12
AB  - Khaya senegalensis is an emblematic African mahogany species of the Sudanian and Sahelian regions that is increasingly threatened by overexploitation and habitat fragmentation. This study assessed the genetic diversity and structure of six maternal progenies derived from a natural stand of K. senegalensis in northern Côte d'Ivoire using microsatellite (SSR) markers, including eight loci transferred from Swietenia macrophylla and one species-specific locus. Sixty individuals were successfully genotyped. The SSR markers revealed a relatively high level of expected genetic diversity (He = 0.54; mean PIC = 0.78), but a pronounced deficit of observed heterozygosity (Ho = 0.12). Genetic differentiation among maternal progenies was high (FST = 0.31), whereas the estimated gene flow was limited (Nm = 0.73), suggesting restricted genetic connectivity within the studied stand. High null allele frequencies, particularly at locus Sm12 (up to 0.89), indicate that part of the observed homozygote excess and elevated fixation index (FIS = 0.75) may be attributable to technical amplification bias associated with the transfer of heterologous SSR markers. Bayesian clustering and Neighbor-Joining analysis consistently identified three genetic clusters, a pattern further supported by AMOVA, which attributed 30% of the total genetic variation to differences among maternal progenies and 70% to variation within progenies. These findings highlight the need for species-specific markers and provide valuable information for the seed selection, conservation, and sustainable management of this economically important African timber species.
VL  - 11
IS  - 4
ER  -
Copy
|
Download

 ,
Ella Konan N’Dri
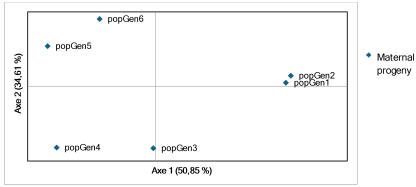
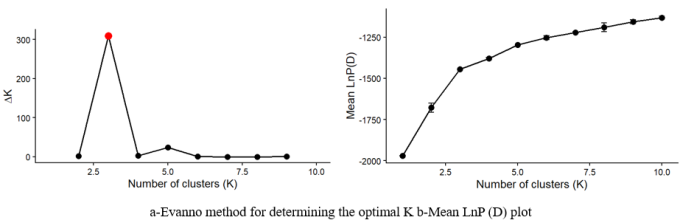

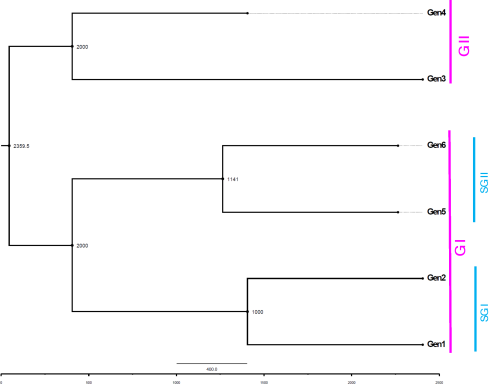



 Share This Article
 Twitter
 Linked In
 Facebook