3. Method
3.1. Activation of Adsorbent
The calcined periwinkle shell char (PSC) and oyster shell char (OSC) were sieved to a particle size of 150 μm using standard test sieves after the calcination process. Subsequently, 50 g each of PSC and OSC were chemically activated with 1.0 M hydrochloric acid (HCl) solution. Each sample was separately added to 500 mL of 1.0 M HCl in a 1000 mL Erlenmeyer flask and heated to 60°C under continuous magnetic stirring for 12 hours. This acid activation step enhances the surface charge, porosity, and functional group availability of the adsorbents, improving their affinity for zinc ions. The resulting suspensions were allowed to cool to room temperature, then filtered using filter paper. The activated PSC and OSC were oven-dried at 105°C for 24 hours and stored in airtight containers for subsequent use.
3.2. Characterization of Adsorbent Produced from PSC and OSC
A Solar Thermo Elemental Atomic Absorption Spectrophotometer (Flame AAS) was used to assess the percentage of calcium (Ca) and other pertinent metals in the activated periwinkle shell char (PSC) and oyster shell char (OSC). The functional groups on the surface of both adsorbents were identified using Fourier Transform Infrared Spectroscopy (FTIR) before and after adsorption. The water sample was analyzed for initial zinc ion concentration using an Atomic Absorption Spectrophotometer (AAS) at a wavelength of 213.9 nm.
3.3. Physical Properties of Adsorbent
Adsorbents produced were physically characterized in order to be categorized to ascertain their physical properties. The following physical properties were measured; bulk density, moisture content, pore volume, and porosity of both PSC and OSC.
3.3.1. Bulk Density Determination
Using the method described by Abel et al.
| [10] | Abel, U., Ekanem, O., Oseribho, O., Isotuk, U., Job, A., & Ibanga, I. (2024). Enhanced Hydrophobicity and Oleophilicity of Modified Activated Carbons Derived from Agro-Wastes Biomass for the Removal of Crude Oil from Aqueous Medium. American Journal of Chemical Engineering, 12(4), 80-96.
https://doi.org/10.11648/j.ajche.20241204.11 |
[10]
, the bulk density of periwinkle shell char and oyster shell char was calculated by dividing the mass by the volume occupied. 10ml of distilled water (volume of water) were added to a measuring cylinder after 2g of the sample had been weighed. It was noted how much water was displaced. Equation (
1) was used to determine the bulk density.
(1)
3.3.2. Moisture Content Determination
The standard procedure outlined in ASTM D2016-25 was used to determine the moisture content of each PSC and OSC. 2g of the initial weight (W
i) of the sample were dried for 1.5 hours at 105°C in an oven. The sample's weight was measured often until it stabilized, at that point it was noted as the final weight (W
f)
| [11] | Adepoju, T., Job, A. I., & Isotuk, U. R. (2016). Optimization of Biohydrogen Production (BHP) from Agro Waste Water (Cassava Waste Water): A Case of Box-Behnken Response Surface Methodology (RSM). International Journal of Energy and Environmental Science, 1(1), 13.
https://doi.org/10.11648/j.ijees.20160101.13 |
[11]
. Equation (
2) was used to determine the moisture content.
Where: X0 = moisture content on wet basis, Wi = initial weight of the material before it has undergo drying, Wf = final weight of the material after undergoing drying.
3.3.3. Pore Volume and Porosity Determination
The method described by Noella et al.
| [12] | Noella, A., Emmanuel, P. A., & Marcel, N. R. (2025). Effect of the granulometry and proportions of maize and cassava flours on the techno-functional and sensory properties of composite couscous-like product. Applied Food Research, 5(2), 101113. https://doi.org/10.1016/j.afres.2025.101113 |
[12]
was used to calculate the pore volume and porosity of PSC and OSC. A 10 mL measuring cylinder was filled with 2g of each sample after it had been weighed (w
i). The total volume of particles was calculated using the volume obtained after packing. To release trapped air, the sample was then transferred to a beaker with 20 mL of distilled water and heated for 5min. After filtering and superficial drying, the material was weighed (w
f). Equation (
3) was used to determine the pore volume.
(3)
Where: wi = initial weight of sample, wf = final weight of sample, ρ (H
2O) = density of water. The porosity of each sample was calculated using equation (
4).
(4)
3.3.4. Surface Area Determination
The specific surface area (SSA) was calculated using equation (
5)
| [13] | Yan, F., Tuller, M., De Jonge, L. W., Moldrup, P., & Arthur, E. (2023). Specific surface area of soils with different clay mineralogy can be estimated from a single hygroscopic water content. Geoderma, 438, 116614.
https://doi.org/10.1016/j.geoderma.2023.116614 |
[13]
.
Where: SSA = specific surface area of adsorbent; qm = maximum adsorption capacity on mono-layer surface; NA = Avogadro’s number = 6.02 × 10²³ molecules/kmol; a = effective cross-section area occupied by one water molecule = 0.114 × 10⁻18 m2; M = molecular mass of water = 18 × 10⁻3 g/kmol.
3.4. Adsorption Experiment
250 mL Erlenmeyer flasks containing 100 mL of contaminated surface water from Eastern Obolo with an initial concentration of 50 mg/L of Zn2+ ions were filled with 1.0 g of activated adsorbent (particle size 150 μm). At room temperature (25°C), the flasks were shaken at 200 rpm on a thermostatic shaker. Until equilibrium was reached, the interaction was permitted for varying durations of 10, 20, 30, 45, 60, 90, and 120 minutes. The tests for oyster shell char (OSC) and periwinkle shell char (PSC) were carried out independently. A 5 mL aliquot was taken out of each flask at each time interval and filtered with What-man No. 1 filter paper. Flame Atomic Absorption Spectrophotometry was used to measure the residual zinc concentration in the filtrate at a wavelength of 213.9 nm. Plotting the amount of zinc adsorbed versus the corresponding residual zinc concentration was done for each time interval.
3.4.1. Percentage Adsorption
The percentage of Zn
2⁺ removed (R%) at each time interval was obtained using equation (
6)
| [14] | Abel, U. A., Isotuk, U. R., Okon, O. G., Ukponobong, A., Etim, O. J., Akwayo, I. J., Ani, U. G., & Paul, E. E. (2026). Optimisation and Adsorption Modelling of Chromium (Cr\(^{3+}\)) Removal from Brewery Effluent Using Sustainable African Pear (Dacryodes edulis) Seed-based Activated Carbon: An Experimental and Predictive Modelling Approach. Asian Journal of Chemical Sciences, 16(3), 93-107.
https://doi.org/10.9734/ajocs/2026/v16i3451 |
[14]
.
Where: Co = initial zinc ion concentration (mg/L); Ct = concentration of zinc ion at time t (mg/L).
3.4.2. Adsorption Capacity
Theamountofzincionadsorbedperunitmassofadsorbentattimet(qt)wasevaluatedusingtheequation(
7)
| [15] | Aniagor, C. O., Hussein, D. M., Farag, S., & Hashem, A. (2021). Study on the uptake of aqueous zinc ion onto a novel organic acid modified biosorbent. Research Square.
https://doi.org/10.21203/rs.3.rs-456826/v1 |
[15]
Where: qt = amount of Zn2⁺ adsorbed at time t (mg/g); V = volume of solution (L); W = weight of the adsorbent (g). The equilibrium adsorption capacity (qe) was also calculated from:
Where: qe = amount of Zn
2⁺ adsorbed at equilibrium (mg/g); Ce = equilibrium concentration of zinc ion (mg/L). According to Onursal
| [16] | Onursal, N. (2025). Application of a new adsorption kinetic model for the removal of Zn (II) ions present in aqueous solutions with Malatya clay. Journal of King Saud University - Science, 37, 4232024.
https://doi.org/10.25259/jksus_423_2024 |
[16]
, the adsorptive capacity can also be expressed as shown in equation (
9).
Where: m = mass of adsorbent used (g); X = mass of zinc adsorbed (mg).
3.5. Effect of Process Parameters on Adsorption Rate
3.5.1. Effect of Contact Time
Batch tests with a set adsorbent dosage of 1.0 g in 100 mL of 50 mg/L zinc solution and a known particle size of 150 μm were used to examine the impact of contact time on zinc adsorption at various contact times of 10, 20, 30, 45, 60, 90, and 120 minutes at room temperature (25°C).
3.5.2. Effect of Adsorbent Dosage
The effect of adsorbent dosage on zinc adsorption was studied using particle size of 150 μm and a contact time of 60 minutes at room temperature, for different adsorbent doses of 0.5, 1.0, 1.5, 2.0, and 2.5 g in 100 mL of 50 mg/L zinc solution.
3.5.3. Effect of Temperature
The effect of temperature on zinc ion adsorption was studied using a fixed particle size of 150 μm, adsorbent dosage of 1.0 g, and a contact time of 60 minutes, across different temperature levels of 25, 30, 40, 50, and 60°C.
3.5.4. Effect of Initial Zinc Ion Concentration
The effect of initial zinc ion concentration was investigated by preparing solutions of varying Zn2⁺ concentrations (10, 25, 50, 75, 100, and 150 mg/L) while keeping the adsorbent dosage at 1.0 g, particle size at 150 μm, contact time at 60 minutes, and temperature at 25°C.
3.5.5. Effect of pH
The effect of initial solution pH on zinc adsorption was studied over a pH range of 2.0 to 8.0. The pH was adjusted using 0.1 M NaOH and 0.1 M HCl solutions and measured with a calibrated digital pH meter. The experiments were conducted at an initial zinc concentration of 50 mg/L, adsorbent dosage of 1.0 g, particle size of 150 μm, and contact time of 60 minutes. Zinc precipitation at pH > 8.0 was avoided to prevent interference with the adsorption mechanism.
3.6. Adsorption Models
The rate of adsorption, the mechanism of adsorption, and the possible rate-controlling processes (mass transport, pore diffusion, or chemical reaction) were all investigated using kinetic analysis
| [17] | Ebi, O. E., Taiwo, A. F., & Adepoju, T. (2019). Kinetic Modelling of the Biosorption of Methylene Blue onto Wild Melon (Lagenariasphaerica). Journal of Chemical Engineering, 6(6), 126. https://doi.org/10.11648/j.ajche.20180606.12 |
[17]
. In order to model the adsorption kinetics of zinc adsorption periwinkle and oyster shell, pseudo first-order, pseudo second-order, and intra-particle diffusion model equations were fitted to the experimental data. Finding the correlation coefficient (
) as a gauge of agreement between the experimental results was crucial.
3.6.1. Pseudo-First-Order Model
The pseudo-first-order rate equation is generally expressed as equation (
10).
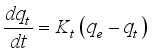 (10)
(10) Where: qt = adsorption capacity at time, t (mg. g-1), qe = adsorption capacity at equilibrium (mg. g-1), t = contact time (min), K1 = pseudo-first-order rate constant (min-1).
After integrating and applying boundary conditions between limits, q
t = 0 at t = 0 and q
t = q
t at t = t, equation (
10) becomes (
11)
| [18] | Iniobong J. A, Innocent O. O (2024). Adsorption of Crystal Violet Dye from Aqueous Solution Using Jatropha Tanjorensis Leaf Powder in a Fixed-Bed Column. Annals of the Faculty of Engineering Hunedoara 22(2), 27-36. |
[18]
.
q
t=q
e(1-exp
q
t=q
e(1-exp

)
(11)  (12)
(12) The plot of loge (qe-qt) versus contact time (t), should give a linear relationship from which K1 and qe could be determined from the slope and intercept of the graph respectively.
3.6.2. Pseudo-Second-Order Model
The pseudo-second-order rate equation is expressed in equation (
13).
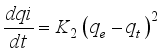 (13)
(13) Where: qt = adsorption capacity at time t (mg. g-1), qe = adsorption capacity at equilibrium (mg. g-1), t = contact time (min), K2 = pseudo-second-order rate constant1 g (g. min-1).
Integrating the equation between the boundary conditions, qt = 0 at t = 0 and qt = qt at t = t, the linearized model equation will be (Yasmin et al., 2009).
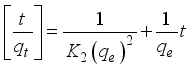 (14)
(14) Plotting (t/q
t) against t in equation (
14) yields a linear connection from which the slope and intercept of the graph, respectively, can be used to get qe and K
2.
3.6.3. Intraparticle Diffusion Model
This model is expressed as shown in equation (
15).
where: qt = adsorption capacity at time t (g. g-1), t = contact time (min), l = boundary layer thickness, kid = intraparticle diffusion rate factor, g (g. min)-0.5
Plotting against revealed a linear connection; the slope and intercept of the plot, respectively, could be used to derive I and Kid. Higher values of "l" indicate greater adsorption capacities, and higher values of kid show an increase in the rate of adsorption. Conversely, higher kid values show a better adsorption mechanism, which is linked to an improved bonding between the adsorbent particles and the adsorbate (Igwe et al., 2008).
3.7. Adsorption Equilibrium Studies
The link between the quantity of adsorbed zinc ions per unit of biosorbent (adsorbent) (
) and the zinc concentration in the solution ((
) at equilibrium at a specific temperature, pressure, pH, and total solute concentration is shown by the adsorption isotherms in this study
| [18] | Iniobong J. A, Innocent O. O (2024). Adsorption of Crystal Violet Dye from Aqueous Solution Using Jatropha Tanjorensis Leaf Powder in a Fixed-Bed Column. Annals of the Faculty of Engineering Hunedoara 22(2), 27-36. |
[18]
. After conducting the adsorption isotherm experiment at various temperatures (25, 30, 40, 50, and 60°C), the sorption equilibrium data from the batch trials were fitted using the Langmuir and Freudlich Using isotherm models to explain the adsorption Zinc ion isotherms on PSC and OSC, respectively.
3.7.1. Langmuir Isotherms
The Langmuir model is expressed by equation (
16)
| [18] | Iniobong J. A, Innocent O. O (2024). Adsorption of Crystal Violet Dye from Aqueous Solution Using Jatropha Tanjorensis Leaf Powder in a Fixed-Bed Column. Annals of the Faculty of Engineering Hunedoara 22(2), 27-36. |
[18]
.
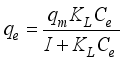 (16)
(16) Where: qe = adsorption capacity at equilibrium (g H2O. g adsorbent-1), Ce = concentration in solution at equilibrium, KL = Langmuir parameter, qm = Langmuir parameter.
Rearranging and linearizing equation (
16) gives equation (
17).
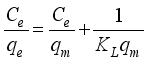 (17)
(17) A plot of

versus

yields a straight line graph with slope equivalent to

and the intercept as

from which
and
were determined.
The Langmuir model was created for gas phase adsorption, it can occasionally accurately depict liquid phase phenomena. The dimensionless separation parameter (R
L) can be used to express the Langmuir isotherm as in equation (
18)
| [18] | Iniobong J. A, Innocent O. O (2024). Adsorption of Crystal Violet Dye from Aqueous Solution Using Jatropha Tanjorensis Leaf Powder in a Fixed-Bed Column. Annals of the Faculty of Engineering Hunedoara 22(2), 27-36. |
[18]
.
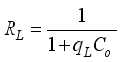 (18)
(18) Where: Separation parameter, Langmuir parameter, Highest water concentration
This parameter has been used to predict how feasible an adsorption system is. If the value of

(favourable),

(linear adsorption),

(irreversible) and

(favourable).
3.7.2. Freundlich Isotherm
An empirical equilibrium relationship between heterogeneous surfaces, this isotherm frequently provides a more satisfying correlation of experimental data. In relation to the heat of adsorption, it is assumed that the distribution of adsorption sites is exponential
| [19] | Abel, U. A., Habor, G. R., & Oseribho, O. I. (2021). Mathematical and kinetic modelling of the adsorption of crude oil spill using coconut coir activated carbon. Journal of Energy Environmental & Chemical Engineering, 6(1), 1.
https://doi.org/10.11648/j.jeece.20210601.11 |
[19]
.
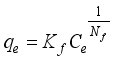 (19)
(19) Where qe = concentration in solution at equilibrium (% W/W), Ce = adsorption capacity at equilibrium (g H2O. g adsorbent-1), Kf = Freundlich constant indicating adsorption capacity, and NF = Freundlich constant indicating adsorption intensity or surface heterogeneity (dimensionless).
Freundlich's logarithmic linear form Equation (
20) can be used to express isotherm.
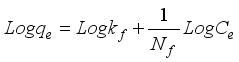 (20)
(20) A plot of

versus

gave a linear relationship. The Freundlich constants

and

were obtained from the slope and intercept of the plot respectively. The term
indicates the intensity of adsorption, which in turn was ascribed to the distribution of heat of adsorption (Q) or surface heterogeneity factory (Y).
is a measure of performance of adsorbent. When the value of
(normal freundlich adsorption),
(cooperative adsorption) and
(favourable adsorption).
It is generally accepted that the smaller values of
suggest better adsorption characteristics and formation of rather strong bond between the adsorbate and adsorbent
| [20] | Ukpong, A. A., Edekhe, G. I., & Asuquo, E. O. (2024). The Adsorption Studies for the Removal of Lead (Pb2+) from Paint Industrial Wastewater using Avocado Seed Activated Carbon (ASAC). International Journal of Research and Scientific Innovation, XI (I), 414-425. https://doi.org/10.51244/ijrsi.2024.1101032 |
[20]
.
3.7.3. Thermodynamics Studies
The Van't Hoff equation was used to determine parameters such as the standard entropy change (J/mol. k), the standard enthalpy change (KJ/mol), and the Gibbs free energy change (KJ/mol. k), in order to conduct a thermodynamic study of the adsorption process.
The distribution adsorption coefficient/ equilibrium constant (
) of Zinc ion adsorbed by an adsorbent (mg/l) was obtained using equation (
23).
Where: R is the universal gas constant (8.314J.), T is the absolute temperature in Kelvin.
Equilibrium concentration of adsorbed species in bulk phase (Ce) and adsorbent phase (qe) at different temperatures were approximately correlated to estimate the thermodynamics parameters.
Adsorption experiments were carried out at various temperatures of 25, 35, 45, and 55°C in order to gather batch equilibrium data that was utilized to compute the distribution adsorption coefficient/equilibrium constant (K
e) at these temperatures using equation (
23). The values of
and
were determined from the slope and intercept of the plot of InK
e vs 1/T equation (
21). For all temperatures,
from equation (
22).
4. Results and Discussion
4.1. FTIR Spectroscopic Characterization
Figure 1. FTIR pectrum of activated periwinkle shell char (PSC).
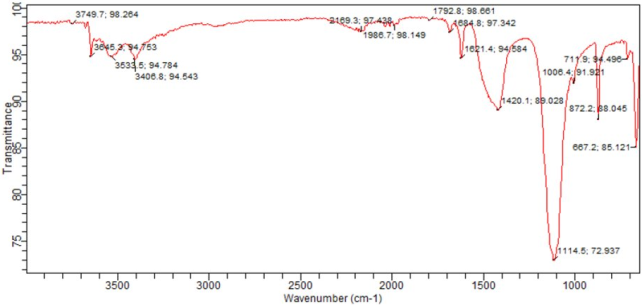
Figure 2. FTIR spectrum of activated oyster shell char (OSC).
FTIR spectroscopy was employed to identify the surface functional groups of the activate d periwinkle shell char (PSC) and oyster shell char (OSC) prior to adsorption. The spectra recorded over 600-4000 cm
−1 are presented in
Figures 1 and 2, and key absorption bands are summarised in
Table 2.
The FTIR spectrum of PSC (
Figure 1) reveals a broad O-H stretching envelope between 3399.3 and 3645.3 cm
−1, attributed to surface hydroxyl groups (-OH) and adsorbed water molecules, which serve as primary active sites for Zn
2+ coordination and ion exchange
| [20] | Ukpong, A. A., Edekhe, G. I., & Asuquo, E. O. (2024). The Adsorption Studies for the Removal of Lead (Pb2+) from Paint Industrial Wastewater using Avocado Seed Activated Carbon (ASAC). International Journal of Research and Scientific Innovation, XI (I), 414-425. https://doi.org/10.51244/ijrsi.2024.1101032 |
[20]
. The weak C-H band at 2967.0 cm
−1 confirms near-complete combustion of organic matter (chitin, conchiolin) from the
Tympanotonus fuscatus shell during calcination at 600°C. The CO
32− overtone at 1982.9 cm
−1 and the dominant ν
3 asymmetric stretching band at 1420.1 cm
−1 confirm calcite (CaCO
3) as the principal mineral phase, consistent with the 87.43% Ca content determined by XRF. The calcite fingerprint triplet at 1006.4, 872.2, and 711.9 cm
−1 (ν
4, ν
2, ν
4 CO
32− bending modes) unambiguously confirms the calcite polymorph, with the absence of the aragonite doublet near 700 cm
−1. The most intense absorption at 1110.7 cm
−1 (T = 50.979%) is attributed to overlapping Si-O-Si, C-O, and S=O stretching vibrations arising from HCl acid-activation-induced surface modification, introducing polar functional groups that enhance Zn
2+ binding capacity
| [20] | Ukpong, A. A., Edekhe, G. I., & Asuquo, E. O. (2024). The Adsorption Studies for the Removal of Lead (Pb2+) from Paint Industrial Wastewater using Avocado Seed Activated Carbon (ASAC). International Journal of Research and Scientific Innovation, XI (I), 414-425. https://doi.org/10.51244/ijrsi.2024.1101032 |
[20]
.
The FTIR spectrum of OSC (
Figure 2) exhibits spectral features largely analogous to PSC, reflecting a shared calcite-dominated inorganic composition. However, notable differences are observed. An additional sharp free O-H stretching band at 3749.7 cm
−1 (T = 98.264%), absent in PSC, is assigned to completely isolated surface hydroxyl groups or Ca(OH)
2 residues, suggesting a distinct surface hydroxyl environment in
Crassostrea gigas-derived char. The four-band O-H cluster (3406.8-3749.7 cm
−1) and the H-O-H bending band at 1621.4 cm
−1 (T = 94.584%) confirm the presence of structurally distinct surface hydroxyl species across a wider energy distribution than PSC. The ν
3 calcite band at 1420.1 cm
−1, combined with the diagnostic ν
2/ν
4 triplet at 1006.4, 872.2, and 711.9 cm
−1, confirms calcite as the dominant crystalline phase (Ca content = 91.26%). The strong absorption at 1114.5 cm
−1 (T = 72.937%), although analogous to PSC, shows higher transmittance, indicating a comparatively lower concentration of acid-activation-derived surface groups; however, the superior specific surface area of OSC (214.7 m
2/g vs. 186.4 m
2/g) compensates by providing greater active site accessibility.
Table 2. Principal FTIR absorption bands for activated PSC and OSC.
OSC (cm⁻1) | PSC (cm⁻1) | Vibrational Mode |
3749.7 | — | Free O-H stretch |
3645.3-3406.8 | 3645.3-3399.3 | H-bonded O-H stretch |
~3169 | ~2967 | Overtone / C-H stretch |
~1987 | ~1983 | CO32⁻ overtone |
1684.8 | 1673.8 | C=O / H-O-H bend |
1621.4 | 1621.4 | H-O-H bending |
1420.1 | 1420.1 | CO32⁻ ν3 stretch |
1114.5 | 1110.7 | Si-O / S=O / C-O |
1006.4 | 1006.4 | CO32⁻ ν4 bend |
872.2 | 872.2 | CO32⁻ ν2 bend |
711.9 | 711.9 | CO32⁻ ν4 doublet |
667.2 | 667.2 | Ca-O lattice stretch |
Overall, FTIR analysis confirms that both PSC and OSC are calcite-dominated, hydroxyl-rich, acid-activated adsorbents whose surface chemistry facilitates Zn2+ removal via surface complexation (-OH + Zn2+ → -OZn+ + H+), ion exchange with lattice Ca2+, and electrostatic interaction. The additional free -OH band at 3749.7 cm−1 unique to OSC and its higher surface area together account for its superior adsorption performance, while the more intense surface modification band at 1110.7 cm−1 in PSC reflects greater HCl-induced surface functionalization. These findings provide mechanistic support for the adsorption kinetic, isotherm, and thermodynamic results discussed in subsequent sections.
4.2. Scanning Electron Microscopy (SEM) Analysis
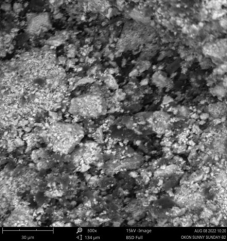
Figure 3. SEM micrograph of activated OSC (500×, scale bar = 30 μm).
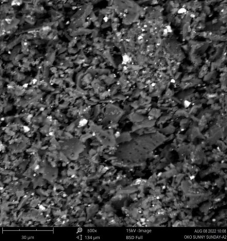
Figure 4. SEM micrograph of activated PSC (500×, scale bar = 30 μm).
The SEM micrograph of activated oyster shell char (OSC) at 500× magnification (
Figure 3) reveals a heterogeneous surface characterized by angular, coarse particulate aggregates interspersed with finer granular debris, irregular macro-voids, and visible inter-particle pore spaces. Scattered bright micro-particles distributed across the surface are attributed to residual CaCO
3 crystallites or CaO phases, consistent with the high calcium content (91.26%) confirmed by XRF analysis. The rough, open macro-porous architecture of OSC is indicative of structural disruption during calcination and HCl activation, and is directly associated with its higher specific surface area (214.7 m
2/g) and pore volume (0.476 mL/g), which collectively provide a greater density of accessible active sites for Zn
2+ adsorption.
In contrast, the SEM micrograph of activated periwinkle shell char (PSC) (
Figure 4) displays a denser, plate-like and lamellar particle arrangement with flattened, overlapping fragments of varying sizes, reflecting the inherent layered microstructure of the
Tympanotonus fuscatus shell partially preserved after thermal treatment. The more tightly packed morphology of PSC, with reduced inter-particle void space relative to OSC, is consistent with its comparatively lower specific surface area (186.4 m
2/g) and pore volume (0.318 mL/g). Nevertheless, the surface roughness and HCl-generated active sites on both adsorbents confirm their suitability for Zn
2+ removal via surface complexation and ion exchange, in agreement with the physicochemical characterization and adsorption results reported by Folorunsho et. al
| [21] | Adepoju Tunde Folorunsho, Ukpong Anwana Abel, Eyibio Uduak Promise. (2016). A Statistical Approach to Optimization of Congo Red Dye Removal (CRDR) Via Coconut Shell Activated Carbon (CSAC). International Journal of Computational and Theoretical Chemistry, 4(2), 7-13.
https://doi.org/10.11648/j.ijctc.20160402.11 |
[21]
.
4.3. Physicochemical Characteristics of Periwinkle Shell Char and Oyster Shell Char
The physical properties of the two adsorbents (PSC and OSC) are presented in
Table 3.
Table 3. Physicochemical Properties of Activated PSC and OSC.
Property | PSC | OSC |
Moisture Content (%) | 8.43 | 11.67 |
Pore Volume (mL/g) | 0.318 | 0.476 |
Porosity | 0.031 | 0.044 |
Bulk Density (g/mL) | 0.72 | 0.89 |
SSA (m2/g) | 186.4 | 214.7 |
The bulk densities of both samples ranged from 0.72 to 0.89 g/mL. The bulk density of PSC was lower than that of OSC. A higher bulk density is indicative of greater adsorption capacity, as the adsorbent contains more mass per unit volume available for interaction with zinc ions
| [22] | Sen, T. K., & Khoo, C. (2013). Adsorption Characteristics of Zinc (Zn2+) from Aqueous Solution by Natural Bentonite and Kaolin Clay Minerals: A Comparative Study. Computational Water Energy and Environmental Engineering, 02(03), 1-6.
https://doi.org/10.4236/cweee.2013.23b001 |
[22]
.
Table 3 shows that the moisture content of PSC (8.43%) was lower than that of OSC (11.67%). A lower moisture content is advantageous for adsorption, since water molecules compete with zinc ions for available active sites on the adsorbent surface. The pore volume of PSC was 0.318 mL/g while its porosity was 0.031; the pore volume of OSC was 0.476 mL/g while its porosity was 0.044. Higher pore volume and porosity indicate greater adsorption capacity
| [23] | Adewoye, T., Ogunleye, O., Abdulkareem, A., Salawudeen, T., & Tijani, J. (2021). Optimization of the adsorption of total organic carbon from produced water using functionalized multi-walled carbon nanotubes. Heliyon, 7(1), e05866.
https://doi.org/10.1016/j.heliyon.2020.e05866 |
[23]
. Both adsorbents recorded comparable specific surface areas, indicating their suitability for heavy metal adsorption applications.
The effect of process parameters considered in this study includes the effect of contact time, adsorbent dosage, temperature, initial zinc ion concentration, and solution pH on the adsorption of zinc ions onto PSC and OSC.
4.3.1. Effect of Contact Time on Adsorption
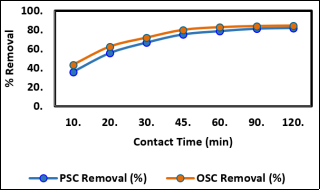
Figure 5. Effect of Contact Time on Zinc Ion Adsorption.
The effect of contact time on the percentage removal of Zn
2⁺ ions using a particle size of 150 μm and adsorbent dosage of 1.0 g is presented in
Figure 5 for both PSC and OSC. The percentage adsorption of zinc ions increased gradually with contact time for both adsorbents, reaching equilibrium at approximately 60 minutes. This initial rapid adsorption is attributed to the abundance of vacant active sites on the adsorbent surface; as these sites become occupied, the rate of adsorption slows until equilibrium is established. Both PSC and OSC demonstrated the capacity to remove zinc ions from aqueous solution, confirming their suitability as low-cost biosorbents for heavy metal remediation.
4.3.2. Effect of Adsorbent Dosage on Adsorption
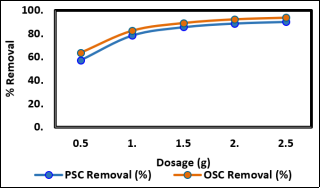
The effect of adsorbent dosage on the percentage removal of zinc ions is shown in
Figure 6. As the dosage of both PSC and OSC was increased from 0.5 g to 2.5 g, the percentage of Zn
2⁺ removed from solution increased correspondingly. This trend is attributed to the increase in surface area and the number of available active adsorption sites as more adsorbent is added, thereby enhancing the rate and extent of zinc ion adsorption. This result is consistent with findings reported for other shell-based adsorbents in heavy metal removal studies
| [24] | Macena, M., Pereira, H., Cruz-Lopes, L., Grosche, L., & Esteves, B. (2025). Competitive adsorption of metal ions by lignocellulosic materials: A review of applications, mechanisms and influencing factors. Separations, 12(3), 70.
https://doi.org/10.3390/separations12030070 |
[24]
.
Figure 6. Effect of Adsorbent Dosage on Zinc Ion Adsorption.
4.3.3. Effect of Temperature on Adsorption
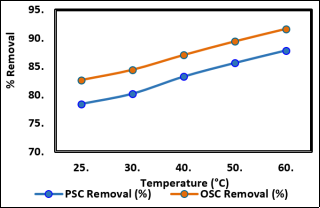
Figure 7. Effect of Temperature on Zinc Ion Adsorption.
One crucial factor controlling the adsorption process is temperature.
Figure 3 illustrates how temperature affects the proportion of Zn
2⁺ removed by PSC and OSC at specified particle size, dosage, and contact duration. The% removal of zinc ions increased for both adsorbents as the temperature rose from 25°C to 60°C, suggesting that the adsorption of Zn
2+ onto PSC and OSC is endothermic. At 60°C, the greatest percentage of zinc ions removed from an initial zinc concentration of 50 mg/L was 82.6% for PSC and 85.3% for OSC. The increased diffusion of zinc ions across the exterior boundary layer and into the adsorbents' interior pore structure at higher temperatures may be the cause of the temperature-dependent increase in adsorption
| [25] | Bellir, K., Lehocine, M. B., & Meniai, A. (2013). Zinc removal from aqueous solutions by adsorption onto bentonite. Desalination and Water Treatment, 51(25-27), 5035-5048.
https://doi.org/10.1080/19443994.2013.808786 |
[25]
.
4.3.4. Effect of pH on Adsorption
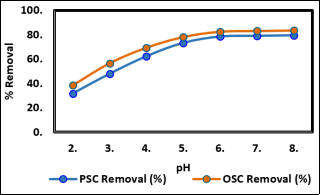
The effect of solution pH on zinc adsorption by PSC and OSC is presented in
Figure 8. The percentage removal of Zn
2⁺ was lowest at pH 2.0 and increased progressively with increasing pH up to pH 6.0, beyond which the rate of increase slowed. At low pH values, the adsorbent surface becomes protonated, resulting in electrostatic repulsion between the positively charged surface and Zn
2⁺ cations. As pH increases, the surface charge becomes less positive, reducing competition from H⁺ ions and favouring zinc ion adsorption. Experiments were limited to pH 8.0 to avoid Zn(OH)
2 precipitation, which would interfere with accurate measurement of adsorption. The optimum pH for both adsorbents was determined to be 6.0, consistent with
| [26] | Premachandra, S., Kanishka, M., & Priyantha, N. (2026). Impact of Hardness on the Interaction of Zn (Ii) with a Fibrous Biosorbent, Panicum Maximum Dried Leaves. Research Square. https://doi.org/10.21203/rs.3.rs-8584467/v1 |
[26]
.
Figure 8. Effect of pH on Zinc Ion Adsorption.
4.3.5. Effect of Initial Zinc Ion Concentration
Figure 9. Effect of Initial Zinc Ion Concentration on Adsorption.
The effect of initial Zn
2⁺ concentration on adsorption is shown in
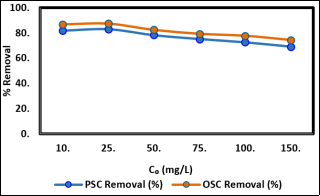
Figure 9. As the initial zinc concentration increased from 10 to 150 mg/L, the percentage removal of zinc decreased while the adsorption capacity (qe) increased. This is because at lower concentrations, all zinc ions present can interact with the available active sites, yielding high removal efficiency. At higher concentrations, the active sites become saturated, reducing percentage removal but increasing overall loading on the adsorbent. The adsorption capacity at equilibrium reached 32.4 mg/g for PSC and 37.8 mg/g for OSC at the highest tested concentration
| [27] | Zhao, W., Hao, C., Guo, Y., Shao, W., Tian, Y., & Zhao, P. (2023). Optimization of adsorption conditions using response surface methodology for tetracycline removal by MNFE2O4/Multi-Wall carbon nanotubes. Water, 15(13), 2392. https://doi.org/10.3390/w15132392 |
[27]
.
4.4. Adsorption Capacity
4.4.1. Adsorption Capacity with Contact
Figure 10. Adsorption Capacity with Respect to Contact Time.
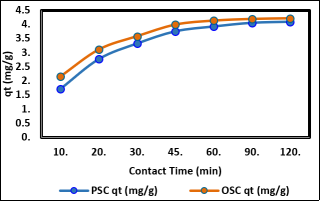
Figure 10. The adsorption capacity (mg of zinc adsorbed per gram of adsorbent) for 1.0 g of PSC and OSC in 100 mL of 50 mg/L zinc solution is plotted against contact time in
Figure 10. For both adsorbents, the adsorption capacity grew with contact time until equilibrium was reached. The greatest adsorption capabilities at equilibrium were qe = 4.26 mg/g for OSC and qe = 3.89 mg/g for PSC. Because of its larger surface area and porosity, which offer more accessible active sites for zinc ion binding, OSC has a higher capacity.
4.4.2. Adsorption Capacity with Adsorbent Dosage
Figure 11. Adsorption Capacity with Adsorbent Dosage.
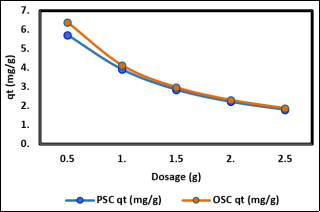
Figure 11 presents the adsorption capacity of PSC and OSC with respect to adsorbent dosage. The adsorption capacity (mg of zinc adsorbed per gram of adsorbent) decreased as the adsorbent dosage was increased from 0.5 g to 2.5 g at a contact time of 60 minutes. This inverse relationship is explained by the fact that at higher dosages, many active sites remain unsaturated relative to the fixed quantity of zinc ions in solution, resulting in lower utilization per unit mass of adsorbent. This trend is consistent with findings of
.
4.4.3. Adsorption Capacity with Temperature
Figure 12. Adsorption Capacity with Temperature.
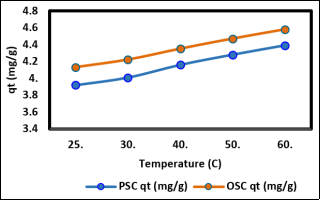
The adsorption capacity of 1.0 g of PSC and OSC at a constant contact duration of 60 minutes is shown in
Figure 12 in relation to temperature. For both adsorbents, the adsorption capacity rose as the temperature rose from 25°C to 60°C, supporting the endothermic character of the zinc adsorption process. This is consistent with thermodynamic analysis that demonstrates a positive enthalpy change (ΔH° > 0), suggesting that increased thermal energy encourages more interaction between Zn
2+ ions and active sites on PSC and OSC surfaces
| [29] | Tang, X., Chien, S. W., Zhu, Q., Qu, Z., Xu, J., & Wang, X. (2024). Enhancement of Thermoelectric Properties of Zinc Oxide Composites via Doping with Active Metal Oxide. Energy Material Advances, 6.
https://doi.org/10.34133/energymatadv.0140 |
[29]
. The adsorption capacity of 1.0 g of PSC and OSC with respect to temperature at a constant contact time of 60 minutes. The adsorption capacity increased with increasing temperature from 25°C to 60°C for both adsorbents, further confirming the endothermic nature of the zinc adsorption process. This agrees with thermodynamic analysis showing positive enthalpy change (ΔH° > 0), indicating that higher thermal energy promotes enhanced interaction between Zn
2⁺ ions and active sites on PSC and OSC surfaces
| [29] | Tang, X., Chien, S. W., Zhu, Q., Qu, Z., Xu, J., & Wang, X. (2024). Enhancement of Thermoelectric Properties of Zinc Oxide Composites via Doping with Active Metal Oxide. Energy Material Advances, 6.
https://doi.org/10.34133/energymatadv.0140 |
[29]
.
4.5. Adsorption Kinetics
The kinetics of the zinc adsorption process were monitored by tracking adsorption capacity with contact time until equilibrium was achieved. The equilibrium concentrations of zinc remaining in solution were 9.13 mg/L for PSC and 7.87 mg/L for OSC, corresponding to equilibrium adsorption capacities of qe = 3.89 mg/g and qe = 4.26 mg/g respectively.
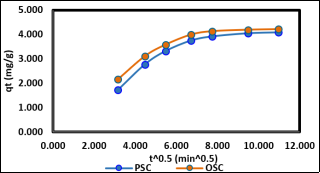
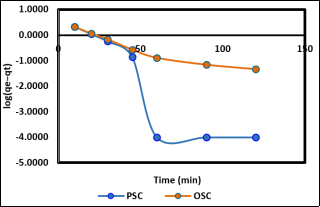
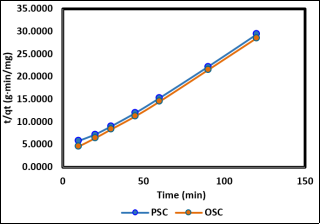
Figures 9-14 present the kinetic behavior of both adsorbents evaluated using the Intraparticle Diffusion, Pseudo-First Order, and Pseudo-Second Order kinetic models.
4.5.1. Intraparticle Diffusion Model
Figure 13. Intraparticle Diffusion Model for Periwinkle Shell Char (PSC) and Oyster Shell Char (OSC).
The mechanism behind the adsorption process, the intraparticle diffusion model, is shown in
Figure 13. Boundary layer diffusion is responsible for the first linear section of the curve, whereas intraparticle diffusion is responsible for the second part. The plots' failure to cross the origin suggests the presence of other mechanisms, most likely boundary layer resistance (also known as external film resistance), which results from viscous drag between the adsorbent surface and diffusing zinc ions in solution. The boundary layer thickness (δ) was 14.32 for PSC and 16.47 for OSC. The larger boundary layer thickness for OSC suggests stronger bonding between the sorbent and zinc ions, consistent with its higher adsorption capacity. The intraparticle diffusion rate constants (Kid) were 0.312 mg g⁻
1 min⁻
1/2 for PSC and 0.358 mg g⁻
1 min⁻
1/2 for OSC, indicating that the sorption process was particle-diffusion controlled. Higher R
2 values confirm good fitness of the model
| [30] | An, B. (2020). CU (II) and AS (V) adsorption kinetic characteristic of the multifunctional amino groups in Chitosan. Processes, 8(9), 1194. https://doi.org/10.3390/pr8091194 |
[30]
.
4.5.2. Pseudo-First Order Model
Figure 14. Pseudo-First Order Model for Periwinkle Shell Char (PSC) and Oyster Shell Char (OSC).
The pseudo-first order kinetic parameters derived from each plot's slope and intercept, along with the associated correlation coefficients, are displayed in
Figure 14. In comparison to the experimental results of qe, exp = 3.89 mg/g and 4.26 mg/g, respectively, the computed equilibrium adsorption capacities, qe, cal, were 3.54 mg/g for PSC and 4.01 mg/g for OSC. A rather excellent match to the pseudo-first order model is indicated by the correlation values R
2 = 0.927 for PSC and R
2 = 0.951 for OSC
| [31] | Ikhsani, I. Y., Santosa, S. J., & Rusdiarso, B. (2017). Comparative study of NI-ZN LHS and MG-AL LDH adsorbents of Navy Blue and Yellow F3G dye. Indonesian Journal of Chemistry, 16(1), 36.
https://doi.org/10.22146/ijc.21175 |
[31]
. Compared to PSC, OSC appears to correspond more closely to pseudo-do-first order kinetics, as indicated by its greater R
2.
4.5.3. Pseudo-Second Order Model
Figure 15. Pseudo-Second Order Model for Periwinkle Shell Char (PSC) and Oyster Shell Char (OSC).
The pseudo-second order kinetic parameters were calculated using each plot's slope and intercept, as seen in
Figure 15. The estimated q
e for PSC, cal = 5.88 mg/g, was more than the experimental q
e, exp = 3.89 mg/g, and the R
2 = 0.612, which is significantly less than unity. Additionally, q
e, cal = 6.21 mg/g for OSC was greater than qe, exp = 4.26 mg/g with R
2 = 0.574. These poor R
2 values show that the pseudo-second order kinetics model does not well fit the experimental data for either adsorbent. When the three kinetic models were compared, the Pseudo-First Order model (R
2 = 0.927) and the Intraparticle Diffusion model (R
2 = 0.874 for PSC and R
2 = 0.906 for OSC) suited the experimental data the best. Because of its low R
2 values, the pseudo-second order model was unable to accurately characterize the adsorption kinetics. Zinc ion adsorption onto PSC and OSC calcined at 600°C is therefore best described by the Pseudo-First Order kinetic model, with intraparticle diffusion serving as a contributing factor.
| [31] | Ikhsani, I. Y., Santosa, S. J., & Rusdiarso, B. (2017). Comparative study of NI-ZN LHS and MG-AL LDH adsorbents of Navy Blue and Yellow F3G dye. Indonesian Journal of Chemistry, 16(1), 36.
https://doi.org/10.22146/ijc.21175 |
[31]
.
4.6. Adsorption Isotherm
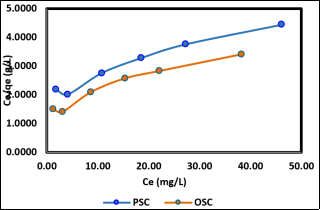
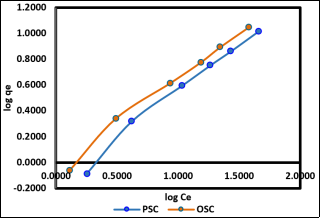
The Langmuir and Freundlich adsorption isotherm models were applied to equilibrium adsorption data obtained at temperatures of 25, 35, 45, and 55°C. The isotherm constants were determined from the slopes and intercepts of the respective linearized plots as presented in
Figures 16 and 17.
Figure 16. Determination of Langmuir Isotherm.
The Langmuir isotherm parameters for PSC were: maximum monolayer adsorption capacity qm = 32.26 mg/g, Langmuir constant KL = 0.148 L/mg, dimensionless separation factor RL = 0.119, and correlation coefficient R2 = 0.982. The R2 value close to unity confirms that the experimental data fit the Langmuir isotherm model well. The separation factor RL lies within 0 < RL < 1, indicating favourable adsorption of zinc ions onto PSC.
The Langmuir isotherm parameters for OSC were: qm = 37.88 mg/g, KL = 0.172 L/mg, RL = 0.104, and R2 = 0.991. The higher qm value for OSC compared to PSC is consistent with its greater surface area and calcium content, which provide more active binding sites for Zn2⁺. The RL value within 0 < RL < 1 also confirms favourable adsorption for OSC.
Figure 17. Determination of Freundlich Isotherm for Periwinkle Shell Char (PSC) and Oyster Shell Char (OSC).
The Freundlich isotherm for PSC (
Figure 17) gave 1/n = 0.412 and KF = 4.87 (mg/g)(L/mg)
1/ⁿ, with R
2 = 0.964. Since 0 < 1/n < 1, the adsorption of zinc ions onto PSC is favourable and heterogeneous in nature, consistent with the physical surface characteristics of periwinkle shell char.
The Freundlich isotherm for OSC (
Figure 17) gave 1/n = 0.387 and KF = 5.63 (mg/g)(L/mg)
1/ⁿ, with R
2 = 0.978. The 1/n value within 0 < 1/n < 1 also signifies favourable adsorption for OSC. Comparing the two isotherm models, the Freundlich isotherm provided a slightly better fit (R
2 = 0.978 for OSC; R
2 = 0.964 for PSC) relative to Langmuir for some temperature conditions, suggesting multilayer adsorption also occurs on heterogeneous surface sites of both adsorbents. Both Langmuir and Freundlich isotherms satisfactorily describe the equilibrium adsorption data for PSC and OSC.
4.7. Thermodynamic Studies
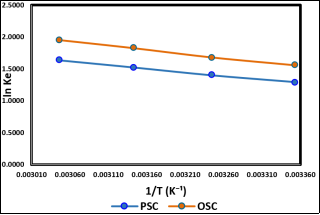
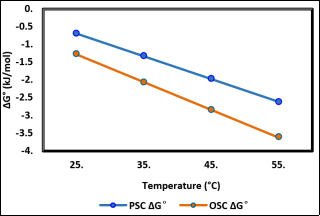
Figure 18. Thermodynamics of Zinc Ion Adsorption on Periwinkle Shell Char (PSC) and Oyster Shell Char (OSC).
Figure 19. Thermodynamics of Zinc Ion Adsorption on Periwinkle Shell Char (PSC) and Oyster Shell Char (OSC.
Figures 18 and 19 show the linear plots of ln Ke versus 1/T used to determine thermodynamic parameters for the adsorption of Zn
2⁺ onto PSC and OSC respectively. The Gibbs free energy change (ΔG°) was negative at all temperatures studied and became more negative with increasing temperature, confirming that the adsorption of zinc ions onto both adsorbents is spontaneous and thermodynamically favourable, with greater favourability at higher temperatures
| [32] | Baba, I. A., Amawuosa, E. C., Mustapha, S., Abdulkareem, A. S., & Tijani, J. O. (2026). Adsorption kinetics, isotherm, and thermodynamics studies of phytochemical-assisted synthesized ZnO nanoparticles for the removal of selected heavy metals from abattoir wastewater. Desalination and Water Treatment, 325, 101628. https://doi.org/10.1016/j.dwt.2025.101628 |
| [33] | Parashar, D., & Gandhimathi, R. (2022). Zinc Ions adsorption from aqueous solution using raw and acid-modified orange peels: Kinetics, Isotherm, Thermodynamics, and Adsorption mechanism. Water Air & Soil Pollution, 233(10).
https://doi.org/10.1007/s11270-022-05857-6 |
| [34] | Adepoju T. F and Eyibio U. P (2016) Comparative study of Response Surface Methodology (RSM) and Artificial Neural Network (ANN) on Oil Extraction from Citrus sinensis Oilseed and Its Quality Characterization; Chemistry Research Journal, 2016, 1(5): 37-50. |
[32-34]
.
The enthalpy change (ΔH°) was positive for both PSC and OSC, confirming the endothermic nature of the adsorption process. This is consistent with the observed increase in adsorption capacity with temperature and is supported by the Langmuir maximum adsorption capacities (qm) which also increased with temperature. When Zn
2+ ions are adsorbed into the active sites of both adsorbents, the degree of randomness at the solid-liquid interface increases, as indicated by the positive entropy change (ΔS°)
| [32] | Baba, I. A., Amawuosa, E. C., Mustapha, S., Abdulkareem, A. S., & Tijani, J. O. (2026). Adsorption kinetics, isotherm, and thermodynamics studies of phytochemical-assisted synthesized ZnO nanoparticles for the removal of selected heavy metals from abattoir wastewater. Desalination and Water Treatment, 325, 101628. https://doi.org/10.1016/j.dwt.2025.101628 |
[32]
. The greater mobility of zinc ions in solution at higher temperatures helps to explain this.
| [33] | Parashar, D., & Gandhimathi, R. (2022). Zinc Ions adsorption from aqueous solution using raw and acid-modified orange peels: Kinetics, Isotherm, Thermodynamics, and Adsorption mechanism. Water Air & Soil Pollution, 233(10).
https://doi.org/10.1007/s11270-022-05857-6 |
[33]
.

 ,
Ukpong Anwana Abel
,
Ukpong Anwana Abel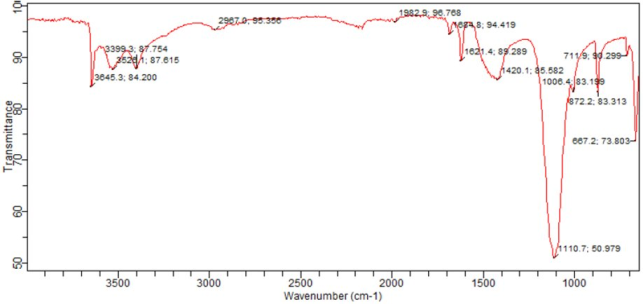



 Share This Article
 Twitter
 Linked In
 Facebook
 Copy
Copy Download