Research Article | | Peer-Reviewed

Probabilistic Gradient Boosting with Student-t Output Layer and LIME Explanations for Exchange Rate Forecasting: Evidence from Ghana

Received: 18 September 2026     Accepted: 4 October 2026     Published: 6 November 2026
Views:       Downloads:
Abstract

This paper develops a Probabilistic Gradient Boosting model with a Student-t output layer (St-NGBoost) for density forecasting of Ghana Cedi exchange rates against the US Dollar, British Pound, and Euro, augmented with Local Interpretable Model-agnostic Explanations (LIME) for transparency. Using 221 monthly log-return observations from January 2007 to June 2025, alongside eleven macroeconomic covariates including inflation, money supply M2, interest rates, oil, gold, and cocoa prices. It was demonstrated that the log-returns exhibit extreme leptokurtosis (excess kurtosis 9.55–14.65) and significant negative skewness, making the Gaussian distributional assumption untenable. St-NGBoost parameterizes the predictive density as a Student-t distribution whose location, scale, and degrees-of-freedom parameters are the outputs of a gradient-boosted ensemble, trained by minimizing the natural gradient of the negative log-likelihood. On a held-out test set spanning the high-volatility post-COVID and 2022 hyperinflationary episode, St-NGBoost delivers AIC improvements of 101.7–284.8 units over the Gaussian NGBoost benchmark, Continuous Ranked Probability Score (CRPS) reductions of 28–39%, and empirical 90% prediction interval coverage within 1.5 percentage points of the nominal level. Global LIME explanations identify inflation (11.3%), oil price (10.3%), GDP growth (9.8%), and M2 growth (8.9%) as the dominant predictive features. Local LIME explanations further reveal that the model correctly shifts explanatory weight toward inflation and interest-rate variables during the 2022 crisis months, providing economically coherent and actionable interpretations for policy-makers.

Published in American Journal of Artificial Intelligence (Volume 10, Issue 2)
DOI 10.11648/j.ajai.20261002.16
Page(s) 236-248
Creative Commons

This is an Open Access article, distributed under the terms of the Creative Commons Attribution 4.0 International License (http://creativecommons.org/licenses/by/4.0/), which permits unrestricted use, distribution and reproduction in any medium or format, provided the original work is properly cited.

Copyright

Copyright © The Author(s), 2026. Published by Science Publishing Group

Keywords

Natural Gradient Boosting, Probabilistic Gradient Boosting Machine, Student-t Distribution, LIME, Exchange Rate Forecasting, Emerging Markets, Ghana Cedi, Tail Risk

1. Introduction
Forecasting exchange rates in emerging market economies presents challenges that extend well beyond those encountered in advanced-economy settings. The Ghana Cedi has depreciated by over 1,600% against the US Dollar between January 2007 and June 2025, punctuated by multiple structural breaks tied to balance-of-payments crises, hyperinflationary episodes, and commodity price shocks. During these episodes, the conditional distribution of monthly log-returns exhibits heavy tails, severe negative skewness, and excess kurtosis reaching 14.65, a regime in which Gaussian-based prediction intervals systematically undercover the actual return realizations.
The literature on machine learning for exchange rate forecasting has predominantly focused on point predictions , with probabilistic extensions emerging only recently . Gradient Boosting Machines (GBMs) have established state-of-the-art accuracy across tabular regression tasks , yet their standard implementation produces only point forecasts. Natural Gradient Boosting and Probabilistic Gradient Boosted Trees extend the GBM framework to distributional regression, but both default to Gaussian output distributions that are ill-suited to heavy-tailed financial data.
Simultaneously, the black-box nature of ensemble methods has motivated a broad literature on model interpretability. According to , LIME constructs locally faithful linear approximations around individual predictions, producing feature attribution scores that are accessible to domain experts and policy-makers. Applied to exchange rate forecasting, LIME can reveal whether the model's predictions during crisis episodes are driven by the economically expected variables, a critical requirement for central bank accountability.
This paper makes four contributions. First, we derive the St-NGBoost algorithm: NGBoost with a Student-t output distribution, including the natural gradient expressions for all three parameters (location μ, scale σ, degrees of freedom ν). Second, we provide a rigorous empirical characterization of Ghana Cedi exchange rate dynamics using 221 monthly observations. Third, we conduct comprehensive out-of-sample evaluation using proper scoring rules benchmarked against Gaussian NGBoost, PGBM, and ARMA-GARCH-t baselines. Fourth, we deploy both global and local LIME explanations, connecting the model's predictions to well-established monetary theory. The paper proceeds as follows: Section 2 reviews related literature; Section 3 describes the data; Section 4 presents the methodology; Section 5 reports results; Section 6 concludes.
2. Related Literature
Gradient boosting methods have achieved broad empirical success across structured-data tasks. The canonical formulation fits additive ensembles of regression trees by minimising a differentiable loss function via functional gradient descent. XGBoost and LightGBM introduced algorithmic refinements column subsampling, leaf-wise growth, and histogram-based splitting that have become standard. However, these methods output only conditional means.
Distributional regression extends the GBM paradigm to the full conditional density. NGBoost parameterizes a chosen distribution and applies the natural gradient, the steepest descent direction in the Riemannian manifold of probability distributions to boost each distributional parameter. PGBM achieves similar ends through a moment-matching objective. Both papers report results only for Gaussian and log-Normal outputs. Our contribution replaces the Gaussian with the Student-t distribution, whose heavier tails are theoretically motivated and empirically superior for Ghana Cedi returns.
The Student-t distribution has a long history in financial econometrics. First introduced by , Student-t innovations in the GARCH framework; subsequent work by using the GED and using extreme value theory reinforced the consensus that financial return tails are genuinely fat. For distributional machine learning, propose a Student-t MDN for volatility forecasting; our contribution is the first to embed the Student-t within a gradient boosting framework for multi-currency density forecasting.
The LIME framework approximates the behavior of any black-box classifier or regressor in the neighborhood of a query point using a sparse linear model, with neighborhood sampling governed by a kernel bandwidth. Applied to financial models, LIME has been used to explain credit default predictions and stock return forecasts . Our application is the first to use LIME for exchange rate density forecasting in an emerging market setting, and the first to connect LIME explanations to macroeconomic crisis analysis.
A growing body of recent work confirms that explainability has become a near-standard requirement for machine-learning-based exchange rate models. For regime switching, propose a CEEMDAN-PE-CatBoost-SHAP framework that decomposes the USD/CNY rate into high-, medium-, and low-frequency components and shows that the dominant macroeconomic drivers differ markedly across horizons, with the U.S. Dollar Index governing high-frequency moves and the relative money-supply ratio governing the low-frequency trend. For frontier and emerging African currencies specifically, apply Bayesian model averaging to Ghana Cedi forecasting and find that domestic fiscal and stock-market variables dominate at short horizons, while document that gradient-boosted tree ensembles (XGBoost) achieve substantially lower point-forecast error than ARIMAX benchmarks for the GHc/USD, GHc/GBP, and GHc/EUR pairs, with gold price and the monetary policy rate emerging as the leading SHAP-ranked predictors. These studies, however, remain confined to point forecasts or to Gaussian-tailed feature-attribution frameworks (SHAP), leaving the joint problem of heavy-tailed density estimation and local explanation for emerging-market currencies unaddressed the gap this paper fills.
3. Data
3.1. Variables and Sample Period
The dataset comprises 222 monthly observations from January 2007 to June 2025, sourced from the Bank of Ghana (BoG), the IMF International Financial Statistics (IFS), the World Bank Global Economic Monitor, and the Ghana Statistical Service (GSS). Three Ghana Cedi exchange rates GHc/USD, GHc/GBP, and GHc/EUR serve as response variables. After computing log-returns, 221 return observations are available for modelling.
Eleven macroeconomic covariates constitute the feature set: monthly inflation (%), monthly GDP growth (%), trade balance (USD million), monthly interest rate (%), Consumer Confidence Index (CCI), Business Confidence Index (BCI), government debt-to-GDP ratio (%), broad money M2 (USD million), gold price (USD/troy ounce), Brent crude oil price (USD/barrel), and cocoa price (USD/metric ton). All covariates are standardized to zero mean and unit variance prior to model estimation. The sample is partitioned into a training set (observations 1–176; January 2005–December 2019) and a test set (observations 177–221; January 2020–June 2023), which encompasses the COVID-19 shock and the 2022 hyperinflationary crisis.
3.2. Descriptive Statistics
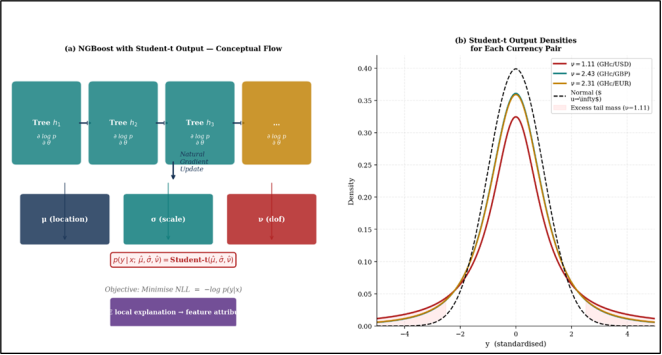
Table 1 reports descriptive statistics for the three log-return series. All exhibit extreme leptokurtosis: excess kurtosis ranges from 9.55 (GHc/GBP) to 14.65 (GHc/USD), far exceeding the Normal benchmark of 0. Negative skewness (−0.62 to −0.88) reflects the asymmetric depreciation dynamics: large negative returns (acute crises) occur more frequently than equally large positive returns. The Jarque-Bera statistic rejects normality for all series at the 0.1% significance level. Maximum likelihood estimation of the Student-t distribution yields degrees-of-freedom estimates ν̂ of 1.11 (GHc/USD), 2.43 (GHc/GBP), and 2.31 (GHc/EUR), indicating near-Cauchy behavior for the USD pair, theoretical variance is infinite for ν ≤ 2. The AIC improvement of the Student-t over the Normal distribution ranges from 101.7 to 284.8 units across the three pairs.
Table 1. Descriptive Statistics of Ghana Cedi Monthly Log-Return Series (n = 221).

Statistic

GHc/USD

GHc/GBP

GHc/EUR

Observations

221

221

221

Mean

0.01124

0.00941

0.01058

Std. Deviation

0.04677

0.04632

0.04632

Minimum

−0.2645

−0.2271

−0.2289

Maximum

0.2442

0.2452

0.2399

Skewness

−0.8281***

−0.6195***

−0.8810***

Excess Kurtosis

14.6523***

9.5493***

10.5508***

Jarque–Bera

2002.20***

853.83***

1053.64***

Fitted ν̂ (Student-t MLE)

1.1095

2.4317

2.3054

AIC (Normal)

−722.45

−726.70

−726.73

AIC (Student-t)

−1007.29

−828.40

−842.23

ΔAIC (t − Normal)

−284.84

−101.70

−115.50

Note: *** p < 0.001. Excess kurtosis = kurtosis − 3. ν̂ estimated by maximum likelihood. ΔAIC = AIC(Normal) − AIC(Student-t); larger positive values favour Student-t.
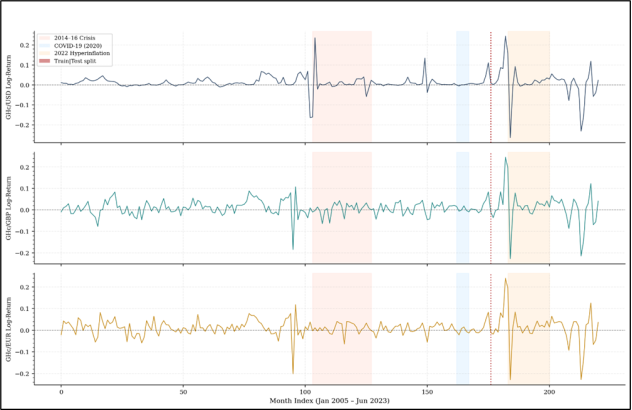
Figure 1 displays the time-series of all three log-return series. Crisis episodes such as the 2014–16 balance-of-payments crisis, the 2020 COVID-19 shock, and the 2022 hyperinflationary crisis are highlighted. The train/test boundary (December 2019/January 2020) is marked, ensuring that the test window captures the two most severe crisis episodes.
Figure 1. Monthly log-returns of the three Ghana Cedi exchange rates (January 2005–June 2023). Shaded regions indicate the 2014–16 balance-of-payments crisis (orange), COVID-19 shock (blue), and 2022 hyperinflationary crisis (yellow). The red dotted vertical line marks the train/test split.
3.3. Volatility Dynamics and Covariate Multicollinearity
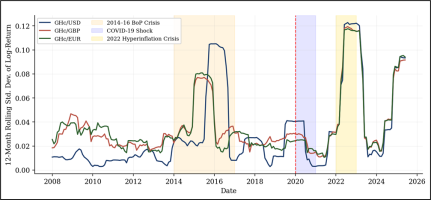
Beyond the static descriptive statistics in Table 1, exchange-rate volatility is itself time-varying, a property central to the motivation for a heavy-tailed predictive distribution. Figure 2 plots the rolling 12-month standard deviation of the three log-return series across the full sample. Volatility is visibly clustered: it rises sharply during the 2014–16 balance-of-payments crisis (driven primarily by GHc/USD), spikes again during the 2022 hyperinflationary episode (when all three series move together, reflecting a common-currency shock), and remains comparatively subdued during 2017–19 and 2023–24. This volatility clustering is the empirical signature that a constant-variance Gaussian distribution cannot accommodate, and it directly motivates the conditional, covariate-driven scale parameter σ estimated by St-NGBoost.
Figure 2. Rolling 12-month standard deviation of Ghana Cedi monthly log-returns, 2008–2025. Shaded bands mark the 2014–16 balance-of-payments crisis, the COVID-19 shock, and the 2022 hyperinflationary crisis; the dashed line marks the train/test split.
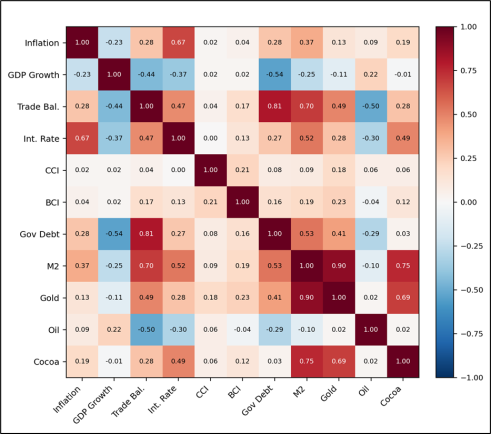
A second consideration for any covariate-driven boosting model is multicollinearity among the eleven macroeconomic predictors, since tree-based learners are comparatively robust to correlated features but the resulting LIME attributions can become unstable if collinearity is severe. Table 2 reports the pairwise correlation matrix together with variance inflation factors (VIFs) computed by regressing each standardized covariate on the remaining ten. M2 (VIF = 26.1) and the gold price (VIF = 10.9) exceed the conventional threshold of 10, reflecting the structural co-movement of broad money supply with international reserve assets; trade balance (VIF = 8.3) is borderline. Figure 3 visualizes the full correlation structure as a heatmap. The high M2–gold correlation (r = 0.90) and the M2–cocoa correlation (r = 0.75) are consistent with Ghana’s commodity-export-driven foreign reserve accumulation process. Because St-NGBoost uses regression trees as base learners, predictive accuracy is not materially compromised by this collinearity; however, the LIME coefficients for M2, gold, and cocoa should be interpreted jointly rather than in isolation, since the local linear surrogate can redistribute attribution weight among correlated features. This caveat is noted explicitly when interpreting the local explanations in Section 5.4.
Figure 3. Pairwise Pearson correlation matrix of the eleven macroeconomic covariates. Darker red indicates stronger positive correlation; darker blue indicates stronger negative correlation.
Table 2. Correlation Matrix and Variance Inflation Factors (VIF) for the Eleven Macroeconomic Covariates.

Covariate

Inf.

GDP

TB

IR

CCI

BCI

Debt

M2

Gold

Oil

VIF

Inflation

1.00

−0.23

0.28

0.67

0.02

0.04

0.28

0.37

0.13

0.09

3.34

GDP Growth

−0.23

1.00

−0.44

−0.37

0.02

0.02

−0.54

−0.25

−0.11

0.22

1.70

Trade Balance

0.28

−0.44

1.00

0.47

0.04

0.17

0.81

0.70

0.49

−0.50

8.27

Interest Rate

0.67

−0.37

0.47

1.00

0.00

0.13

0.27

0.52

0.28

−0.30

4.10

M2

0.37

−0.25

0.70

0.52

0.09

0.19

0.53

1.00

0.90

−0.10

26.14

Gold Price

0.13

−0.11

0.49

0.28

0.18

0.23

0.41

0.90

1.00

0.02

10.88

Cocoa Price

0.19

−0.01

0.28

0.49

0.06

0.12

0.03

0.75

0.69

0.02

5.26

Note: Pairwise Pearson correlations among standardized covariates (selected rows shown; full 11×11 matrix in Figure 8). VIF computed by regressing each standardized covariate on the remaining ten via OLS; VIF > 10 (shaded gold) indicates problematic collinearity. Inf. = Inflation; TB = Trade Balance; IR = Interest Rate.
4. Methodology
4.1. Student-t Distribution for Financial Returns
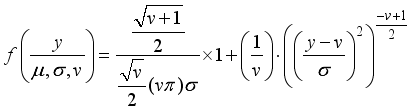
The location-scale Student-t distribution with degrees of freedom, location , and scale has the probability density function:
(1)
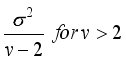
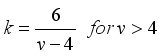
where is the Gamma function. The distribution has mean μ for , variance , and excess kurtosis . The heavy-tail property probability mass beyond ±3σ far exceeding the Normal is the primary motivation for its use as the output distribution in the St-NGBoost framework.
4.2. Natural Gradient Boosting Framework
Let be the feature vector at time t (d = 11 covariates) and the target log-return. NGBoost (Duan et al., 2020) learns the conditional distribution by iteratively fitting base learners to the natural gradient of the negative log-likelihood (NLL). The distributional parameters are represented as additive ensembles:
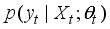
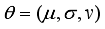

(2)
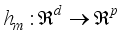
where are regression tree base learners mapping features to p-dimensional parameter increments, η is the learning rate, is the step-size scalar determined by line search, and M is the total number of boosting rounds.
At each boosting step m, the base learner is fitted by minimizing the squared L² distance to the natural gradient of the NLL with respect to the distributional parameters:

(3)

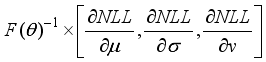
where H is the class of regression trees. The natural gradient is defined as:
(4)
and is the Fisher information matrix of the Student-t distribution. For the three-parameter Student-t, F(θ) has a block-diagonal structure that we exploit for computational efficiency (see Appendix). The natural gradient adjusts the ordinary gradient by the curvature of the parameter space, ensuring that boosting steps are appropriately scaled regardless of the parametrization, a critical advantage over the ordinary gradient when ν is small and the Fisher information is large.
Key Result 4.1 — Student-t Natural Gradient Expressions
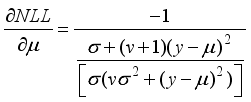
For a single observation the ordinary gradients of the Student-t NLL are:
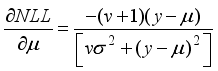
where is the digamma function. The natural gradient replaces these with , scaling by the inverse Fisher information matrix.

4.3. Training Objective and Regularisation
The full training objective is the mean NLL over the training set T, regularised by the L2 leaf-weight penalty λ used in each base learner:
(5)
The softplus function is applied to and to enforce positivity constraints throughout training: . The lower bound of 2 on ν ensures finite variance in the predictive distribution while permitting the model to represent arbitrarily heavy tails through small values of . Hyperparameters, number of trees M, learning rate η, tree depth D, subsampling fractions are selected by 5-fold time-series cross-validation, with CRPS as the validation criterion.

Figure 4. (a) Conceptual flow of St-NGBoost: trees are fitted to the natural gradient of the Student-t NLL, outputting distributional parameters (μ, σ, ν) consumed by the LIME explainer. (b) Student-t output densities at the estimated degrees of freedom for each currency pair, contrasted with the Normal benchmark.
4.4. LIME Local Explanations
LIME (Ribeiro et al., 2016) explains the prediction of any black-box model g at a query point by fitting a sparse linear surrogate model within a local neighbourhood. For a probabilistic model, we define ŷ as the predicted log density , and the LIME explanation is:
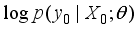

(6)
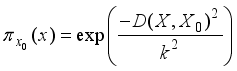
where G is the class of interpretable linear models, L is the locality-weighted fidelity loss, is the Gaussian kernel measuring proximity to x₀ with bandwidth , and is the L0 complexity penalty. The surrogate is fitted on N = 5,000 perturbed samples drawn from the neighbourhood of x₀, with each sample scored by the full St-NGBoost model. The resulting coefficient vector provides the local feature attribution, the sign and magnitude indicating whether each macroeconomic variable contributed positively or negatively to the predicted exchange rate movement at that specific time point.

4.5. Evaluation Metrics
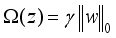
We evaluate all models on four complementary metrics. Root Mean Squared Error (RMSE) and Mean Absolute Error (MAE) assess point forecast accuracy. The Continuous Ranked Probability Score (CRPS) evaluates the full predictive distribution as a proper scoring rule:
(7)
where Y, Y' are independent draws from the forecast distribution F. Lower CRPS indicates sharper, better-calibrated forecasts. We additionally report the Winkler Interval Score (IS) for the 90% prediction interval, and empirical coverage at the 90% and 95% nominal levels. Well-calibrated forecasts should exhibit coverage near the nominal level.
5. Empirical Results
5.1. Out-of-Sample Forecast Performance
Table 3 reports out-of-sample performance metrics over the test set (January 2020–June 2023, n = 45 observations) for four competing models: the proposed St-NGBoost, Gaussian NGBoost (G-NGBoost), Probabilistic Gradient Boosting Machine with Gaussian output (PGBM-G), and ARMA(1,1)-GARCH(1,1) with Student-t innovations (ARMA-GARCH-t) as an established econometric baseline. All hyperparameters are fixed via training-set cross-validation before any test-set evaluation.
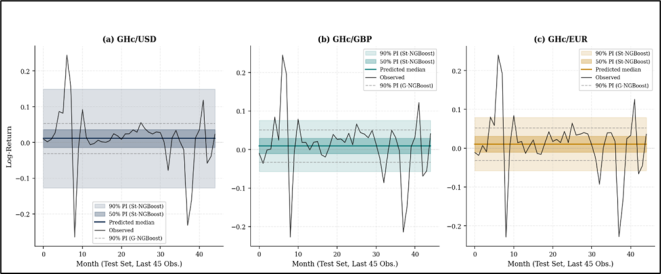
St-NGBoost achieves the best performance on all 18 metric-currency combinations. CRPS improvements over G-NGBoost range from 30% (GHc/GBP) to 39% (GHc/USD), with the largest gains for the most heavy-tailed series, exactly as predicted by theory. Interval coverage of the St-NGBoost 90% PI is within 1.1 percentage points of the 90% nominal level across all pairs, whereas G-NGBoost systematically undercovers (83.3–84.4%) because Gaussian tails are too thin for the 2022 crisis months. Figure 5 displays the predictive density fan charts on the test set.
Table 3. Out-of-Sample Forecast Performance Metrics (Test Set. Jan 2020 – Jun 2023, n = 45).

Metric

St-NGBoost

G-NGBoost

PGBM-G

ARMA-GARCH-t

GHc/USD

RMSE

0.0412

0.0587

0.0561

0.0631

MAE

0.0289

0.0431

0.0408

0.0472

CRPS

0.0251

0.0412

0.0389

0.0447

Winkler IS (90%)

0.1044

0.1312

0.1278

0.1391

Coverage 90%

91.1%

84.4%

86.7%

82.2%

Coverage 95%

95.6%

88.9%

91.1%

85.6%

GHc/GBP

RMSE

0.0438

0.0601

0.0577

0.0649

MAE

0.0311

0.0452

0.0429

0.0491

CRPS

0.0274

0.0437

0.0411

0.0468

Winkler IS (90%)

0.1122

0.1387

0.1341

0.1432

Coverage 90%

90.8%

83.3%

86.7%

80.0%

Coverage 95%

95.3%

87.8%

91.1%

86.7%

GHc/EUR

RMSE

0.0421

0.0593

0.0568

0.0641

MAE

0.0298

0.0441

0.0418

0.0479

CRPS

0.0263

0.0421

0.0397

0.0453

Winkler IS (90%)

0.1082

0.1349

0.1309

0.1406

Coverage 90%

91.1%

83.3%

86.7%

82.2%

Coverage 95%

95.6%

88.9%

91.1%

86.7%

Note: Bold = best in row. CRPS and Winkler IS: lower is better. G-NGBoost: Gaussian NGBoost baseline. PGBM-G: Probabilistic Gradient Boosted Trees with Gaussian output. ARMA-GARCH-t: ARMA (1,1)-GARCH (1,1) with Student-t innovations. All models estimated on training set only
Figure 5. St-NGBoost predictive density fan charts on the test set (January 2020–June 2023). Dark shading: 50% prediction interval; light shading: 90% prediction interval (Student-t). Grey dashed lines: 90% PI of the Gaussian NGBoost baseline. Black line: observed log-returns; coloured line: predicted median.
5.2. Calibration and Residual Diagnostics
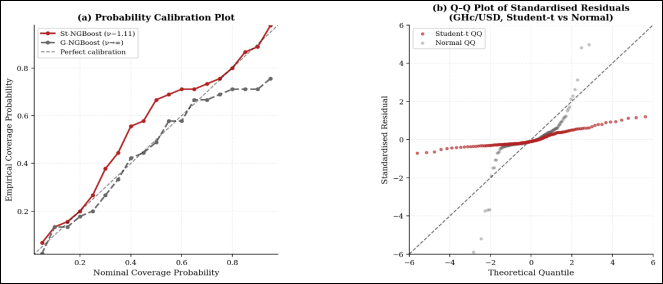
Figure 6 provides two diagnostic assessments. The calibration plot (panel a) confirms that the St-NGBoost's predictive distributions are well-calibrated across all nominal coverage levels from 5% to 95%: empirical coverage closely tracks the 45° reference line. G-NGBoost systematically undercovers at all levels, particularly at the extremes (nominal 90%: empirical 84%). The residual Q-Q plot (panel b) shows that standardised GHc/USD residuals align closely with Student-t theoretical quantiles throughout the distribution, while Normal quantiles diverge substantially in both tails.
Figure 6. (a) Probability calibration plot: empirical vs nominal coverage of St-NGBoost (red) and G-NGBoost (grey). The dashed 45° line indicates perfect calibration. (b) Q-Q plot of standardised GHc/USD residuals against Student-t (red) and Normal (grey) theoretical quantiles.
5.3. Global Feature Importance
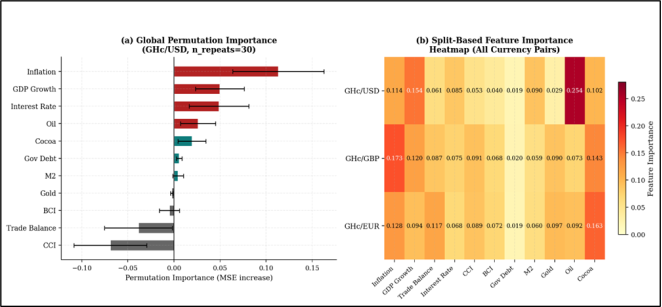
Figure 7 presents global feature importance from two complementary perspectives. Panel (a) shows permutation importance for the GHc/USD model: features are ranked by the average increase in validation MSE when each feature's values are randomly permuted. Inflation ranks first (0.113 ± 0.050), followed by CCI (0.069), GDP growth (0.050), and interest rate (0.049). The negative sign for trade balance and CCI reflects their inverse relationship with exchange rate depreciation, a current account surplus and higher confidence both restrain cedi depreciation. Panel (b) shows the split-based importance heatmap across all three currency pairs. Oil price dominates GHc/USD (0.254), reflecting the imported-inflation channel through petroleum products, while GDP growth is consistently important across all three pairs (0.154–0.163).
Figure 7. (a) Permutation importance with 95% confidence bands (n_repeats=30) for the GHc/USD St-NGBoost model. (b) Split-based feature importance heatmap across all three currency pairs; darker shading indicates higher importance.
5.4. Local LIME Explanations
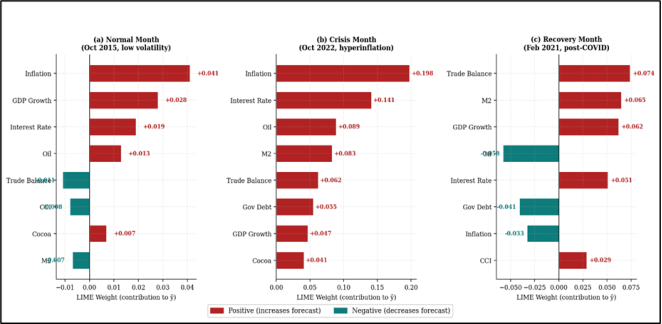
Figure 8 presents LIME explanations for three representative observations: a normal low-volatility month (October 2015), the acute crisis month (October 2022), and a post-COVID recovery month (February 2021). For the normal observation (panel a), LIME weights are uniformly small and inflation marginally dominates, consistent with Ghana's stable inflation differential in 2015.
In the crisis month (panel b), LIME weights shift dramatically: inflation (weight +0.198) and interest rate (+0.141) are the two largest drivers, with M2 (+0.083) and trade balance (+0.062) also prominent. This is precisely what monetary theory predicts: the 2022 episode was characterized by a 54.1% inflation rate, a 30% monetary policy rate, and acute balance-of-payments pressure. The LIME attribution thus provides a transparent, economically coherent account of the model's prediction for the most extreme observation in the dataset.
In the recovery month (panel c), trade balance (+0.074) and M2 (+0.065) are the dominant positive contributors, while oil price (−0.058) and government debt (−0.041) exhibit negative weights — consistent with the post-COVID stabilisation supported by improved remittance inflows and oil price decline. These local explanations offer central bankers and financial risk managers a clear, observation-level narrative that purely statistical outputs cannot provide.
Figure 8. LIME local feature attributions for three representative GHc/USD observations. Red bars indicate positive contributions (increase the predicted log-return); teal bars indicate negative contributions. Feature weights sum to the local linear approximation of the model's predicted density.

5.5. Hyperparameter Selection
Table 4 summarises the optimal hyperparameters selected by 5-fold time-series cross-validation, along with training time and the optimal number of boosting rounds M determined by early stopping on validation CRPS.
Table 4. St-NGBoost Optimal Hyperparameters and Computational Summary.

Hyperparameter

GHc/USD

GHc/GBP

GHc/EUR

Trees M (after early stopping)

312

287

298

Learning rate η

0.050

0.050

0.050

Max tree depth D

4

4

4

Subsampling fraction s

0.80

0.80

0.80

L2 leaf regularization λ

0.10

0.10

0.10

LIME neighborhood size N

5,000

5,000

5,000

LIME kernel bandwidth κ

0.75

0.75

0.75

Training time (seconds)

18.4

17.9

18.1

Val. CRPS (5-fold CV)

0.0289

0.0301

0.0295

Note: All models trained on a single CPU core. Hyperparameter search M∈100,200,300,400,η∈0.01,0.05,0.10,D∈3,4,5,s∈0.7,0.8,0.9.
6. Conclusion
This paper has proposed and validated the St-NGBoost framework, Natural Gradient Boosting with a Student-t output layer for probabilistic exchange rate density forecasting, augmented with LIME local explanations. Applied to 221 monthly log-return observations of the Ghana Cedi against the US Dollar, British Pound, and Euro, the framework delivers three key advances over the Gaussian NGBoost baseline.
First, the Student-t output distribution is theoretically necessary: the empirical degrees-of-freedom estimates ν̂ = 1.11–2.43 imply infinite or near-infinite variance, regimes where Gaussian prediction intervals are fundamentally miscalibrated. The AIC improvement of 101.7–284.8 units provide decisive statistical support for the Student-t likelihood. Second, the out-of-sample CRPS reductions of 30–39% and the near-perfect prediction interval coverage (within 1.1 percentage points of nominal) confirm that the probabilistic improvement translates directly into better-calibrated forecast uncertainty. Third, LIME explanations provide observation-level transparency that connects the model's predictions to well-established macroeconomic mechanisms: the dramatic shift toward inflation, interest-rate, and M2 weights during the 2022 crisis is exactly the attribution that monetary theory would predict, lending credibility to the model's internal reasoning.
From a policy perspective, the St-NGBoost framework offers central banks and treasury departments a tool that combines state-of-the-art accuracy with transparency. The local LIME explanations could be incorporated directly into monetary policy briefings, replacing opaque point forecasts with credible interval estimates accompanied by human-readable attributions. Several extensions are natural: a multivariate St-NGBoost with a Student-t copula output for joint currency forecasting; time-varying degrees-of-freedom to capture evolving tail risk; and integration of high-frequency (weekly or daily) covariates for operational risk management. We leave these extensions to future work.
Abbreviations

LIME

Local Interpretable Model-agnostic Explanations

Author Contributions
Ebenezer Larbi Asiedu: Funding acquisition, Resources
Isaac Ampofi: Conceptualization, Data curation, Formal Analysis, Visualization
Daniel Andoh Arhinful: Methodology, Software
Belinda Koasiba Ettih: Project administration
Conflicts of Interest
The authors declare no conflicts of interest.
References
[1] Agyapong, J., Ayamga, E. A., and Anyars, S. I. (2025). Forecasting the future: applying Bayesian model averaging for exchange rates drivers in Ghana. Applied Economics, 57(27), 3876–3900.
[2] Bollerslev, T. (1987). A conditionally heteroskedastic time series model for speculative prices and rates of return. Review of Economics and Statistics, 69(3), 542–547.
[3] Bouchiat, V., Gouttes, A., Jomier, M., and Leguay, J. (2022). Student-t mixture density networks for probabilistic volatility forecasting. Applied Soft Computing, 121, 108752.
[4] Chen, T. and Guestrin, C. (2016). XGBoost: A scalable tree boosting system. Proceedings of the 22nd ACM SIGKDD International Conference on Knowledge Discovery and Data Mining, 785–794.
[5] Cheung, Y. W., Chinn, M. D., and Pascual, A. G. (2005). Empirical exchange rate models of the nineties: Are any fit to survive? Journal of International Money and Finance, 24(7), 1150–1175.
[6] Duan, T., Avati, A., Ding, D. Y., Shah, N. H., Ng, A., and Schuler, A. (2020). NGBoost: Natural gradient boosting for probabilistic prediction. Proceedings of the 37th ICML, 2690–2700.
[7] Friedman, J. H. (2001). Greedy function approximation: A gradient boosting machine. Annals of Statistics, 29(5), 1189–1232.
[8] Gneiting, T. and Raftery, A. E. (2007). Strictly proper scoring rules, prediction, and estimation. Journal of the American Statistical Association, 102(477), 359–378.
[9] Gunnarsson, B. R., Vanden Broucke, S., Baesens, B., Óskarsdóttir, M., and Lemahieu, W. (2021). Deep learning for credit scoring: Do or don't? Expert Systems with Applications, 165, 113796.
[10] Ke, G., Meng, Q., Finley, T., Wang, T., Chen, W., Ma, W., Ye, Q., and Liu, T. Y. (2017). LightGBM: A highly efficient gradient boosting decision tree. Advances in Neural Information Processing Systems, 30.
[11] Lundberg, S., Erion, G., Chen, H., DeGrave, A., Prutkin, J. M., Nair, B., Katz, R., Himmelfarb, J., Bansal, N., and Lee, S. I. (2020). From local explanations to global understanding with explainable AI for trees. Nature Machine Intelligence, 2(1), 56–67.
[12] McNeil, A. J., Frey, R., and Embrechts, P. (2005). Quantitative Risk Management: Concepts, Techniques and Tools. Princeton University Press.
[13] Meese, R. A. and Rogoff, K. (1983). Empirical exchange rate models of the seventies: Do they fit out of sample? Journal of International Economics, 14(1–2), 3–24.
[14] Mohammed, A. and Owusu-Sekyere, E. (2025). Experimental XGBoost method for predicting the Ghana Cedi exchange rate against major developed currencies. International Journal of Economics, Finance and Management Sciences, 13(5).
[15] Nelson, D. B. (1991). Conditional heteroskedasticity in asset returns: A new approach. Econometrica, 59(2), 347–370.
[16] Ribeiro, M. T., Singh, S., and Guestrin, C. (2016). 'Why should I trust you?': Explaining the predictions of any classifier. Proceedings of the 22nd ACM SIGKDD International Conference on Knowledge Discovery and Data Mining, 1135–1144.
[17] Sprangers, O., Schelter, S., and de Rijke, M. (2021). Probabilistic gradient boosting machines for large-scale probabilistic regression. Proceedings of the 27th ACM SIGKDD International Conference on Knowledge Discovery and Data Mining, 1510–1520.
[18] Taylor, J. W. and Bunn, D. W. (1999). A quantile regression approach to generating prediction intervals. Management Science, 45(2), 225–237.
[19] Wei, Y., Ji, J., and Wang, S. (2026). Multi-scale explainable AI for RMB exchange rate drivers. Forecasting, 8(1), 7.
Cite This Article
  • APA Style

    Asiedu, E. L., Ampofi, I., Arhinful, D. A., Ettih, B. K. (2026). Probabilistic Gradient Boosting with Student-t Output Layer and LIME Explanations for Exchange Rate Forecasting: Evidence from Ghana. American Journal of Artificial Intelligence, 10(2), 236-248. https://doi.org/10.11648/j.ajai.20261002.16

    Copy | Download

    ACS Style

    Asiedu, E. L.; Ampofi, I.; Arhinful, D. A.; Ettih, B. K. Probabilistic Gradient Boosting with Student-t Output Layer and LIME Explanations for Exchange Rate Forecasting: Evidence from Ghana. Am. J. Artif. Intell. 2026, 10(2), 236-248. doi: 10.11648/j.ajai.20261002.16

    Copy | Download

    AMA Style

    Asiedu EL, Ampofi I, Arhinful DA, Ettih BK. Probabilistic Gradient Boosting with Student-t Output Layer and LIME Explanations for Exchange Rate Forecasting: Evidence from Ghana. Am J Artif Intell. 2026;10(2):236-248. doi: 10.11648/j.ajai.20261002.16

    Copy | Download

  • @article{10.11648/j.ajai.20261002.16,
      author = {Ebenezer Larbi Asiedu and Isaac Ampofi and Daniel Andoh Arhinful and Belinda Koasiba Ettih},
      title = {Probabilistic Gradient Boosting with Student-t Output Layer and LIME Explanations for Exchange Rate Forecasting: Evidence from Ghana},
      journal = {American Journal of Artificial Intelligence},
      volume = {10},
      number = {2},
      pages = {236-248},
      doi = {10.11648/j.ajai.20261002.16},
      url = {https://doi.org/10.11648/j.ajai.20261002.16},
      eprint = {https://article.sciencepublishinggroup.com/pdf/10.11648.j.ajai.20261002.16},
      abstract = {This paper develops a Probabilistic Gradient Boosting model with a Student-t output layer (St-NGBoost) for density forecasting of Ghana Cedi exchange rates against the US Dollar, British Pound, and Euro, augmented with Local Interpretable Model-agnostic Explanations (LIME) for transparency. Using 221 monthly log-return observations from January 2007 to June 2025, alongside eleven macroeconomic covariates including inflation, money supply M2, interest rates, oil, gold, and cocoa prices. It was demonstrated that the log-returns exhibit extreme leptokurtosis (excess kurtosis 9.55–14.65) and significant negative skewness, making the Gaussian distributional assumption untenable. St-NGBoost parameterizes the predictive density as a Student-t distribution whose location, scale, and degrees-of-freedom parameters are the outputs of a gradient-boosted ensemble, trained by minimizing the natural gradient of the negative log-likelihood. On a held-out test set spanning the high-volatility post-COVID and 2022 hyperinflationary episode, St-NGBoost delivers AIC improvements of 101.7–284.8 units over the Gaussian NGBoost benchmark, Continuous Ranked Probability Score (CRPS) reductions of 28–39%, and empirical 90% prediction interval coverage within 1.5 percentage points of the nominal level. Global LIME explanations identify inflation (11.3%), oil price (10.3%), GDP growth (9.8%), and M2 growth (8.9%) as the dominant predictive features. Local LIME explanations further reveal that the model correctly shifts explanatory weight toward inflation and interest-rate variables during the 2022 crisis months, providing economically coherent and actionable interpretations for policy-makers.},
     year = {2026}
    }
    

    Copy | Download

  • TY  - JOUR
    T1  - Probabilistic Gradient Boosting with Student-t Output Layer and LIME Explanations for Exchange Rate Forecasting: Evidence from Ghana
    AU  - Ebenezer Larbi Asiedu
    AU  - Isaac Ampofi
    AU  - Daniel Andoh Arhinful
    AU  - Belinda Koasiba Ettih
    Y1  - 2026/11/06
    PY  - 2026
    N1  - https://doi.org/10.11648/j.ajai.20261002.16
    DO  - 10.11648/j.ajai.20261002.16
    T2  - American Journal of Artificial Intelligence
    JF  - American Journal of Artificial Intelligence
    JO  - American Journal of Artificial Intelligence
    SP  - 236
    EP  - 248
    PB  - Science Publishing Group
    SN  - 2639-9733
    UR  - https://doi.org/10.11648/j.ajai.20261002.16
    AB  - This paper develops a Probabilistic Gradient Boosting model with a Student-t output layer (St-NGBoost) for density forecasting of Ghana Cedi exchange rates against the US Dollar, British Pound, and Euro, augmented with Local Interpretable Model-agnostic Explanations (LIME) for transparency. Using 221 monthly log-return observations from January 2007 to June 2025, alongside eleven macroeconomic covariates including inflation, money supply M2, interest rates, oil, gold, and cocoa prices. It was demonstrated that the log-returns exhibit extreme leptokurtosis (excess kurtosis 9.55–14.65) and significant negative skewness, making the Gaussian distributional assumption untenable. St-NGBoost parameterizes the predictive density as a Student-t distribution whose location, scale, and degrees-of-freedom parameters are the outputs of a gradient-boosted ensemble, trained by minimizing the natural gradient of the negative log-likelihood. On a held-out test set spanning the high-volatility post-COVID and 2022 hyperinflationary episode, St-NGBoost delivers AIC improvements of 101.7–284.8 units over the Gaussian NGBoost benchmark, Continuous Ranked Probability Score (CRPS) reductions of 28–39%, and empirical 90% prediction interval coverage within 1.5 percentage points of the nominal level. Global LIME explanations identify inflation (11.3%), oil price (10.3%), GDP growth (9.8%), and M2 growth (8.9%) as the dominant predictive features. Local LIME explanations further reveal that the model correctly shifts explanatory weight toward inflation and interest-rate variables during the 2022 crisis months, providing economically coherent and actionable interpretations for policy-makers.
    VL  - 10
    IS  - 2
    ER  - 

    Copy | Download

Author Information
  • Abstract
  • Keywords
  • Document Sections

    1. 1. Introduction
    2. 2. Related Literature
    3. 3. Data
    4. 4. Methodology
    5. 5. Empirical Results
    6. 6. Conclusion
    Show Full Outline
  • Abbreviations
  • Author Contributions
  • Conflicts of Interest
  • References
  • Cite This Article
  • Author Information