Research Article | | Peer-Reviewed

Soil Test Based Crop Response Phosphorus Calibration Study for Bread Wheat (Triticum aestivum L.) Production in Agarfa District Bale Highland, Oromia, Ethiopia

Received: 1 January 2026     Accepted: 23 January 2026     Published: 17 July 2026
Views:       Downloads:
Abstract

Ethiopia faces a wide set of soil fertility loss issues which are declining of soil fertility due to biological and environmental factors as well as blanket fertilizer application throughout the country without considering soil types and agro-ecological are among the factors that pronounced in low yielding of food crop production like bread wheat. To tackle this problem, site specific nutrients managements and soil test-based crop response fertilizer recommendations was conducted for three consecutive years during the main cropping seasons of (2015 – 2017 E.C). The objective of the experiment was to determine economically optimum Nitrogen, Phosphorus critical (Pc) and Phosphorus requirement factor (Prf) for bread wheat production in Agarfa district. The treatments consisted of factorial combinations of three levels of TSP (0, 100, and 200) kg ha-1 with five levels of nitrogen (0, 23, 46, 69, and 92 kg ha-1) that gave a total of fifteen treatments. However, in the second two consecutive years, the experiment was conducted to determine phosphorus critical (Pc) and phosphorus requirement factor (Pf), and the treatments consisted of six levels of phosphorus (0, 10, 20, 30, 40, and 50) kg ha-1 combined with a single level of nitrogen (69 kg ha-1). Composite soil sample before plating and intensive soil samples after 21 days of sowing were taken from each plot and analyzed for selected physicochemical properties following standard laboratory procedures. Phosphorus critical level (Pc) determination was done using Cate-Nelson diagram method. Agronomic data such as above ground biomass and grain yield was collected then subjected to two-way factorial analysis of variance (ANOVA) using R software while the partial budget analysis was done using CIMMYT procedure. The results indicate that combined NP fertilizer rates significantly influenced the agronomic parameters of bread wheat. Optimum nitrogen rate (69 N kg/ha), P critical concentration (28.0 ppm) and P requirement factor (4.15) for bread wheat production were determined at Agarfa District. Therefore, uses of 69 N kg/ha fertilizer for bread wheat production at Agarfa District and areas having similar soil conditions and agro-ecology is advisable. Farther verification of the result on farm land could be a pre request before disseminating the technology to the user.

Published in World Journal of Agricultural Science and Technology (Volume 4, Issue 3)
DOI 10.11648/j.wjast.20260403.12
Page(s) 52-60
Creative Commons

This is an Open Access article, distributed under the terms of the Creative Commons Attribution 4.0 International License (http://creativecommons.org/licenses/by/4.0/), which permits unrestricted use, distribution and reproduction in any medium or format, provided the original work is properly cited.

Copyright

Copyright © The Author(s), 2026. Published by Science Publishing Group

Keywords

Phosphorus, Bread Wheat, Cate and Nelson Graph, Nitrogen, Phosphorous Critical (Pc) Phosphorus Requirement Factor (Pf), Soil and Yield

1. Introduction
Wheat is a type of cereal crop cultivated for its grain and used worldwide as a staple food. Ethiopia is also one of the largest wheat producers in Sub-Saharan Africa and approximately 80% of the wheat area is planted to bread wheat . According to data published by , wheat is mostly farmed in Ethiopia's highlands, which are located between 6 and 16° N latitude and 35 and 42°E longitude, with elevations ranging from 1500 to 2800 m above sea level and mean minimum temperatures of 6°C to 11°C. Wheat production is crucial for both food security and economic stability in many emerging countries, particularly those like Ethiopia where falling soil fertility continues to impede agricultural productivity. However, severe deficits in soil nutrients are the main reason Ethiopia's wheat yield is still below its potential .
Due to erosion, leaching, and the lack of nutrient recycling, the majority of Ethiopian soils, particularly those in the highlands, have poor nutrient contents . In Ethiopia's highlands, degradation of soil fertility is one of the main problems affecting wheat production . Ethiopian soils are thought to be particularly lacking in nitrogen (N) and phosphorus (P) . Particularly in highland soils, phosphate (P) deficiency is a major problem that hinders grain formation, tillering, and root development. Similarly, using a lot of N fertilizer has been a way to boost yield, but it can be expensive and pollute the environment . Nowadays, a balanced fertilizer recommendation is of paramount importance in order to confirm the security and sustainably increase crop productivity for farmers and other stakeholders.
In the Bale Highlands of Oromia, including the Agarfa District, wheat faces unique challenges due to variable soil fertility and climatic conditions. Farmers in the study area uses blanket recommendations application which exposing farmers to increased production costs and cause depletion of soils plant nutrients. This calls for site-specific soil test-based Crop Response Phosphorus Calibration Study in Agarfa District of for bread wheat production. Each kind of plant has an ideal range of nutrients as well as a minimum essential quantity. Below this threshold, plants start to show symptoms of nutrient shortages. Poor growth can also be caused by toxicity from consuming too many nutrients. The proper application and arrangement of nutrients is therefore essential . Furthermore, according to , soil test calibration varies depending on the type of crop, climate, and crop variety. It also relates soil test measurement in terms of crop response . It is crucial that the results of soil tests be calibrated against crop responses from applications of the plant nutrients in question because this is the final indicator of a fertilization program. Instead of using the soil test-based crop response fertilizer application method, farmers in the majority of the country and the study area specifically applied fertilizers based on the blanket recommendation (100 kg ha-1 urea and 100 kg TSP ha-1). Therefore, this soil test-based crop response phosphorus calibration this study was undertaken with the following objectives:
Specific Objectives
1) To determine economically optimum N fertilizer for bread wheat production in Agarfa District.
2) To determine Phosphorus critical and phosphorus requirement factor for bread wheat production in Agarfa District.
2. Materials and Methods
2.1. Description of the Experimental Site
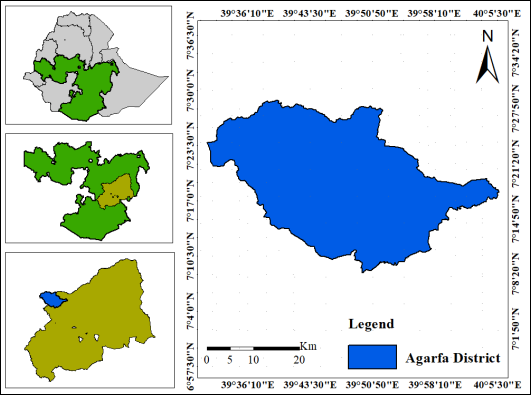
The study was conducted at Agarfa District which is one of the Bale highlands Oromia Regional State, Southeastern Ethiopia. Agarfa District is located in the northwestern corner of the Bale Zone, and bordered on the south by Sinana and Dinsho, on the west-by-west Arsi zone, on the north by the Shabelle River which separates it from the Arsi Zone, and on the east by Gaserana and Gololcha districts. Agarfa district is located about 460 km from the capital city of Finfine. Geographically, Agarfa District is located at 7° 11' 0'' to 7° 28' 0'' N and 39° 35' 0'' to 46° 0' 30'' E. Topographically, the elevation of Agarfa district ranges from 1400 m to 3800 m above mean sea level (a.m.s.l). About 61% of the district is plain with slope ranging from 0 to 8 degrees and the majority of this area lies in the southeastern and western parts of the study area .
2.2. Climate and Agro-ecology
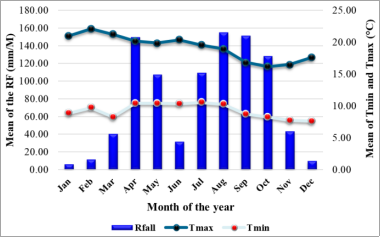
Agarfa District is characterized by bimodal rain fall patterns. The area is characterized by seasonal mean monthly rainfall varies from 6.11 to 155.11 mm, annual rainfall totals of between 661 mm and 1045 mm. Temperature maximum ranged from 17.31 to 22.5°C while minimum varied from 7.60 to 10.56°C. Agarfa District is predominantly dependent on rain-fed, subsistence agriculture along with rearing of livestock. Agriculture is the main economic activity in the district, with the major sources of their livelihood income mainly from crop cultivation. The major crops produced in the area are barley, wheat, teff, maize, beans, field pea and others.
Figure 1. Location Map of Agarfa District.
Figure 2. Mean monthly rain fall (mm), Max and Min Temperature (°C) in ten years (2014 to 2024) of Agarfa District.
2.3. Land Use and Farming System
Agriculture serves as the primary economic activity within the district, with crop cultivation being the principal source of livelihood for the local population. About 87.36% of the population lives in rural areas whose livelihood is pre dominantly dependent on rain-fed, subsistence agriculture along with rearing of livestock. Farmers in this region engage in a mixed farming approach that incorporates both crop production and livestock rearing. The predominant crops cultivated include cereals such as barley, wheat, maize, and teff, alongside pulses like chickpeas, soybeans, and lentils. Additionally, spices such as coriander and fenugreek, as well as vegetables including onions, potatoes, tomatoes, and peppers, are grown utilizing both rain-fed and irrigated methods. Cereal mono-cropping is particularly prevalent in the area .
2.4. Experimental Materials
1) Test Crop - bread wheat variety (Boku) was used as test crops.
2) TSP (46% P2O5) and Urea (46% N) was used as source of inorganic fertilizer.
2.5. Treatments, Experimental Design and Procedures
To obtained representative for experimental sites composite soil samples were collected from 22 farmers’ fields in Agarfa district, where bread wheat is a dominant crop. Based on available soil P values determined by the Olsen method, fields were categorized into very low, low, and moderate available soil P contents. Based on this classification, sites with low or below critical available P were selected for the experiment in the district. On-farm field experiments were conducted in Agarfa District for the three consecutive years during the main cropping seasons under rainfed (July to December) from 2015 to 2017 E.C. In the first year, factorial combination of five levels of N rates (0, 23, 46, 69 and 92 Kgha-1) and three rates of P (0, 30, and 40 Kgha-1) to determine optimum N rate that gave a total of fifteen treatments as shown in Table 1. However, by using the determined optimum Nitrogen (69 kg ha-1) at the first year; phosphorus critical (Pc) and phosphorus requirement factor (Pf) were determined in the second two consecutive years. So, the treatments consisted of six levels of phosphorus (0, 10, 20, 30, 40, and 50) kg ha-1 combined with a single level of nitrogen (69 kg ha-1) that gave a total of six treatments. The experiments were laid out in randomized complete block design (RCBD) with three replications and the gross plot size was 3 m x 4 m (12 m2) were used. Totally, 18 experimental unit was evaluated.
Table 1. Description of first year treatment combinations.

Treatments

N:P (Kg/ha)

T1=0:0

T2=0:0

T3=0:0

T4=23:0

T5=23:30

T6=23:40

T7=46:0

T8=46:30

T9=46:40

T10=69:0

T11=69:30

T12=69:40

T13=92:0

T14=92:30

T15=92:40

2.6. On Farm Management of the Experiment
Land preparation was done both using tractors and oxen. As per the specification of the design, a field layout was prepared. The land was leveled and made suitable for crop establishment. Sowing was done in mid-August from 2015 to 2017 E.C. at seed rate (150 kg/ha). Others agronomic managements like hand weeding, herbicide, disease/pest control and row planting in 20cm was done as recommended for the crop. A full dose of Triple supper phosphate (TSP or P2O5) and one-third of N alone was applied at sowing time as per the treatment. The remaining two-thirds of N alone was top-dressed at the mid-tillering crop stage.
2.7. Soil and Agronomic Data Collection and Measurement
2.7.1. Yield and Yield Component Parameters
Above ground dry biomass yield: The aboveground dry biomass yield was determined from plants harvested from the net plot area after sun drying to a constant weight and expressed in kg ha-1.
Grain yield: The grain yield was taken by harvesting and threshing the grain yield from net plot area. The yield was adjusted to 12.5% moisture content and expressed as yield in kg ha-1.
2.7.2. Soil Sample Collection and Analysis
After 21 day’s composite soil samples were collected from each plot by using soil auger from a depth of 0-20cm and selected soil physicochemical parameter was analyzed following laboratory standard protocol.
2.7.3. Determination of Critical P Concentration
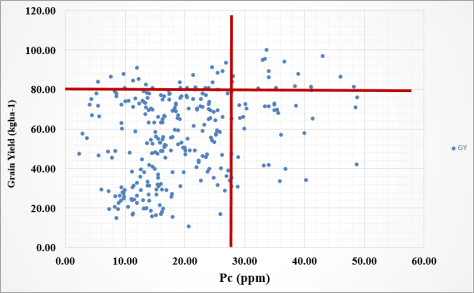
The diagram of the results is divided into four quadrants that maximize the number of points in the positive quadrants and minimize the number of points in the negative quadrants. The observations in the upper left quadrant overestimate the fertilizer P requirement while the observations in the lower right quadrant underestimate the fertilizer requirement. That means, critical phosphorus concentration is below which there is a response while above phosphorus was not respond. After 21 days to planting, the applied phosphorus during sowing is assumed to be ready to be utilized by the crop. Pc was determined by Cate-Nelson graphical methods where by putting phosphorus soil values on the X-axis (yield×100/maximum yield). Cate-Nelson graphical methods are based on driving the Y-X scatter diagram in to four quadrants and increasing the points in the positive quadrants and reducing the number of points in the negative quadrants .
Relative Grain Yield =Yield x100 Maximum Yield
2.7.4. Determination of Phosphorous Requirement Factor
The P requirement factor (Pf) enables one to determine the quantity of P required per hectare to raise the soil test by 1 mg/kg (1 part per million), and to determine the amount of fertilizer required per hectare to bring the level of available P above the critical level .
Finally, the value of P requirement factor (Pf) was calculated using available P values in samples taken from unfertilized and fertilized plots after 21 days starting from sowing date. The phosphorous requirement factor was expressed as:
Pf=Kg P appliedChange of soil P
Lastly, using Phosphorus requirement factor (Pf), Phosphorus critical level and initial P values (soil P value from composite soil sample before fertilization) rate of P fertilizer to be applied was calculated as follows:
Rate of P fertilizer to be applied= (Pc –Pi) × Pf.
Where, Pc=critical P concentration, Pi=initial P values and Pf=P requirement factor.
2.8. Data Analysis and Interpretation
All Collected soil and agronomic data were subjected to statistical analysis of variance using a generalized linear model (GLM) in R statistical software version 4.2.2 . Whenever the ANOVA detects significant differences at a 5% level between treatments, mean separation was conducted using fisher’s least significant difference test .
2.9. Economic Analysis
To identify economic feasibility of treatments, partial budget analysis was implemented and calculated the marginal rate of return (MRR) . Note only MRR was considered but also proper interaction effects of treatments were selected according to its highest net benefit obtained.
3. Result and Discussion
3.1. Status of Selected Soil Chemical Properties Before Planting
The research area's soil pH varied from 6.10 to 6.60 (Table 2), suggesting a reaction that was slightly acidic to almost neutral. assessed the soil organic matter (OM) level as low to moderate, with a range of 1.67% to 2.15% (Table 2). Available phosphorus (Av. P) levels varied from 2.72 to 8.12 mg/kg (Table 2). According to , the Olsen method established a rate for soils that ranged from very low to low.
Table 2. Selected soils physicochemical properties of Agarfa district.

Parameters

Mean

Min

Max

Rates

References

pH (H₂O)

6.37

6.10

6.60

slightly acidic to near-neutral

Jones (2003

OM (%

1.89

1.67

2.15

Low to Moderate

Tekalign (1991)

AvP (mg/kg)

5.19

2.72

8.12

very low to low

Cottenie (1980)

Where: OM = soil organic matter, Av.P = available phosphorus, Min = minimum, Max = maximum
3.2. Response of Bread Wheat Production to Combined Applications of Different NP Fertilizer Rates
The analysis of variance showed highly significantly (P<0.05) difference the total aboveground biomass yield of wheat due to combined application of phosphorus and nitrogen. The overall aboveground biomass production of wheat was significantly affected by the interaction between nitrogen and phosphorus fertilizer (Table 3). The interaction effect of 30 P (Kg ha-1) and 69 N (kgha-1) produced the highest aboveground biomass (15.26 t ha-1), while the control treatment produced the lowest aboveground biomass (10.93t ha-1) (Table 3). The result is in agreement with the report of who reported that, the highest (10.705-ton ha-1) and the lowest (7.365-ton ha-1) biomass yields were recorded by application of (40 kg P ha-1) with 69 N (kgha-1) and control plots respectively.
Table 3. Interaction effect of nitrogen and phosphorous (P2O5) fertilizers on bread wheat mean aboveground biomass (t/ha).

N (kgha-1)

Mean Aboveground Biomass (t ha-1)

P (kgha-1)

0

30

40

0

11.00bc

10.93c

14.40abc

23

12.00abc

12.46abc

14.00abc

46

13.53abc

12.93abc

13.23abc

69

15.13a

15.26a

15.06ab

92

14.66abc

14.46abc

14.33abc

Mean

13.56

LSD (0.05)

4.11

CV

18.14

Additionally, the analysis of variance showed that during the years of the calibration study, the combination effect of phosphorus fertilizer application rates with nitrogen had a highly significant (p < 0.05) impact on grain production (kgha-1) (Table 4). The combined application of 40 kg P ha-1 with N (69 kgha-1) produced the highest mean grain yield (5592.83) and control plots the lowest (2717.50 kg ha-1). The outcome is consistent with the observation that the combined application of 69/92 kg ha-1 nitrogen and phosphorus fertilizer, respectively, produced the highest grain production (5657.28 kg ha-1) .
Table 4. Responses of grain yield (kgha-1) the combination of Nitrogen and Phosphorus.

N (kgha-1)

P (kgha-1)

0

30

40

0

2717.50h

2862.33h

3114.67g

23

3441.50f

3628.67f

3828.83e

46

3826.17e

4164.50d

4641.67c

69

4243.43d

4851.00b

5592.83a

92

4488.83c

5013.17b

4231.67d

Mean

4043

LSD (0.05)

194.65

CV

12.90

3.3. Partial Budget Analysis
Table 5 summarized the profit from the production of bread wheat using integrated rates of fertilizer application of nitrogen and phosphorus. Marginal analysis was used on non-dominated treatments to determine which ones offered the best return on the farmer's investment. A treatment's 100% marginal rate of return (MRR) was thought to be the lowest acceptable rate of return for farmers to find it beneficial . Farmers must have access to information on treatment costs and benefits before they can embrace technological innovation. In order to create recommendations based on the agronomic data, this study evaluated the treatments' economic benefits. This helps farmers in the study area choose the optimal mix of resources.
The result in this study indicated that the treatments that received 40 kg ha-1 phosphorus with 69 kg ha-1 of nitrogen resulted in higher net benefits than control (Table 5). The highest net benefit of 218,510 ETB ha-1 with MRR of 1356% was obtained from the plot received 40 kg ha-1 phosphorus with 69 kg ha-1 of nitrogen, while the lowest net benefit of 110,059 ETB ha-1 was recorded from control treatment (Table 5).
Table 5. Partial budget Analysis of N rates for bread wheat.

N

P

AGY

GB

TVC

NB

MRR

0

0

2446

110059

-

110059

0

0

30

2576

115925

1500

114425

291

0

40

2803

126144

2000

124144

704

23

0

2827

127231

2000

125231

759

23

30

3266

146961

3500

143461

954

23

40

3356

151018

4000

147018

924

46

0

3084

138760

4000

134760

618

46

30

3748

168662

5500

163162

966

46

40

4178

187988

6000

181988

1199

69

0

3819

171859

6000

165859

930

69

30

4366

196466

7500

188966

1052

69

40

5034

226510

8000

218510

1356

92

0

4040

181798

8000

173798

797

92

30

4512

203033

9500

193533

879

92

40

3809

171383

10000

161383

513

Whereas: P- phosphorus, N- Nitrogen, AGY - adjusted grain yield, GB – Gross Benefit, MRR=marginal rate of return, TVC- total variable costs, NB - Net Benefit
3.4. Determination of Phosphorus Critical Concentration and P-Requirement Factor
Critical phosphorus (Pc): The phosphorus critical point for bread wheat production in Agarfa District was calculated using the Cate-Nelson graphical approach. As a result, the scatter diagram created using the relative grain yields of bread wheat and the subsequent soil test P values for all P rates (0-50 kg P ha-1) was used to calculate the critical P concentration (Pc). Therefore, for bread wheat production in the district where crops reached roughly 80% of their maximum, the P-Critical concentration above which crop response became minimum was 28.0 ppm (Figure 3). The quantity of phosphorus in kilograms needed to elevate the soil p by one part per million is known as the phosphorus demand factor. For the study region, the district's P requirement factor (Pf) was 4.76.
Figure 3. Graph of critical phosphorus (Pc) for bread wheat production.
Phosphorus Requirement Factor (Pf): The amount of phosphorus in kilograms required to increase the soil P by one part per million is known as the phosphorus requirement factor (Pf). After 21 days of each applied P-treatment, the average Olsen P-ppm and the phosphorus increase over the control were determined. The difference between the available soil test P values from plots that received 0-50 kg P ha-1 is used to calculate the P requirement factor (Pf). For 0 and 50 kg P ha-1, the available p vs. p fertilizer applied ranges from 14.01 to 24.85 ppm. At Agarfa District, the Pf of the treatment ranged from 4.56 to 5.03 and the overall average Pf of all treatments for bread wheat production was 4.15 (Table 6). This factor enables to determine the quantity of P required per hectare to raise the soil test by 1 ppm, and to determine the amount of fertilizer required per hectare to bring the level of available P above the critical level .
Table 6. Phosphorus requirement factor (Pf) for Bread wheat Production.

P Applied

Average Soil P

PI

Pf

0

14.01

-

-

10

16.2

2.19

4.56621

20

21.17

7.16

2.793296

30

22.03

8.02

3.740648

40

21.95

7.94

5.037783

50

24.85

10.84

4.612546

Average

4.15

4. Conclusion and Recommendation
Wheat is a type of cereal crop cultivated for its grain and used worldwide as a staple food. Ethiopia is also one of the largest wheat producers in Sub-Saharan Africa and approximately 80% of the wheat area is planted to bread wheat. However, wheat productivity in Ethiopia remains below its potential, largely due to widespread deficiencies in soil nutrients. Spatially, nitrogen (N) and phosphorus (P) are considered as the most deficient nutrients in soils of Ethiopia. Particularly in highland soils, phosphate (P) deficiency is a major problem that hinders grain formation, tillering, and root development. In the Bale Highlands of Oromia, including the Agarfa District, farmers were used blanket fertilizer recommendations which exposing farmers to increased production costs and cause depletion of soils plant nutrients. To solve the problem of crop production and soil productivity decline because site specific soil test-based crop response phosphorus calibration studies was conducted for three consecutive years (2015-2017 E.C.) among the good alternatives and basic option. The optimum N (69 N kgha-1), Pc (28 ppm) and Pf (4.15) determined during this studied advisable for bread wheat production in Agarfa district as well as extrapolation areas having the same soil conditions and agro-ecology recommended. Farther verification of the result on farmers’ field could be a prerequisite before disseminating the technology to the end user.
Abbreviations

RCBD

Randomized Complete Block Design

TSP

Triple Supper Phosphate

GLM

Generalized Linear Model

ANOVA

Analysis of Variance

MRR

Marginal Rate of Return

OM

Organic Matter

pH

Potential of Hydrogen

LSD

Least Significant Different

CV

Coefficient of Variation

Pc

Critical Phosphorus

Pf

Phosphorus Requirement Factor

Acknowledgments
We kindly thank Oromia Agricultural Research Institute (IQQO) for financial sponsorship and also Sinana Agricultural Research Center (SARC) for logistic support during experimenting. Also, would like to thank all staff members of Soil fertility improvement team for their support and unreserved effort during the excremental conduct.
Author Contributions
Girma Getachew: Conceptualization, Data curation, Formal Analysis, Investigation, Methodology, Visualization, Writing – original draft
Mulugeta Eshetu: Methodology, Software, Validation, Writing – review & editing
Regassa Gosa: Supervision, Project administration, Writing – review & editing
Tesfaye Ketama: Data curation, Investigation, Validation, Visualization
Conflicts of Interest
The authors declare no conflict of interests.
References
[1] Tadesse, W., Bishaw, Z., and Assefa, S. (2019). Wheat production and breeding in Sub-Saharan Africa: Challenges and opportunities in the face of climate change. International Journal of Climate Change Strategies and Management, 11(5), 696-715.
[2] Megersa Geleta, G. (2021). Assessing Climate Change Impacts on Wheat [Triticum Aestivum (L.)] and Barley [Hordeum Vulgare (L.)] Production and Potential Adaptation Options in Central Ethiopia (Doctoral Dissertation, Haramaya University).
[3] Abdulkadir, B., Kassa, S., Desalegn, T., Tadesse, K., and Haileselassie, M. (2016). Soil fertility management studies on wheat in Ethiopia: a review. Ethiopian Journal of Natural Resources, 16(1), 1-23.
[4] Tilahun Firomsa, Abdurahman Husien, Kafyalew Assefa, Tilahun Abera, Amante Lemma, et al (2020). Effect of phosphorus and determination of optimum nitrogen for bread wheat in Kofele District, West Arsi Zone of Oromia, Ethiopia, Journal of Scientific Agriculture. 4: 34-37.
[5] Bayeh M, and Berhane L. (2011). "Barley research and development in Ethiopia–an overview." Barley research and development in Ethiopia: 1.
[6] Agegneh G, Liben M, Molla A, Feyissa A, Bekele A, and Getaneh F (2011). Research achievements in soil fertility management in relation to barley in Ethiopia. Barley Research and Development in Ethiopia. 137p.
[7] Alemu Dugassa, Ketema Belete, Tesfaye Shimbir. 2019. Response of Wheat (Triticum aestivum L.) to Different Rates of Nitrogen and Phosphorus at Fiche-Salale, Highlands of Ethiopia. International Journal of Plant Breeding and Crop Science, 6 (1), 474-480.
[8] Mulugeta Eshetu, Daniel Abegeja, Regassa Gosa, Tesfaye Ketama, Girma Getachew, Tilahun Chibsa (2022). Soil Test Based Crop Response Phosphorus Calibration Study for Bread Wheat Production in Sinana District of Bale Zone, Southeastern Ethiopia. International Journal of Science and Qualitative Analysis. Vol. 8, No. 1, pp. 1-12.
[9] Fresew Belete, Nigussie Dechassa, Adamu Molla and Tamado Tana. 2018. Efect of nitrogen fertilizer rates on grain yield and nitrogen uptake and use efciency of bread wheat (Triticum aestivum L.) varieties on the Vertisols of central highlands of Ethiopia. Belete et al. Agric & Food Secur (2018) 7: 78.
[10] Silva, J. A., and Uchida, R. (2000). Inorganic fertilizer materials. Plant Nutrient Management in Hawaii’s Soils. Approaches for Tropical and Subtropical Agriculture. University of Hawaii, Manoa, 117-120.
[11] Sonon, L. S., & Zhang, H. (2014). Soil test calibration work in southern USA. University of Texas A and M university. USA.
[12] Rouse, H. (1965). Critical analysis of open-channel resistance. Journal of the Hydraulics Division, 91(4), 1-23.
[13] Turi, T., Hayicho, H. and Kedir, H. (2019) Evaluating Land Use/Land Cover Change and Its Socioeco nomic Implications in Agarfa District of Bale Zone, Southeastern Ethiopia. Journal of Environmental Protection, 10, 369-388.
[14] Nelson, L. A. and Anderson, R. L., 1977. Partitioning of soil test—Crop response probability. Soil testing: Correlating and interpreting the analytical results, 29, pp. 19-38.
[15] Ludecke, D., Ben-Shachar, M. S., Patil, I., Waggoner, P., and Makowski, D. (2021). Performance: An R package for assessment, comparison and testing of statistical models. Journal of Open-Source Software, 6(60).
[16] Steel, R. G. D. and J. H. Torrie. 1980. Principles and procedures of Statistics, A Biological Approach. McGraw Hill Book Co., New York, pp. 272-280.
[17] CIMMYT. From Agronomic Data to Farmer Recommendations: An Economics Training Manual. Completely revised edition. Mexico, D. F.
[18] Jones, J. Benton. 2003. Agronomic Hand Book: Management of crops, soils and their fertility. CRC Press, Washington, USA.
[19] Tekalign Tadesse. 1991. Soil, plant, water, fertilizer, animal manure and compost analysis. Working Document No. 13. International Livestock Research Center for Africa, Addis Ababa.
[20] Cottenie A (1980). Soil and plant testing as a basis of fertilizer recommendations. FAO soil bulletin 38/2. Food and Agricultural Organization of the United Nations, Rome.
[21] Tilahun Abera, Amante Lema, Tilahun Firomsa, Abdurhman Husen (2024). Soil Test-Based Crop Response Phosphorus Calibration Study on Bread Wheat (Triticum Aestivum L.) in Liban Chukala District, East Shewa Zone, Oromia, Ethiopia. J Envi Sci Agri Res. 2(3): 1-5.
Cite This Article
  • APA Style

    Getachew, G., Eshetu, M., Gosa, R., Ketama, T. (2026). Soil Test Based Crop Response Phosphorus Calibration Study for Bread Wheat (Triticum aestivum L.) Production in Agarfa District Bale Highland, Oromia, Ethiopia. World Journal of Agricultural Science and Technology, 4(3), 52-60. https://doi.org/10.11648/j.wjast.20260403.12

    Copy | Download

    ACS Style

    Getachew, G.; Eshetu, M.; Gosa, R.; Ketama, T. Soil Test Based Crop Response Phosphorus Calibration Study for Bread Wheat (Triticum aestivum L.) Production in Agarfa District Bale Highland, Oromia, Ethiopia. World J. Agric. Sci. Technol. 2026, 4(3), 52-60. doi: 10.11648/j.wjast.20260403.12

    Copy | Download

    AMA Style

    Getachew G, Eshetu M, Gosa R, Ketama T. Soil Test Based Crop Response Phosphorus Calibration Study for Bread Wheat (Triticum aestivum L.) Production in Agarfa District Bale Highland, Oromia, Ethiopia. World J Agric Sci Technol. 2026;4(3):52-60. doi: 10.11648/j.wjast.20260403.12

    Copy | Download

  • @article{10.11648/j.wjast.20260403.12,
      author = {Girma Getachew and Mulugeta Eshetu and Regassa Gosa and Tesfaye Ketama},
      title = {Soil Test Based Crop Response Phosphorus Calibration Study for Bread Wheat (Triticum aestivum L.) Production in Agarfa District Bale Highland, Oromia, Ethiopia},
      journal = {World Journal of Agricultural Science and Technology},
      volume = {4},
      number = {3},
      pages = {52-60},
      doi = {10.11648/j.wjast.20260403.12},
      url = {https://doi.org/10.11648/j.wjast.20260403.12},
      eprint = {https://article.sciencepublishinggroup.com/pdf/10.11648.j.wjast.20260403.12},
      abstract = {Ethiopia faces a wide set of soil fertility loss issues which are declining of soil fertility due to biological and environmental factors as well as blanket fertilizer application throughout the country without considering soil types and agro-ecological are among the factors that pronounced in low yielding of food crop production like bread wheat. To tackle this problem, site specific nutrients managements and soil test-based crop response fertilizer recommendations was conducted for three consecutive years during the main cropping seasons of (2015 – 2017 E.C). The objective of the experiment was to determine economically optimum Nitrogen, Phosphorus critical (Pc) and Phosphorus requirement factor (Prf) for bread wheat production in Agarfa district. The treatments consisted of factorial combinations of three levels of TSP (0, 100, and 200) kg ha-1 with five levels of nitrogen (0, 23, 46, 69, and 92 kg ha-1) that gave a total of fifteen treatments. However, in the second two consecutive years, the experiment was conducted to determine phosphorus critical (Pc) and phosphorus requirement factor (Pf), and the treatments consisted of six levels of phosphorus (0, 10, 20, 30, 40, and 50) kg ha-1 combined with a single level of nitrogen (69 kg ha-1). Composite soil sample before plating and intensive soil samples after 21 days of sowing were taken from each plot and analyzed for selected physicochemical properties following standard laboratory procedures. Phosphorus critical level (Pc) determination was done using Cate-Nelson diagram method. Agronomic data such as above ground biomass and grain yield was collected then subjected to two-way factorial analysis of variance (ANOVA) using R software while the partial budget analysis was done using CIMMYT procedure. The results indicate that combined NP fertilizer rates significantly influenced the agronomic parameters of bread wheat. Optimum nitrogen rate (69 N kg/ha), P critical concentration (28.0 ppm) and P requirement factor (4.15) for bread wheat production were determined at Agarfa District. Therefore, uses of 69 N kg/ha fertilizer for bread wheat production at Agarfa District and areas having similar soil conditions and agro-ecology is advisable. Farther verification of the result on farm land could be a pre request before disseminating the technology to the user.},
     year = {2026}
    }
    

    Copy | Download

  • TY  - JOUR
    T1  - Soil Test Based Crop Response Phosphorus Calibration Study for Bread Wheat (Triticum aestivum L.) Production in Agarfa District Bale Highland, Oromia, Ethiopia
    AU  - Girma Getachew
    AU  - Mulugeta Eshetu
    AU  - Regassa Gosa
    AU  - Tesfaye Ketama
    Y1  - 2026/07/17
    PY  - 2026
    N1  - https://doi.org/10.11648/j.wjast.20260403.12
    DO  - 10.11648/j.wjast.20260403.12
    T2  - World Journal of Agricultural Science and Technology
    JF  - World Journal of Agricultural Science and Technology
    JO  - World Journal of Agricultural Science and Technology
    SP  - 52
    EP  - 60
    PB  - Science Publishing Group
    SN  - 2994-7332
    UR  - https://doi.org/10.11648/j.wjast.20260403.12
    AB  - Ethiopia faces a wide set of soil fertility loss issues which are declining of soil fertility due to biological and environmental factors as well as blanket fertilizer application throughout the country without considering soil types and agro-ecological are among the factors that pronounced in low yielding of food crop production like bread wheat. To tackle this problem, site specific nutrients managements and soil test-based crop response fertilizer recommendations was conducted for three consecutive years during the main cropping seasons of (2015 – 2017 E.C). The objective of the experiment was to determine economically optimum Nitrogen, Phosphorus critical (Pc) and Phosphorus requirement factor (Prf) for bread wheat production in Agarfa district. The treatments consisted of factorial combinations of three levels of TSP (0, 100, and 200) kg ha-1 with five levels of nitrogen (0, 23, 46, 69, and 92 kg ha-1) that gave a total of fifteen treatments. However, in the second two consecutive years, the experiment was conducted to determine phosphorus critical (Pc) and phosphorus requirement factor (Pf), and the treatments consisted of six levels of phosphorus (0, 10, 20, 30, 40, and 50) kg ha-1 combined with a single level of nitrogen (69 kg ha-1). Composite soil sample before plating and intensive soil samples after 21 days of sowing were taken from each plot and analyzed for selected physicochemical properties following standard laboratory procedures. Phosphorus critical level (Pc) determination was done using Cate-Nelson diagram method. Agronomic data such as above ground biomass and grain yield was collected then subjected to two-way factorial analysis of variance (ANOVA) using R software while the partial budget analysis was done using CIMMYT procedure. The results indicate that combined NP fertilizer rates significantly influenced the agronomic parameters of bread wheat. Optimum nitrogen rate (69 N kg/ha), P critical concentration (28.0 ppm) and P requirement factor (4.15) for bread wheat production were determined at Agarfa District. Therefore, uses of 69 N kg/ha fertilizer for bread wheat production at Agarfa District and areas having similar soil conditions and agro-ecology is advisable. Farther verification of the result on farm land could be a pre request before disseminating the technology to the user.
    VL  - 4
    IS  - 3
    ER  - 

    Copy | Download

Author Information
  • Soil Fertility Improvement Research Team, Sinana Agricultural Research Center, Bale-Robe, Ethiopia

  • Soil Fertility Improvement Research Team, Sinana Agricultural Research Center, Bale-Robe, Ethiopia

  • Soil Fertility Improvement Research Team, Sinana Agricultural Research Center, Bale-Robe, Ethiopia

  • Soil Fertility Improvement Research Team, Sinana Agricultural Research Center, Bale-Robe, Ethiopia

  • Abstract
  • Keywords
  • Document Sections

    1. 1. Introduction
    2. 2. Materials and Methods
    3. 3. Result and Discussion
    4. 4. Conclusion and Recommendation
    Show Full Outline
  • Abbreviations
  • Acknowledgments
  • Conflicts of Interest
  • References
  • Cite This Article
  • Author Information