In the Rajshahi City Corporation (RCC)area, spatial sizeis not proportionate to the placement of public facilities due to rapid urbanization and population growth. This raises the question ofwhat is the level of equity present inthe provision of public facilities in the city corporation area. For this research, primary schools, high schools, colleges, health facilities, and markets were selected from the available types of public facilities.Location Quotient (LQ) method and Gini Coefficientwere used to analyze locational concentration and spatial disparity in the provision of public facilities in 30 wards of Rajshahi City Corporation (RCC). Service area analysiswas done to show how much of the city corporation area falls under afavorable distance from the public facilities.The number of the wards having LQ value > 1 range from 9 – 15 based on different public facilities; showing locational concentration is present for all public facilities. The Gini coefficient (GC) values range from 0.41 to 0.67, showing a high level of spatial inequity. The service area analysis also shows the service area of the public facilities fail to cover all of the wards.In the future, inequity in provision of public facilities can compound with the increase in population and urban sprawl if not met with regulatory and inclusive planning policies.
| Published in | Urban and Regional Planning (Volume 9, Issue 3) |
| DOI | 10.11648/j.urp.20240903.14 |
| Page(s) | 96-111 |
| Creative Commons |
This is an Open Access article, distributed under the terms of the Creative Commons Attribution 4.0 International License (http://creativecommons.org/licenses/by/4.0/), which permits unrestricted use, distribution and reproduction in any medium or format, provided the original work is properly cited. |
| Copyright |
Copyright © The Author(s), 2024. Published by Science Publishing Group |
Spatial Analysis, Population, Public Facility, Service Area, Spatial Disparity, Planning Standard
Planning Principles | Descriptions |
|---|---|
Equal distribution of facilities | Properly distributed in accordance to location and population. |
Accessibility | Provisioned within walking distance from residential areas and provided safety from traffic. |
Comfort and safety | Not established in places of natural hazard, steep slopes, etc. |
Interaction | Social interaction is to be promoted. |
Design | Should value local aesthetics and culture, also in line with universal design principles. |
Facilities | Rajshahi Metropolitan Development Plan, 2004 (RMDP 2004) |
|---|---|
Primary School | 1 school per 4000 popn |
High School | 1 school per 6,000 popn. |
Intermediate College | 1 college per 6,000 popn. |
Degree College | 1 college per 30,000 popn |
Market | 1 in each ward |
Health Center | 354 person per bed |
Facilities | Distance |
|---|---|
Primary School | 875 meters |
High School | 1350 meters |
College | 1350 meters |
Clinic | 1 kilometer |
Hospital | 1 kilometer |
Market | 1 in each ward |
Structure Use Type | Count | Percentage |
|---|---|---|
Business and Mercantile Building | 5955 | 6 |
Educational Building | 735 | 0.78 |
Health Care Building | 166 | 0.18 |
Industrial Building | 436 | 0.46 |
Miscellaneous Building | 3845 | 4 |
Mixed Use | 1024 | 1 |
Residential Building | 81649 | 87 |
Total | 93810 | 100 |
Wards | Population (Primary School going) | Population (High School going) | Population (College going) | Male | Female | Ward Population |
|---|---|---|---|---|---|---|
Ward 1 | 1475 | 1892 | 1635 | 7945 | 8087 | 16032 |
Ward 2 | 1836 | 2139 | 1854 | 8860 | 8963 | 17823 |
Ward 3 | 1711 | 2033 | 2255 | 10098 | 10034 | 20132 |
Ward 4 | 1165 | 1416 | 1324 | 6660 | 6578 | 13238 |
Ward 5 | 1201 | 1554 | 1370 | 6796 | 7332 | 14128 |
Ward 6 | 1343 | 1587 | 2105 | 7775 | 7481 | 15256 |
Ward 7 | 919 | 1100 | 1152 | 7851 | 5091 | 12942 |
Ward 8 | 804 | 914 | 1630 | 5806 | 5205 | 11011 |
Ward 9 | 939 | 1195 | 1864 | 7321 | 6911 | 14232 |
Ward 10 | 708 | 829 | 1504 | 5692 | 5365 | 11057 |
Ward 11 | 701 | 873 | 2410 | 5960 | 6334 | 12294 |
Ward 12 | 624 | 1078 | 1873 | 6518 | 4831 | 11349 |
Ward 13 | 679 | 797 | 1467 | 5059 | 4786 | 9845 |
Ward 14 | 1975 | 2502 | 2480 | 11369 | 10580 | 21949 |
Ward 15 | 1110 | 1260 | 1904 | 7203 | 6497 | 13700 |
Ward 16 | 1495 | 1844 | 2076 | 8829 | 7781 | 16610 |
Ward 17 | 1816 | 2314 | 2474 | 9999 | 9952 | 19951 |
Ward 18 | 1295 | 1469 | 1557 | 7490 | 7057 | 14547 |
Ward 19 | 2064 | 2545 | 2729 | 11622 | 11307 | 22929 |
Ward 20 | 589 | 872 | 896 | 4015 | 3842 | 7857 |
Ward 21 | 804 | 1042 | 1022 | 5130 | 4797 | 9927 |
Ward 22 | 589 | 732 | 900 | 4250 | 4164 | 8414 |
Ward 23 | 718 | 848 | 857 | 4346 | 4308 | 8654 |
Ward 24 | 1277 | 1437 | 1495 | 7358 | 7155 | 14513 |
Ward 25 | 969 | 1250 | 1454 | 6659 | 6093 | 12752 |
Ward 26 | 1561 | 1877 | 2119 | 9754 | 8832 | 18586 |
Ward 27 | 1428 | 1696 | 1911 | 9163 | 8693 | 17856 |
Ward 28 | 1844 | 2278 | 2712 | 11622 | 10075 | 21697 |
Ward 29 | 1595 | 1851 | 1623 | 7244 | 6995 | 14239 |
Ward 30 | 1522 | 1863 | 3175 | 14580 | 11656 | 26236 |
Wards | Primary Schools | High Schools | Colleges | Markets | Health Facilities |
|---|---|---|---|---|---|
Ward 01 | 3 | 1 | 0 | 2 | 1 |
Ward 02 | 6 | 3 | 1 | 4 | 0 |
Ward 03 | 4 | 1 | 0 | 2 | 3 |
Ward 04 | 3 | 0 | 0 | 3 | 2 |
Ward 05 | 5 | 3 | 1 | 1 | 1 |
Ward 06 | 2 | 0 | 0 | 4 | 8 |
Ward 07 | 2 | 2 | 1 | 2 | 5 |
Ward 08 | 1 | 4 | 2 | 0 | 11 |
Ward 09 | 4 | 2 | 2 | 0 | 7 |
Ward 10 | 2 | 2 | 0 | 0 | 9 |
Ward 11 | 3 | 2 | 1 | 0 | 3 |
Ward 12 | 1 | 2 | 0 | 6 | 1 |
Ward 13 | 1 | 2 | 1 | 1 | 4 |
Ward 14 | 3 | 2 | 1 | 0 | 2 |
Ward 15 | 0 | 0 | 0 | 0 | 0 |
Ward 16 | 3 | 1 | 0 | 2 | 0 |
Ward 17 | 4 | 3 | 2 | 2 | 2 |
Ward 18 | 1 | 0 | 1 | 1 | 1 |
Ward 19 | 1 | 1 | 0 | 0 | 1 |
Ward 20 | 2 | 1 | 0 | 0 | 0 |
Ward 21 | 3 | 2 | 1 | 0 | 1 |
Ward 22 | 0 | 1 | 3 | 1 | 0 |
Ward 23 | 1 | 0 | 1 | 1 | 1 |
Ward 24 | 4 | 0 | 0 | 0 | 0 |
Ward 25 | 5 | 1 | 1 | 0 | 1 |
Ward 26 | 0 | 0 | 0 | 0 | 0 |
Ward 27 | 1 | 4 | 2 | 0 | 2 |
Ward 28 | 2 | 0 | 0 | 1 | 1 |
Ward 29 | 0 | 0 | 0 | 0 | 0 |
Ward 30 | 0 | 0 | 0 | 0 | 0 |
Wards | Primary | Secondary | College | Health Facilities | Market |
|---|---|---|---|---|---|
Ward 1 | 1.116 | 0.596 | 0 | 0.419 | 1.7 |
Ward 2 | 1.793 | 1.581 | 1.383 | 0 | 3.059 |
Ward 3 | 1.282 | 0.554 | 0 | 1 | 1.354 |
Ward 4 | 1.413 | 0 | 0 | 1.014 | 3.089 |
Ward 5 | 2.284 | 2.176 | 1.87 | 0.475 | 0.965 |
Ward 6 | 0.817 | 0 | 0 | 3.52 | 3.573 |
Ward 7 | 1.194 | 2.049 | 2.225 | 2.593 | 2.106 |
Ward 8 | 0.682 | 4.934 | 3.146 | 6.706 | 0 |
Ward 9 | 2.336 | 1.886 | 2.75 | 3.302 | 0 |
Ward 10 | 1.55 | 2.719 | 0 | 5.464 | 0 |
Ward 11 | 2.349 | 2.583 | 1.064 | 1.638 | 0 |
Ward 12 | 0.879 | 2.091 | 0 | 0.591 | 7.205 |
Ward 13 | 0.808 | 2.827 | 1.747 | 2.727 | 1.384 |
Ward 14 | 0.833 | 0.901 | 1.033 | 0.612 | 0 |
Ward 15 | 0 | 0 | 0 | 0 | 0 |
Ward 16 | 1.101 | 0.611 | 0 | 0 | 1.641 |
Ward 17 | 1.209 | 1.461 | 2.072 | 0.673 | 1.366 |
Ward 18 | 0.424 | 0 | 1.647 | 0.461 | 0.937 |
Ward 19 | 0.266 | 0.443 | 0 | 0.293 | 0 |
Ward 20 | 1.862 | 1.293 | 0 | 0 | 0 |
Ward 21 | 2.047 | 2.163 | 2.507 | 0.676 | 0 |
Ward 22 | 0 | 1.54 | 8.541 | 0 | 1.62 |
Ward 23 | 0.764 | 0 | 2.992 | 0.776 | 1.575 |
Ward 24 | 1.718 | 0 | 0 | 0 | 0 |
Ward 25 | 2.83 | 0.902 | 1.763 | 0.526 | 0 |
Ward 26 | 0 | 0 | 0 | 0 | 0 |
Ward 27 | 0.384 | 2.658 | 2.683 | 0.752 | 0 |
Ward 28 | 0.595 | 0 | 0 | 0.309 | 0.628 |
Ward 29 | 0 | 0 | 0 | 0 | 0 |
Ward 30 | 0 | 0 | 0 | 0 | 0 |
Public Facility | Gini Coefficient (GC) |
|---|---|
Primary School | 0.41 |
High School | 0.51 |
College | 0.64 |
Health Facility | 0.65 |
Market | 0.67 |
ERP | Emergency Response Program |
GC | Gini Coefficient |
LQ | Location Quotient |
RCC | Rajshahi City Corporation |
RMDP | Rajshahi Metropolitan Development Plan |
RDA | Rajshahi Development Authority |
| [1] | United Nations. (2019). World urbanization prospects: The 2018 revision. |
| [2] |
World Bank. (2018). Urban population (% of total population)—Bangladesh | Data.
https://data.worldbank.org/indicator/SP.URB.TOTL.IN.ZS?end=2020&locations=BD&start=1972 |
| [3] | Biswas, M. R. U. I., Rahman, M. M., &Akther, F. (2016). An Aproch to Implement Master Plan in the Urban Local Government of Bangladesh: A Case Study on Phulpur Municipality. Jahangirnagar University Planning Review, 14, 97-112. |
| [4] | Bhagat, R. B., &Mohanty, S. (2009). EMERGING PATTERN OF URBANIZATION AND THE CONTRIBUTION OF MIGRATION IN URBAN GROWTH IN INDIA. Asian Population Studies, 5(1), 11. |
| [5] | Ikwuyatum, G. (2016). Migration and Urbanization: Exploring the Factors of the Nexus in Nigeria. International Journal of Humanities and Social Science, 6(8), 161. |
| [6] | ZillurRahman, H. (2014, June 21). Urbanization in Bangladesh: Challenges and Priorities. The First BEF Conference. |
| [7] | Ladd, H. F. (1992). Population Growth, Density and the Costs of Providing Public Services. Urban Studies, 29(2), 273–295. |
| [8] | Cohen, B. (2006). Urbanization in developing countries: Current trends, future projections, and key challenges for sustainability. Technology in Society, 28(1–2), 63–80. |
| [9] | Wu, Y., Zhang, T., Zhang, H., Pan, T., Ni, X., Grydehøj, A., & Zhang, J. (2020). Factors influencing the ecological security of island cities: A neighborhood-scale study of Zhoushan Island, China. Sustainable Cities and Society, 55, 102029. |
| [10] | Rahman, M. M., Akther, F., Satu, S. A., &Sharmin, S. (2020). Geographic Information System (GIS) based Approach in Delineation of Efficient Natural Flow Routes for Drainage Plan of a Municipality. International Journal of Research Publications, 50. |
| [11] | Rahman, M. M., & Hosen, M. M. (2018). Land use-Temporal Pattern Analysis of Urban Heat Island by Using Remote Sensing: A Case Study on Pabna Municipality. Pabna University of Science and Technology Studies, 3, 1-7. |
| [12] | Singh, R., &Kalota, D. (2019). Urban Sprawl and Its Impact on Generation of Urban Heat Island: A Case Study of Ludhiana City. Journal of the Indian Society of Remote Sensing, 47(9), 1567–1576. |
| [13] | Shao, Z., Sumari, N. S., Portnov, A., Ujoh, F., Musakwa, W., & Mandela, P. J. (2021). Urban sprawl and its impact on sustainable urban development: A combination of remote sensing and social media data. Geo-Spatial Information Science, 24(2), 241–255. |
| [14] | Rahman, M. M. (2021). Urban Green Space and Wetland Dynamics by Urbanization Impact: Protective Perspective by Present Monitoring Laws on Municipality. Jahangirnagar University Planning Review, ISSN, 1728-4198. |
| [15] | Mahmud, H., Rahman, M. M., &Sharmin, S. (2020). Urbanization Impact on Wetlands: A Case Study on DhamraiPaurashava. The Jahangirnagar Review, 41, 277-291. |
| [16] | Ahmed, M., &Rahman, M. M. (2020). Local Climate Change Governance and Making Climate Resilient Town: The Role of Local Authorities. Research and Reviews: Journal of Architectural Designing, 19(2), 1. |
| [17] | Sarker, S., &Rahman, M. M. (2018). Trend analysis of bank erosion of Jamuna River and migration impact: A case study on Teota union of ShibalayaUpazila. Journal of Bangladesh Institute of Planners ISSN, 2075, 9363. |
| [18] | Alam, Md. J., & Ahmad, M. M. (2013). Public Facilities in Public and Private Housing Projects in Dhaka, Bangladesh. Urban Policy and Research, 31(2), 190–207. |
| [19] | Biswas, M. R. U. I., Rahman, M. M., &Haque, A. (2014). A Comprehensive Approach of Holding Tax Assessment System in Local Government of Bangladesh: A Case Study of Singair Municipality. An Unpublished MURP Thesis, Department of Urban and Regional Planning, Jahangirnagar University, Savar, Dhaka-1342. |
| [20] | Hasan, M. R., Hasan, M. U., &Rahman, M. M. (2018). Mainstreaming Urban Poor in the Economic Activities through Micro-Finance: A Case Study on Bhairab Municipality, Kishoreganj. The Jahangirnagar Review, Part II: Social Sciences. Vol. 39, 49-60. |
| [21] | Kirby, A., Knox, P., & Pinch, S. (1983). Developments in public provision and urban politics: an overview and agenda. Area, 295-300. |
| [22] | Talen, E., &Anselin, L. (1998). Assessing spatial equity: an evaluation of measures of accessibility to public playgrounds. Environment and planning A, 30(4), 595-613. |
| [23] | Grubesic, T. H., & Durbin, K. M. (2017). Breastfeeding support: A geographic perspective on access and equity. Journal of Human Lactation, 33(4), 770-780. |
| [24] | Rahman, M. M., Saha, R., &Tanvin, F. (2021). Regional Economic Development of Pabna District in Bangladesh: A Shift Share Approach. Journal of Engineering Analysis and Design, 3(1), 1-9. |
| [25] | Kelobonye, K., McCarney, G., Xia, J. C., Swapan, M. S. H., Mao, F., & Zhou, H. (2019). Relative accessibility analysis for key land uses: A spatial equity perspective. Journal of Transport Geography, 75, 82-93. |
| [26] | Lee, J., & Miller, H. J. (2018). Measuring the impacts of new public transit services on space-time accessibility: An analysis of transit system redesign and new bus rapid transit in Columbus, Ohio, USA. Applied Geography, 93, 47–63. |
| [27] | Rahman, M. M., Al Tariq, A., &Sharmin, S. (2020). Planning Intervention in Emergency Evacuation to Minimize Hazard Impact: A Case Study of Old Dhaka and Dhaka Export Processing Zone. Journal of Earthquake Science and Soil Dynamics Engineering, 3(3). |
| [28] | Shawon, M. T. A., Rahman, M. M., &Ahmmed, M. Z. (2021). Municipal Solid Waste Management and Environmental Awareness: Household Survey Study on Dhamrai Municipality. Research and Reviews: Journal of Environmental Sciences, 3(2), 1-15. |
| [29] | Apparicio, P., Abdelmajid, M., Riva, M., &Shearmur, R. (2008). Comparing alternative approaches to measuring the geographical accessibility of urban health services: Distance types and aggregation-error issues. International journal of health geographics, 7(1), 1-14. |
| [30] | Fasihi, H., &Parizadi, T. (2020). Analysis of spatial equity and access to urban parks in Ilam, Iran. Journal of environmental management, 260, 110122. |
| [31] | Cheng, L., Yang, M., De Vos, J., & Witlox, F. (2020). Examining geographical accessibility to multi-tier hospital care services for the elderly: A focus on spatial equity. Journal of Transport & Health, 19, 100926. |
| [32] | Alam, K. T., & Islam, J. (2010). Urbanization in Bangladesh: Present Status and Policy Implication. 18. |
| [33] | Ashaduzzaman, M., & Ahmed, M. (2017). Quantifying urban growth pattern of Rajshahi City Corporation. Bachelor of Urban & Rural Planning., Khulna University. |
| [34] | Cremer, H., De Kerchove, A.-M., &Thisse, J.-F. (1985). An economic theory of public facilities in space. Mathematical Social Sciences, 9(3), 249–262. |
| [35] | DeVerteuil, G. (2000). Reconsidering the legacy of urban public facility location theory in human geography. Progress in Human Geography, 24(1), 47–69. |
| [36] | Teitz, M. B., & Bart, P. (1968). Heuristic Methods for Estimating the Generalized Vertex Median of a Weighted Graph. Operations Research, 16(5), 955–961. |
| [37] | City of Irvine. (2012). Public Facilities and Services. |
| [38] | Chakrabarty, A., Rahman, M. M. and Ubaura, M. (2020). “Assessment of Emergency Evacuation Preparedness for Seismic Hazard in an Urban Area” in the 17th World Conference on Earthquake Engineering, 17WCEE, Sendai, Japan - September 13th to 18th 2020, pp. 6h-0004, 1-9. Sendai, Japan. Available at |
| [39] | Csir Council for Scientific and Industrial Research. (2000). Guidelines for human settlement planning and design: The red book. CSIR Building and Construction Technology. |
| [40] | Kunzmann, K. R. (1998). Planning for spatial equity in Europe. International Planning Studies, 3(1), 101–120. |
| [41] | Robinson, M. (2007). Does Decentralisation Improve Equity and Efficiency in Public Service Delivery Provision? IDS Bulletin, 38(1), 7–17. |
| [42] | Andrews, R., Beynon, M. J., & McDermott, A. (2019). Configurations of New Public Management reforms and the efficiency, effectiveness and equity of public healthcare systems: A fuzzy-set Qualitative Comparative Analysis. Public Management Review, 21(8), 1236–1260. |
| [43] | Rahman, M., NigarNeema, M., & Department of Urban and Regional Planning, Bangladesh University of Engineering and Technology (BUET), Dhaka, Bangladesh. (2015). A GIS Based Integrated Approach to Measure the Spatial Equity of Community Facilities of Bangladesh. AIMS Geosciences, 1(1), 21–40. |
| [44] | Rahman, M. M., Rahman, A., Satu, S. A., &Sharmin, S. (2020). Locational Attributes of Playgrounds in a City: Need Assessment Approach on Zone 2 in DNCC, Bangladesh. Journal of Research in Infrastructure Designing, 3(1, 2, 3). |
| [45] | Ashik, F. R., Mim, S. A., &Neema, M. N. (2020). Towards vertical spatial equity of urban facilities: An integration of spatial and aspatial accessibility. Journal of Urban Management, 9(1), 77–92. |
| [46] | deBartolome, C. A., & Ross, S. L. (2004). Who's in charge of the central city? The conflict between efficiency and equity in the design of a metropolitan area. Journal of Urban Economics, 56(3), 458-483. |
| [47] | Martins, R., &Fortunato, A. (2016). Critical analysis of the Portuguese water industry restructuring plan. Utilities Policy, 43, 131-139. |
| [48] | Yuan, R., Zhang, X., Liu, H., Gui, Y., Shao, B., Tao, X., ...&Gao, Z. (2019). Aerosol vertical mass flux measurements during heavy aerosol pollution episodes at a rural site and an urban site in the Beijing area of the North China Plain. Atmospheric Chemistry and Physics, 19(20), 12857-12874. |
| [49] | Cepiku, D., &Mastrodascio, M. (2021). Equity in Public Services: A Systematic Literature Review.Public Administration Review, 81(6), 1019–1032. |
| [50] | Alterman, R. (2013). Planning Laws, Development Controls, and Social Equity: Lessons for Developing Countries. |
| [51] | Mohd Ibrahim, N., Osman, M., Bachok, S., & Mohamed, M. (2016). Assessment on the Condition of School Facilities: Case Study of the Selected Public Schools in Gombak District. Procedia - Social and Behavioral Sciences, 222, 228–234. |
| [52] | Rodíguez-López, C., Salas, Z., Villa-González, E., Borges-Cosic, M., Herrador-Colmenero, M., Medina-Causabón, J., Ortega, F., &Chillón, P. (2016). The Threshold Distance Associated With Walking From Home to School. Health Education & Behavior, 44. |
| [53] | Mansour, S. (2016). Spatial analysis of public health facilities in Riyadh Governorate, Saudi Arabia: A GIS-based study to assess geographic variations of service provision and accessibility. Geo-Spatial Information Science, 19(1), 26–38. |
| [54] | Zheng, M., Su, Y., Hu, C., Yu, Z., Pan, Y., & Wu, Y. (2021). Using Lorenz Curve and Gini Coefficient to Reflect the Inequality Degree of S&T Publications: An Examination of the Institutional Distribution of Publications in China and other Countries. |
| [55] | Jahan, S., & Oda, T. (2000). Distribution of public facilities in Dhaka, Bangladesh: A spatial analysis. Bulletin of the Faculty of Human Development, 7(2), 865–874. |
| [56] | Rahaman, K. R., & Salauddin, M. (2009). A spatial analysis on the provision of urban public services and their deficiencies: A study of some selected blocks in Khulna City, Bangladesh. Theoretical and Empirical Researches in Urban Management, 4(1S), 120–132. |
| [57] | Azmoodeh, M., Haghighi, F., & Motieyan, H. (2021). Proposing an integrated accessibility-based measure to evaluate spatial equity among different social classes. Environment and Planning B: Urban Analytics and City Science, 48(9), 2790–2807. |
| [58] | Jang, S., An, Y., Yi, C., & Lee, S. (2017). Assessing the spatial equity of Seoul’s public transportation using the Gini coefficient based on its accessibility. International Journal of Urban Sciences, 21(1), 91–107. |
| [59] | Pan American Health Orgainzation. (2001). Measuring Health Inequalities: Gini Coefficient and Concentration Index. PAHO Epidemiological Bulletin. |
APA Style
Chakrabarty, A., Rahman, M. M. (2024). Equity in Public Facilities Provision in an Urban Area: A Spatial Analysis of Rajshahi City Corporation. Urban and Regional Planning, 9(3), 96-111. https://doi.org/10.11648/j.urp.20240903.14
ACS Style
Chakrabarty, A.; Rahman, M. M. Equity in Public Facilities Provision in an Urban Area: A Spatial Analysis of Rajshahi City Corporation. Urban Reg. Plan. 2024, 9(3), 96-111. doi: 10.11648/j.urp.20240903.14
AMA Style
Chakrabarty A, Rahman MM. Equity in Public Facilities Provision in an Urban Area: A Spatial Analysis of Rajshahi City Corporation. Urban Reg Plan. 2024;9(3):96-111. doi: 10.11648/j.urp.20240903.14
@article{10.11648/j.urp.20240903.14,
  author = {Arnob Chakrabarty and Mohammad Mizanur Rahman},
  title = {Equity in Public Facilities Provision in an Urban Area: A Spatial Analysis of Rajshahi City Corporation
},
  journal = {Urban and Regional Planning},
  volume = {9},
  number = {3},
  pages = {96-111},
  doi = {10.11648/j.urp.20240903.14},
  url = {https://doi.org/10.11648/j.urp.20240903.14},
  eprint = {https://article.sciencepublishinggroup.com/pdf/10.11648.j.urp.20240903.14},
  abstract = {In the Rajshahi City Corporation (RCC)area, spatial sizeis not proportionate to the placement of public facilities due to rapid urbanization and population growth. This raises the question ofwhat is the level of equity present inthe provision of public facilities in the city corporation area. For this research, primary schools, high schools, colleges, health facilities, and markets were selected from the available types of public facilities.Location Quotient (LQ) method and Gini Coefficientwere used to analyze locational concentration and spatial disparity in the provision of public facilities in 30 wards of Rajshahi City Corporation (RCC). Service area analysiswas done to show how much of the city corporation area falls under afavorable distance from the public facilities.The number of the wards having LQ value > 1 range from 9 – 15 based on different public facilities; showing locational concentration is present for all public facilities. The Gini coefficient (GC) values range from 0.41 to 0.67, showing a high level of spatial inequity. The service area analysis also shows the service area of the public facilities fail to cover all of the wards.In the future, inequity in provision of public facilities can compound with the increase in population and urban sprawl if not met with regulatory and inclusive planning policies.
},
 year = {2024}
}
TY  - JOUR
T1  - Equity in Public Facilities Provision in an Urban Area: A Spatial Analysis of Rajshahi City Corporation

AU  - Arnob Chakrabarty
AU  - Mohammad Mizanur Rahman
Y1  - 2024/09/06
PY  - 2024
N1  - https://doi.org/10.11648/j.urp.20240903.14
DO  - 10.11648/j.urp.20240903.14
T2  - Urban and Regional Planning
JF  - Urban and Regional Planning
JO  - Urban and Regional Planning
SP  - 96
EP  - 111
PB  - Science Publishing Group
SN  - 2575-1697
UR  - https://doi.org/10.11648/j.urp.20240903.14
AB  - In the Rajshahi City Corporation (RCC)area, spatial sizeis not proportionate to the placement of public facilities due to rapid urbanization and population growth. This raises the question ofwhat is the level of equity present inthe provision of public facilities in the city corporation area. For this research, primary schools, high schools, colleges, health facilities, and markets were selected from the available types of public facilities.Location Quotient (LQ) method and Gini Coefficientwere used to analyze locational concentration and spatial disparity in the provision of public facilities in 30 wards of Rajshahi City Corporation (RCC). Service area analysiswas done to show how much of the city corporation area falls under afavorable distance from the public facilities.The number of the wards having LQ value > 1 range from 9 – 15 based on different public facilities; showing locational concentration is present for all public facilities. The Gini coefficient (GC) values range from 0.41 to 0.67, showing a high level of spatial inequity. The service area analysis also shows the service area of the public facilities fail to cover all of the wards.In the future, inequity in provision of public facilities can compound with the increase in population and urban sprawl if not met with regulatory and inclusive planning policies.

VL  - 9
IS  - 3
ER  -
Emergency Response Program (ERP) – A Project of Caritas Bangladesh, Cox’s Bazar, Bangladesh
Department of Urban and Regional Planning, Jahangirnagar University, Dhaka, Bangladesh
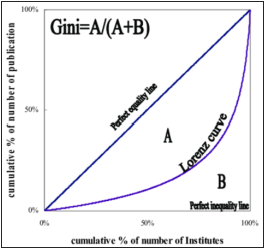
Figure 1. Lorenz Curve and Gini Coefficient (GC) (Source: Zheng et al., 2021 [54]).
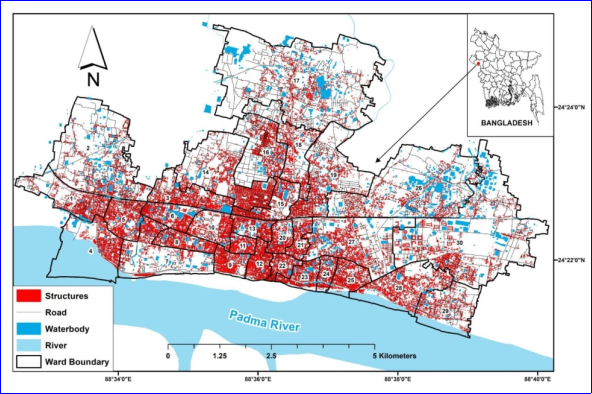
Figure 2. Rajshahi City Corporation (RCC) Area.
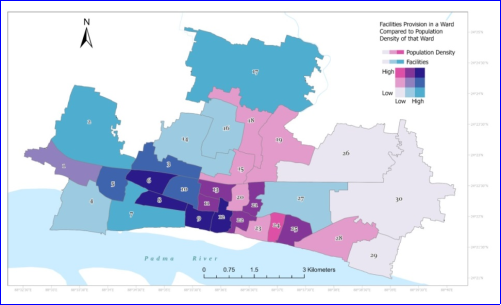
Figure 3. Facility Provision Compared to Population Density.
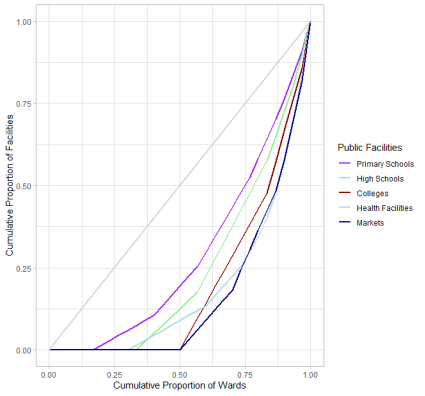
Figure 4. Lorenz Curve of the Public Facilities in Study Area.
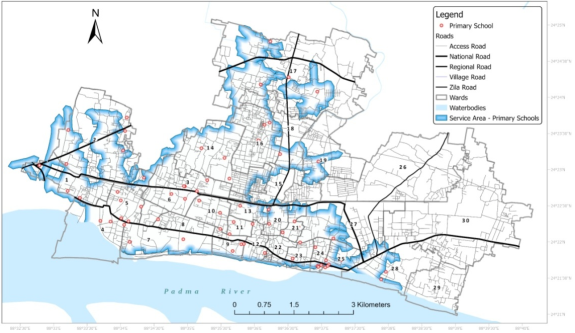
Figure 5. Service Area of the Primary Schools.
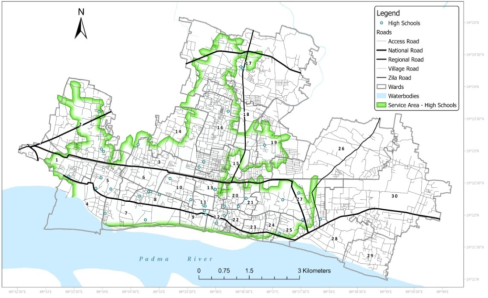
Figure 6. Service Area of the High Schools.
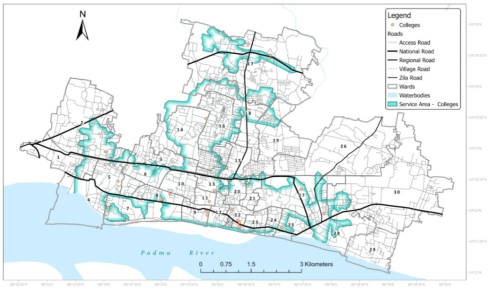
Figure 7. Service Area of the Colleges.
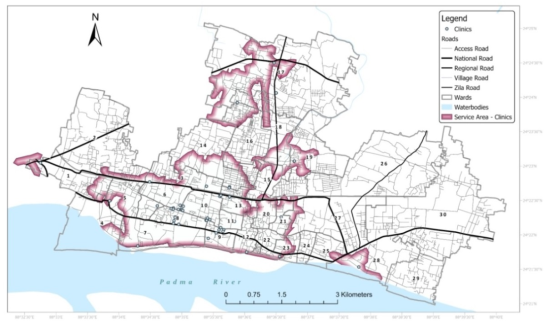
Figure 8. Service Area of the Clinics.
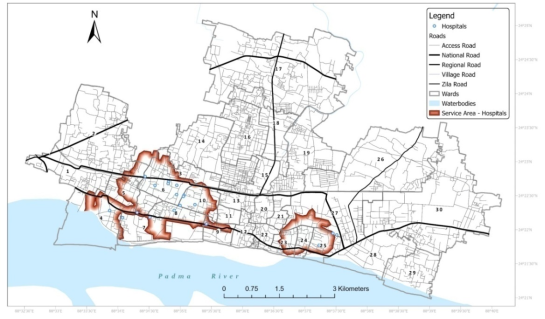
Figure 9. Service Area of Hospitals.
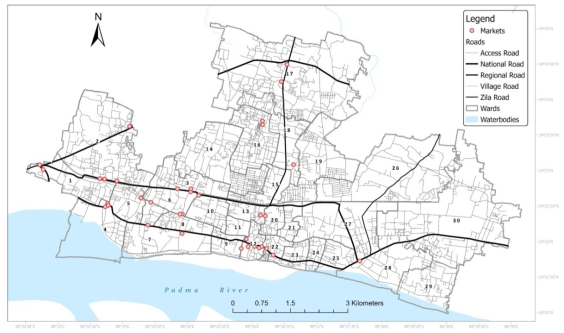
Figure 10. Market Locations in the Rajshahi City Corporation (RCC).
Information

