Research Article | | Peer-Reviewed

Patronage Pattern and Accessibility of Healthcare Facilities in Urban Slums and Informal Settlements in Ibadan Metropolis

Received: 28 March 2024     Accepted: 11 April 2024     Published: 29 July 2024
Views:       Downloads:
Abstract

Slums and informal settlements are residential areas physically and socially disintegrated. In spite of this, inadequate health-related data on slum areas and informal settlements has led to inappropriate and unrealistic allocation of healthcare resources by the public and private health providers. This study investigates the patronage pattern and accessibility of healthcare facilities to residents of urban slums and Informal settlements in Ibadan Metropolis, a rapidly growing urban area in Nigeria facing challenges related to urbanization and healthcare infrastructure. Data were collected from both primary and secondary sources. Structured questionnaire was administered on 1,389 residents of the slummy neighbourhoods and informal settlements in Ibadan metropolis, and obtained data were analyzed using descriptive and inferential statistics. Results revealed that out of 109 neighbourhoods, 42.1% were categorized as slummy neighbourhoods, 36.7% as slums/informal settlements, while 21.2% were informal settlement using slummy and informality conditions respectively. Results revealed that distance to health facility (β= -0.353, p<0.05), educational qualification (β=-0.063, p<0.05) and household size (β= -0.052, p<0.05) had an inverse relationship with patronage of health facilities, while age (β=0.086, p< 0.05) had a positive relationship. It was also revealed that access to PHC and dispensary/clinic in slummy neighbouhoods and slum/informal settlements is higher compared to informal settlements in the study area. The study therefore recommends implementation of slum improvement program for the slummy and slums/informal neighbourhoods, provision of additional healthcare facilities to be located especially in the slummy neighbourhoods and informal settlements to ensure equitable distribution.

Published in Urban and Regional Planning (Volume 9, Issue 3)
DOI 10.11648/j.urp.20240903.12
Page(s) 71-87
Creative Commons

This is an Open Access article, distributed under the terms of the Creative Commons Attribution 4.0 International License (http://creativecommons.org/licenses/by/4.0/), which permits unrestricted use, distribution and reproduction in any medium or format, provided the original work is properly cited.

Copyright

Copyright © The Author(s), 2024. Published by Science Publishing Group

Keywords

Urban Slum, Informal Settlements, Patronage Pattern, Accessibility, Healthcare Facilities, Ibadan Metropolis, Nigeria

1. Introduction
The term "urban slums" encompasses a diverse array of informal settlements characterized by overcrowded living conditions, poor sanitation, and substandard housing. These areas represent pockets of deprivation where residents often grapple with socioeconomic challenges that intersect with healthcare access. According to Babalola, S., & Fakayode, O. , the prevalence of slum settlements in Ibadan is reflective of broader global trends, where rapid urbanization outpaces infrastructure development, leading to the proliferation of informal settlements with limited access to essential services.
In the sprawling urban landscape such as Ibadan Metropolis, the dynamics of healthcare access and utilization present unique challenges, particularly within the context of urban slums and informal settlements . As urbanization accelerates, these marginalized communities face disproportionate barriers to healthcare, characterized by limited access to quality facilities, inadequate infrastructure, and socioeconomic disparities. Understanding the patronage patterns and accessibility of healthcare facilities in these settings is imperative for addressing the health needs of vulnerable populations and promoting health equity.
Accessibility to healthcare facilities is a fundamental determinant of its utilization for urban slum dwellers . Studies have shown that geographical proximity, affordability, and the quality of services significantly influence individuals' decisions regarding healthcare-seeking behavior . The spatial distribution of healthcare facilities and the presence of barriers such as transportation constraints contribute to disparities in healthcare access among slum residents .
Moreover, patronage patterns of healthcare facilities within urban slums reflect the complex interplay of socioeconomic, cultural, and structural factors. Slum residents often navigate a spectrum of healthcare options, ranging from formal healthcare providers to traditional healers and self-medication practices . The choice of healthcare provider is influenced by factors such as affordability, perceived quality of care, trust in the provider, and cultural preferences .
Despite the recognition of these challenges, there remains a gap in comprehensive research focusing on the patronage patterns and accessibility of healthcare facilities especially within urban slums and informal settlements in Ibadan Metropolis. This study seeks to address this gap by examining the spatial distribution of healthcare facilities, assessing the barriers to access, and exploring the factors shaping healthcare-seeking behavior among slum residents. By elucidating these dynamics, the findings of this study aim to inform targeted interventions and policy measures aimed at improving healthcare access and delivery for marginalized urban populations in Ibadan Metropolis.
2. Review of Literature
Research on the patronage patterns and accessibility of healthcare facilities in urban slums and informal settlements offers valuable insights into the healthcare-seeking behaviors and challenges faced by marginalized populations. A study by Olaniyan and Omotosho investigated healthcare-seeking behavior among residents of urban slums in Ibadan, revealing complex patterns influenced by factors such as socioeconomic status, perceived quality of care, and cultural beliefs. The findings underscored the importance of understanding the diverse needs and preferences of slum residents to improve healthcare access and utilization. Another relevant study by Ajibade and Ogunmola focused on the spatial distribution of healthcare facilities in Ibadan, assessing their accessibility and implications for health outcomes. The research highlighted disparities in healthcare access between slum areas and more affluent neighborhoods, emphasizing the need for targeted interventions to address geographic barriers and improve service delivery in underserved communities.
Gidado and Ayanwale explored the patronage patterns of healthcare facilities among urban slum residents in Ibadan Metropolis, shedding light on the factors influencing individuals' choices of healthcare providers. The study identified proximity, affordability, and trust in the provider as key determinants of healthcare-seeking behavior, highlighting the importance of addressing these factors to enhance healthcare access and utilization.
Additionally, Ogunmola and Oladosu conducted a study on the accessibility of healthcare services and its implications for health outcomes in urban slums in Ibadan. Their findings revealed significant challenges related to transportation barriers, inadequate infrastructure, and limited availability of services, underscoring the need for comprehensive strategies to improve accessibility and reduce health disparities in slum areas. Furthermore, Babalola, S., & Fakayode, O. provided insights into the socio-economic dynamics of urban slums in Ibadan, emphasizing the intersecting factors of poverty, housing conditions, and social networks that shape residents' health experiences. The study called for holistic approaches that address the root causes of health inequities in slum communities and promote social justice. In another study of Patel, Sandbrook and Fisher in South Africa, insights into the experiences of urban poverty as the major cause of accessing basic human needs and strategies for addressing it in the global south, focusing specifically on the Eastern Cape region of South Africa were offered. Through qualitative research on urban poor communities, the authors explore the multifaceted nature of urban poverty and the diverse coping mechanisms employed by residents. Their work emphasizes the importance of participatory approaches and community engagement in designing interventions that respond to the unique needs and aspirations of urban poor populations. By centering the voices of the urban poor, the study contributes to a deeper understanding of urban poverty dynamics and informs more effective and contextually appropriate poverty alleviation strategies in order to enhance access to basic facilities such as healthcare.
Babalola, S., & Fakayode, O. conducted research on the determinants of healthcare facility choice among slum dwellers in Ibadan Metropolis. Their study delved into the factors influencing individuals' decisions regarding which healthcare providers to patronize, including affordability, perceived quality of care, and proximity to their place of residence. The findings emphasized the importance of addressing these factors to enhance healthcare accessibility and utilization among slum populations. Moreover, Adebayo and Azuzu explored the role of community engagement in improving healthcare access and utilization in urban slums in Ibadan. Their study highlighted the importance of involving local communities in decision-making processes related to healthcare planning, service delivery, and health education initiatives. Community engagement was found to foster trust, empowerment, and ownership among slum residents, leading to more effective and sustainable healthcare interventions.
Furthermore, a study by Babalola, S., & Fakayode, O. examined the challenges and opportunities for healthcare delivery in urban slums in Ibadan, with a focus on innovative approaches to address the unique needs of slum populations. The research underscored the importance of adopting flexible and community-driven strategies that take into account the cultural, social, and economic context of urban slums to improve healthcare access and outcomes. In addition, Ayiti investigated the impact of environmental factors on healthcare accessibility in urban slums in Ibadan, highlighting the role of infrastructural development, environmental sanitation, and housing conditions in shaping residents' health experiences. The findings emphasized the need for integrated approaches that address both physical and social determinants of health to promote well-being in slum communities.
However, these studies contribute to understanding of the patronage patterns and accessibility of healthcare facilities in urban slums but without a focus on distinction between informal settlements and slums. This is the focus of this study which does not only attempt to evaluate access to healthcare facilities and services in the two, but also analyze the distinction and nexus between the two categories.
3. Material and Methods
3.1. The Study Area (Ibadan Metropolis, Nigeria)
Source: Oyo State Ministry of Lands, Housing and Urban Development (2021)

Download: Download full-size image

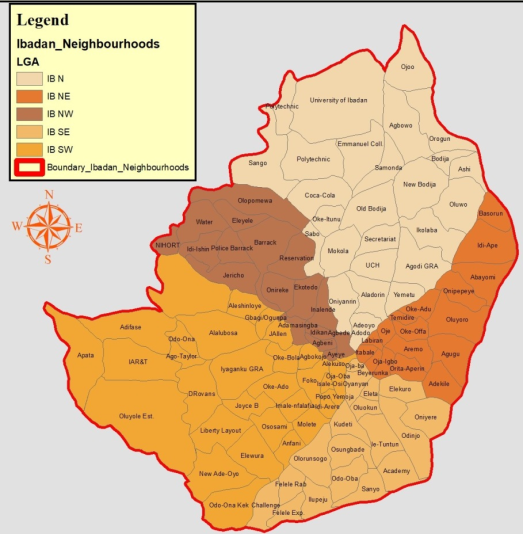
Figure 1. Five Urban Local Government Areas of Ibadan City and the respective Neighbourhoods.
Ibadan metropolis is located at longitude 7°201E and 70401E and latitude 3°351N and 4°101N. As the crow files, it is 145km north east of Lagos and 345km southwest of Abuja, the federal capital (See Figure 1). It is an inland city built on a ridge with altitude ranging from 150 to 275m. Three major rivers drain the city. These are Ogunpa, Ogbere and Ona with many tributaries. The geology of the city consists of the basement complex, mainly the metamorphic type of the pre-cambrian age. The rock components are covered with weathered regolith's . The soils of Ibadan belong to a major group called the tropical Ferruginous soil. The soils generally have low nutrient holding capacity due to their location, and exchange capacities of between 5.0 and 12.0 milli-equivalent per 100 grains of dry soil. Ibadan is the capital city and the commercial heart of Oyo state where accommodation, entertainment, dining and shopping malls, and social and health services are located. Ibadan region comprises eleven LGAs out of which five are urban LGAs and the remaining six are less city LGAs. The population of Ibadan five urban LGAs in 2006 was put as 1,338,607 (NPC, 2006) and with an annual growth rate of 3.2% (NPC web), the projected population of the LGA in year 2022 was at 2,173,160. The increase in annual growth of the population is a result of the administrative role as center of commercial activities which attract people to the city.
3.2. Study Framework: Urban Slums Vs Informal Settlements
It has been established in literature that even when they have similar physical outlook, “Slums” and “informal settlements” are not the same. While slums are physically deteriorated urban neighborhoods characterized by substandard housing and squalor, informal settlements are illegal or less recognized settlements accommodating illegal migrants, poor households or business operations who could not afford formal housing, but line or operate in makeshifts, semi-permanent or unauthorized physical development. What is common to the two, however is poverty, as the two are usually motivated by poverty through other varying factors account for their emergence.
The nexus between slums and informal settlements is such that neighbourhoods within the city system tend to show slummy conditions and not necessarily for lack of approved plan but poor maintenance and management culture. However, an informal settlement has tendency to grow fast into a slum. This is deeply rooted in a combination of structural, economic, social, and governance factors. Addressing this complex issue requires a holistic and integrated approach that combines urban planning, poverty alleviation, community empowerment, and effective governance to break the cycle of poverty and informality and improve the overall quality of life for residents in these areas.
Using the set theory application (Figure 2), the neighbourhoods within the city (represented by ‘U’ as universal set) have sets A and B, and can be contextually and conceptually described with elements contained in such subsets as: a, b, ab and c, such that U=a+b+ab+c, but A=a+ab, while B=b+ab. Set A can be regarded as areas within the city which are slummy in nature based on the level of deterioration and decay. Set B refers to areas within the city system which are informal in nature i.e areas which are not planned abinixio whether or not they are exhibiting slummy conditions. Areas represented by ‘c’ are neighbourhoods within the city system which are relatively planned and with less slummy features; the areas are regarded as neighbourhoods without significant slummy and informality conditions (Figure 2).
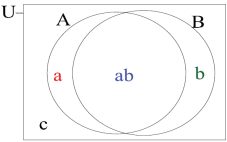
Figure 2. Urban City System.
Source: Adapted from Jelili (2006) and Authors Conceptualization, (2022)
U = The Urban city system
A = Slummy Environmnent/Neighbourhoods
B = Informal Environment/Neighbourhoods
a = Slummy Neighbourhoods
b = Less degenerated Informal Settlements
ab = Areas exhibiting slummy and informality conditions
c = Relatively Planned, not slummy environment (i.e No Slum, Less informality condition)
Areas represented by ‘a’ are areas within the city system which may be relatively planned, but exhibiting a significant level of urban decay. The areas denoted a ‘b’ could be described as those neighbourhoods within the city which are largely informal in nature but cannot be described as slums. The areas developed without proper planning and management thereby creating poor accessibility as a result of lack of planning but are not slums yet. The neighbourhoods are less degenerated informal settlement.
The areas represented by ‘ab’ are described as neighbourhoods within the city system, which possess both the slummy and informality conditions. It covers the large extent of a city core area and degenerating high density neighbourhoods in the city. It is necessary to categorize neighbourhoods within the city system like this, so that, while evolving strategies for their improvement, the idea of one-size fits all can be guided against.
The study was interested on assessing patronage pattern and accessibility of healthcare facilities in urban slums and informal settlements in Ibadan Metropolis. The data set used for this study was collected using a structured questionnaire administered on the residents of the five urban Local Government Areas of Ibadan metropolis. The study area comprised of a total 138,864 housing units across the selected LGAs. A systematic sampling technique was employed in selecting 1.0% from the identified 109 neighbourhoods. In the selected neighbourhoods, the respondents were the household heads but where the household head was not available, an adult was sampled. In all a total of 1,389 questionnaires were administered. Set model, multiple regression, ANOVA and Chi-Square analytical techniques were adopted.
4. Results and Discussion
4.1. Categorization of Urban Neighborhoods into Slums and Informal Settlements Within Ibadan Metropolis (Neigh. 1-109)
Neighborhoods are categorized into slums, informal settlement, slum/informal settlements and relatively orderly and planned settlements (Table 1). This study is concerned with only three categories (slums, Informal settlements and Slums/informal neighbourhoods). The two indexes used were “slummy condition” and “informality condition”. Slummy condition was measured using the proportion of dwellings with poor water and sanitation with variables such as sources of water supply, sewage disposal within the neighbourhood, waste management method, environmental condition, drainage facilities among others while informality condition was analysed using variables such as nature of land tenure, building approval, type of settlements, density type. However, it was established that any neighbourhood with a percentage higher than the total average proportion was classified as a slum or informal neighbourhood accordingly and any neighborhood with percentage lesser than the total average proportion was classified as less degraded. The slums/Informal neighbourhoods were identified when the percentages of slummy and informality conditions were higher than the average score of the two indexes. The scores of neighbourhoods on these two indexes determine whether a neighbourhood is a slum, informal or slums/informal settlements.
Table 1. Urban Neighbourhoods Ranked based on Slummy and Informality Conditions.

SN

Neighbourhoods

*Slummy Condition (Poor water/Sanitation) (%)

**Informality Condition (Bld Without Plg/Approval) (%)

a

b

ab

c

1

Oniyanrin, Inalende,

63.3

56.0

2

Mokola

54.0

56.0

3

Secretariat

38.0

35.4

4

Sabo Quart

54.4

58.0

5

Oke-Itunu,

57.0

67.0

6

Sango

58.0

71.2

7

Emmanuel

32.2

35.0

8

Polytechnic

35.0

40.6

9

University of Ibadan

28.0

33.0

10

Abadina Quarters

27.0

30.3

11

Coca-Cola

39.5

56.0

12

Bodija Estate (Old)

37.0

34.4

13

Samonda, Aerodrome,

32.0

38.0

14

Adeoyo,

56.4

60.2

15

Yemetu

58.0

63.0

16

UCH

31.0

55.4

17

Ikolaba, Idi-Ape, Oluwo

32.3

37.0

18

Agodi GRA

28.0

32.0

19

Igosun, Kambi,

61.4

65.2

20

Ashi

41.0

46.0

21

New Bodija

29.0

34.0

22

Bodija Railway

31.1

54.3

23

Bashorun

41.0

45.0

24

Agbowo, Orogun

53.0

59.4

25

Orogun Express

49.3

53.0

26

Ojoo Orogun Side

46.0

48.4

27

Labiran

67.0

72.0

28

Aremo

56.0

60.3

29

Oje

57.4

62.0

30

Agugu

60.0

65.0

31

Ita-Bale,

60.0

71.4

32

Belyerunka,

59.2

64.0

33

Kosodo, Oja-Igbo

64.0

60.8

34

Ile-Aperin,

62.3

58.0

35

Adekile, Koloko

67.0

49.0

36

Oluyoro Hospital

66.0

71.7

37

Oke-Adu,

61.0

68.0

38

Oke-Irefin Itutaba

68.3

69.0

39

Oke-Offa Atipe

69.0

71.5

40

Abayomi, Iwo Road,

56.3

65.0

41

Basorun, Idi-Ape, Oyo

47.0

52.4

42

Holy Trinity, Onipepeye

39.0

41.0

43

Yanbule, Basorun MKT

37.0

36.0

44

Eleta, Labo,

69.0

74.6

45

Oke-Oluokun

64.4

74.0

46

Ile-Tuntun, Ode-Aje,

63.0

76.3

47

Odinjo, Idi-Aro,

62.3

59.0

48

Oranyan, Omiyale,

58.3

59.4

49

Oniyere, Modina,

59.2

62.0

50

Oja-Oba, Laamo

71.0

68.7

51

Elekuro, Labo,

67.0

76.0

52

Academy, Ifedapo,

63.4

65

53

Kudeti, Bode

43.0

58.0

54

Olorunsogo Molete

41.2

54.0

55

Osungbade,

57,0

63.0

56

Felele/Express

39.3

35.4

57

Ilupeju, Fajemisi

37.3

53,0

58

Odo-Oba

56.0

65.0

59

Sanyo

57.0

63.2

60

Orita-Challenge

39.0

55.0

61

Felele Rab

38.4

39.0

62

Ayeye, Agbaje

67.0

78.4

63

Agbede-Adodo,

59.5

64.0

64

Agbeni, Ile-Adebisi

59.0

63.0

65

Ekotedo,

54.0

64.2

66

Inalende,

62.0

51.0

67

Onireke GRA,

30.4

35.0

68

Idikan

57.0

67.4

69

Links Reservation

34.0

40.0

70

Letmuck Barracks

35.0

38.0

71

Eleyele, Benjamin

38.3

42.5

72

Olopomewa

43.0

58.0

73

Eleyele Water Works

36.0

54.0

74

Eleyele Police Barracks,

34.3

36.0

75

Jericho Nursing Home

32.0

38.3

76

Idi-Ishin, Omo Oba

35.0

46.0

77

NIHORT Quarters

32.0

38.4

78

Adamasigba

39.4

35.0

79

Alekuso, Akinyo

62.0

58.0

80

Isale-Osi, Born-Photo

65.0

72.5

81

Foko, Asaka

64.0

68.0

82

Oke-Ado

52.4

59.0

83

Imale-Nfalafia,

45.0

49.0

84

Joyce-B,

41.0

45.3

85

Ososami,

39.2

56.0

86

Elewura,

41.0

54.0

87

Akinyemi, D-Rovans

39.4

57.0

88

Oluyole Estate

38.0

46.3

89

Liberty Layout,

34.0

40.0

90

Ile-Oba, Ile-Ida,

67.0

79.0

91

Idi-Arere, Olokobi

64.0

76.0

92

Popoyemoja

63.3

75.4

93

Molete, U.M.C. P

42.0

49.0

94

Anfani Layout,

41.0

48.0

95

Orita-Ikereku,

42.0

47.3

96

Agbokojo, Ita-Maya,

65.1

60.0

97

Oke-Bola, Seventh D

43.0

54.3

98

Iyaganku GRA,

34.0

39.2

99

A.I R & T, OYSADEP

35.0

40.0

100

Apata, Aba-Alamu,

57.0

55.0

101

Adifase, Bora

58.3

55.2

102

Alalubosa, Railway

32.0

39.0

103

Odo-Ana,

58.2

56.0

104

Idi-Ishin, NIHORT

37.0

40.0

105

Aleshinloye Market,

38.0

39.0

106

J. Allen, Seventh

35.1

37.0

107

Ogunpa Cathedral

41.0

55.2

108

Gbagi, Ogunpa

60.1

61.0

109

Ago-Taylor,

41.4

54.0

Total

4823.5

5725.4

Source: Field Survey (2022)
*Slum: Average Proportion 4823.5/109 = 44.25%
**Informality: Average Proportion 5725.4/109 = 52.52%
a: Slum neigbourhoods
b: Informal neighbourhoods
ab: Slums/informal neighbourhoods
c: Less degraded, orderly neighbourhoods
Source: Author’s Field Survey, 2022; patterned after Jelili, 2006

Download: Download full-size image

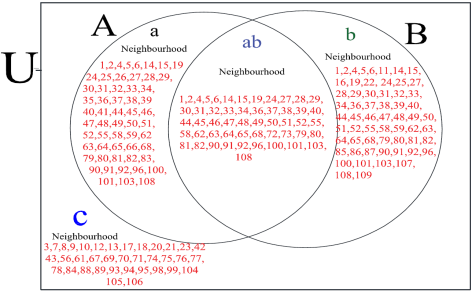
Figure 3. Categorization of Urban Neighborhoods into Slums and Informal Settlements within Ibadan Metropolis (Neigh. 1-109).
In the context of this study, the set U is the universal set which represents the total number of 109 neighborhoods in Ibadan metropolis, as indicated in Table 1. Out of these neighborhoods, it was revealed that 57 were classified as slums and not informal settlements (represented by 'a' in Figure 3), indicating that the majority of neighborhoods within the study area ranked above the total average proportion of 44.25% with poor water and sanitation conditions. This finding aligns with previous studies of Jelili that decaying neighbourhoods provide cheap accommodation for the homeless (Figure 4).
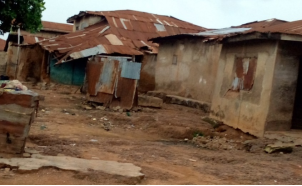
Figure 4. Slum Neighbourhood in Bere, Ibadan.
Moreover, subset ‘b’ encompasses neighborhoods lacking planning approval, surpassing the overall average proportion of 52.52%. These informal settlements, totaling 67 urban neighborhoods, are primarily situated in the central and high-density areas of Ibadan. Examples include Molete, Adamasingba, Oja Oba, Oje, Odinjo, Inalende, Sabo, Odo Oba, Oja Igbo, Beere, Born Photo, Gege, Ita Maya, and Agbokojo, among others (Figure 5). These areas exhibit a high level of informality but are not categorized as slums. Instead, they are adjacent to slum areas and display deteriorating features. While located outside the traditional core, they still fall within Ibadan's high and medium-density zones.
Furthermore, the set ‘ab’ comprises neighborhoods characterized by both slum-like conditions and informality, encompassing 52 neighborhoods (56%). These areas suffer from poor water and sanitation conditions and lack planning approval. Examples of such areas include Oja Oba, Oje, Odinjo, Inalende, Sabo, Odo Oba, Oja Igbo, Beere, Born Photo, Gege, Ita Maya, Agbokojo, Kudeti, Adekile, Foko, Adamasingba, Odo-Ona, Agugu, Mokola, Coca-Cola, Oluyoro, Ekotedo, Molete, and Olorunsogo, among others. These findings underscore the prevalence of informality and substandard living conditions in various neighborhoods across Ibadan, highlighting the need for targeted interventions to address these challenges and improve the overall quality of life for residents.
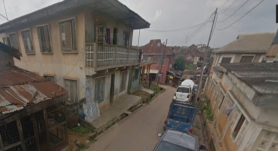
Figure 5. Informal Settlement at Molete, Ibadan.
Hence, the set ‘c’ represents neighborhoods that were relatively planned, well-structured, and orderly, with relative access to adequate water supply and sanitation practices. These neighborhoods ranked below the total average proportion of 44.25% and included areas like Iyaganku, Onireke, Joyce B, Sanyo, Emmanuel, Polytechnic, University of Ibadan, Jericho Nursing home, Eleyele Police Barracks, Nihort Quarters, Bodija estate, secretariat, Agodi GRA, and Samonda, among others.
4.2. Socioeconomic Characteristics of Respondents across the Neighbourhood Type
The findings from Table 2 depict notable demographics and socio-economic attributes of respondents within the study area. It reveals that 42.3% of respondents fall within the age range of 36-45, with 39% falling within the 26-35 age bracket. Additionally, 57.9% of respondents are male, and 42.1% are female. Moreover, educational attainment varies, with 29.9% holding Secondary Education Certificates, 19.1% having National Diploma (ND) or National Certificate of Education (NCE), and 17.1% possessing first-degree certificates (BSc/HND). Interestingly, more than half (56.6%) of respondents are engaged in personal business, while 15.8% are public employees, and 15% are either in school or engaged in apprenticeships. Regarding marital status, 79.9% of respondents are married, 3.5% are widowed, and 2.7% are separated or divorced.
Moreover, regarding access to healthcare, the majority (89.8%) of respondents confirm the presence of a health facility within their neighborhood. However, significant proportions of respondents from slum/informal neighborhoods contribute to this statistic, indicating potential disparities in access. Financial constraints related to accessing healthcare are evident, with 45.6% of respondents spending between ₦101-₦300 on transportation to the nearest healthcare facility, and 65.2% spending less than ₦5000 on healthcare treatment in the last month. Additionally, household size and income vary across neighborhood types, with slummy neighborhoods exhibiting the highest mean household size (5.6) and lowest average monthly income (₦35,156), indicating economic challenges that may hinder healthcare access. Conversely, respondents from informal neighborhoods report the highest average monthly income (₦76,433), potentially affording better access to healthcare services. These disparities highlight the complex socio-economic dynamics influencing healthcare accessibility within urban settings, particularly in slum and informal settlements where large family sizes and low incomes present significant barriers to access.
Table 2. Socioeconomic Characteristics of Respondents.

Variable

Neighbourhood

Slum

Slum/informal

Informal

Total

F

%

F

%

F

%

F

%

Age

18-25

40

2.9

40

2.9

12

0.9

92

6.6

26-35

240

17.3

222

16.0

80

5.7

542

39.0

36-45

256

18.4

243

17.5

89

6.4

588

42.3

46-55

50

3.6

51

3.7

19

1.4

120

3.4

56 and above

28

2.0

10

0.7

9

0.6

47

3.4

Total

614

44.2

566

40.7

209

15.0

1389

100

Gender

Male

360

25.9

323

23.3

121

8.8

804

57.9

Female

254

18.3

243

17.5

88

6.3

585

42.1

Total

614

44.2

566

40.7

209

15.0

1389

100

Education

Non Formal

137

9.9

78

5.6

22

1.5

237

17.1

Primary

84

6.0

77

5.5

19

1.4

180

13.0

Secondary

139

10.0

215

15.5

28

4.4

415

29.9

ND/NCE

125

9.0

96

6.9

32

3.2

265

19.1

BSC/HND

117

8.4

85

6.1

62

4.4

263

18.9

Post-Graduate

12

0.9

15

1.1

2

0.2

29

2.1

Total

614

44.2

566

40.7

209

15.0

1389

100

Occupation

Student/apprentice

76

5.5

99

7.1

24

1.7

208

15.0

Unemployed

83

6.0

28

2.0

15

1.1

133

9.6

Personal business

376

27.1

306

22.0

57

4.1

786

56.6

Public employee

57

4.1

117

8.4

27

1.9

219

15.8

Retiree

18

1.3

16

1.2

2

0.1

38

2.7

Others

4

0.3

0

0

0

0

5

0.4

Total

614

44.2

566

40.7

125

9.0

1389

100

Variable

Neighbourhood

Slum

Slum/informal

Informal

Total

F

%

F

%

F

%

F

%

Marital Status

Single

88

6.3

76

5.5

17

1.2

193

13.9

Married

483

34.8

458

33.0

104

7.5

1110

79.9

Divorced

27

1.9

14

1.0

3

0.2

48

3.5

Separated

16

1.2

18

1.3

1

0.1

38

2.7

Total

614

44.2

566

40.7

125

9.0

1389

100

Location of health facility

Within Neighbourhhod

518

37.3

539

38.8

111

8.0

1248

89.8

Outside Neighbourhood

96

6.9

27

1.9

14

1.0

141

10.2

Total

614

44.2

566

40.7

125

9.0

1389

100

Cost of travel to nearest health facility

₦100 or less

176

12.7

188

13.5

34

2.4

417

30.0

₦101-300

286

20.6

237

17.1

72

5.2

633

45.6

₦301-500

133

9.6

99

7.1

15

1.1

266

19.2

₦501-1000

17

1.2

34

2.4

2

0.1

60

4.3

Above ₦1000

2

0.1

8

0.6

2

0.1

11

0.9

Total

614

44.2

566

40.7

125

9.0

1389

100

Amount spent on health treatment in the last one month

Less than ₦5000

408

29.4

355

25.6

81

5.8

906

65.2

₦6000-20000

198

14.3

192

13.8

44

3.2

455

32.8

₦20001-50000

8

0.6

19

1.4

0

0.0

28

2.0

Total

614

44.2

566

40.7

125

9.0

1389

100

Variable

Slum

Slum/informal

Informal

Household Size (Mean)

5.5902

5.0212

4.9016

Monthly income (Mean)

₦35,156

₦43,024

₦76,433

Source: Author’s Field Survey, 2022
4.3. Environmental and Housing Condition in the Neighbourhoods
The findings presented in Table 3 unveil significant insights into the waste disposal practices and environmental conditions within the study area. Notably, 46.9% of respondents across the three selected neighborhoods dispose of their solid waste beside buildings, while 30.4% utilize waste bins. Moreover, 16% resort to dumping waste in nearby streams or rivers, and 6% opt for burning waste on main access roads, with a minor 0.8% employing other means. Interestingly, the methods of waste disposal exhibit variability among neighborhoods, with a higher proportion of respondents in slum areas resorting to disposal beside buildings and in nearby streams or rivers. These findings underscore the prevailing environmental challenges, including poor waste management practices, which have been linked to flooding issues in urban informal settlements such as those in Ibadan Metropolis .
Regarding drainage availability, approximately 58.7% of respondents indicated the absence of drainage infrastructure in their neighborhoods. This lack of drainage was particularly pronounced in areas categorized as slum/informal settlements. The inadequate drainage network is identified as a major challenge contributing to indiscriminate construction along drainage channels and exacerbating flood risks. Such challenges highlight the pressing need for improved urban planning and infrastructure development initiatives to address drainage deficiencies and mitigate flood hazards in these vulnerable urban areas.
In terms of the overall environmental condition, a substantial proportion of respondents rated it as fair (49.7%), while 31% rated it as poor, and 19.3% rated it as good. Notably, respondents residing in slum/informal neighborhoods rated the environmental condition as poor compared to other neighbourhoods. These findings underscore the urgent need for concerted efforts to enhance environmental quality and address infrastructure deficits in marginalized urban settlements. Improved environmental conditions not only contribute to the well-being of residents but also foster sustainable urban development and resilience to environmental hazards.
The results on accessibility to housing reveals significant challenges, with a notable portion of respondents indicating reliance on footpaths (46.2%) or earthward roads (33.6%) to access their homes. This indicates a lack of proper road infrastructure and physical planning, particularly in slum and informal settlement areas. Residents often face difficulties accessing their homes, sometimes requiring long walks from parking areas due to inadequate paved roads. These findings underscore the importance of addressing infrastructural deficiencies and implementing inclusive urban planning strategies to improve accessibility and enhance the quality of life for residents in urban slums and informal settlements.
Table 3. Environmental Conditions across Neighbourhood Types.

Solid Waste Disposal

Neighbourhood

Slum Neighbourhoods

Slum/informal Neighbourhoods

Informal Settlement

Total

F

%

F

%

F

%

F

%

Dumped in Nearby Stream/River

144

10.4

45

3.2

24

1.7

222

16

Dispose beside the building

334

24.0

249

17.9

34

2.4

651

46.9

Dump in waste bin

102

7.3

237

17.1

44

3.2

422

30.4

Burn on the main access road

30

2.2

32

2.3

20

1.4

83

6.0

Others

4

0.3

3

0.2

3

0.2

11

0.8

Total

614

44.2

566

40.7

125

9.0

1389

100

Availability of drainage

YES

307

22.1

378

27.2

75

5.4

816

58.7

NO

307

22.1

188

13.5

50

3.6

573

41.3

Total

614

44.2

566

40.7

125

9.0

1389

100

General Environmental Conditions

Good

66

4.8

149

10.7

28

2.0

268

19.3

Fair

221

15.9

366

26.3

60

4.3

691

49.7

Poor

327

23.5

51

3.7

37

2.7

430

31.0

Total

614

44.2

566

40.7

125

9.0

1389

100

Accessibility

Footpath

290

20.9

249

17.9

73

5.3

642

46.2

Earthward

200

14.4

218

15.7

19

1.4

467

33.6

Paveward

124

8.9

99

7.1

33

2.4

280

20.2

Total

614

44.2

566

40.7

125

9.0

1389

100

Building Approval

YES

170

12.2

323

23.3

57

4.1

592

42.6

NO

444

32.0

243

17.5

68

4.9

797

57.4

Total

614

44.2

566

40.7

125

9.0

1389

100

Source: Author’s Field Survey, 2022
4.4. Influence of Socio-Economic Characteristics of Residents on Patronage of Health Care Facilities in the Study Area
The focus of this study was to examine the relationship between independent variables (age, gender, educational qualification, location of health facility, average monthly income, household size and average distance to facility) and patronage of health facilities. In order to achieve this, multiple regression analysis was conducted. Since respondents in the study area make use of five (5) different health facilities (Dispensary/clinic, PHC, General Hospital, Tertiary Hospital and Specialist Hospital), regression models were generated for each facility in the preceding section. The essence of doing this is to know whether the independent variables that influence the different health facilities varied.
The multiple regression results for the five (5) different health facilities in Table 4 reveals that distance to health facility has an inverse relationship (p<0.05) with patronage in all the five (5) health facilities. What this suggests, is that a unit decrease in distance to health facility would bring about an increase in patronage . Also, Age has a positive relationship with patronage of PHC (p<0.05) and General Hospital. Educational qualification has an inverse relationship (p<0.05) with patronage of Dispensary and PHC. Meaning that respondents with low educational qualification tended to patronize Dispensary and PHC more than those with higher educational qualifications. Location of facility significantly (p<0.05) influence patronage of General Hospital, Tertiary Hospital and Specialist Hospital. Gender has inverse relationship (p<0.05) with patronage of PHC, which suggests that women are likely to visit PHC more than men in the study area majorly for antenatal and vaccination of their children. Household size has an inverse relationship (p<0.05) with patronage of General Hospital. The frequency of visit to General Hospital was less for larger households and vice versa.
In terms of the strength of the five (5) regression models, Dispensary/Clinic model with a coefficient of determination (R2) of 0.421a was adjudged the best with 42.1% of change being accounted for jointly by seven predictors in patronage of dispensary/clinic followed by Specialist Hospital model (R=0.395a) with 39.5% of a change in patronage accounted for jointly, General Hospital model (R=0.367a) with 36.7% jointly accounted for in patronage, Tertiary Hospital (R=0.313a) with 31.1% of variation in patronage, and PHC (R=0.186a).
The results have shown that the socio-economic attributes and other factors that influence patronage of health facilities in the study area varied. However, there might be some other latent factors that may influence patronage of health facilities in the study area aside the ones identified in this study.
Table 4. Summary of the Regression Models for Health Facilities in the Study Area.

Independent Variables (Predictors)

Dispensary

PHC

General Hospital

Tertiary Hospital

Specialist Hospital

Standardized Coefficients (Beta)

Gender

(.021)

(-.063)**

(-.032)

(-.050)

(.005)

Age

(.086)**

(.044)

(.064)**

(-.004)

(.048)

Educational qualifications

(-.063)**

(-.078)**

(-.013)

(.015)

(.030)

Household size

(-.014)

(.016)

(-.052)**

(-.005)

(-.020)

Average monthly income

(-.012)

(-.012)

(.136)**

(.211)**

(.210)**

Average distance to the health facility

(-.353)**

(-.084)**

(-.171)**

(-.102)**

(-.211)**

Location of the health facility

(-.029)

(-.038)

(.257_**

(.108)**

(.124)**

R =0.421a

R=0.186a

R=0.367a

R=0.313a

R=0.395a

Note statistics is significant at 0.05 (**)
Source: Author’s Field Survey, 2022
4.5. Spatial Pattern of Patronage of Health Facilities Across the Neighbourhood Types
A one-way ANOVA and post-hoc comparison test were conducted to analyze the level of patronage of healthcare facilities across different types of neighborhoods. The analysis (Table 5) revealed significant differences in the patronage of dispensaries/clinics across settlements (F=9.194, p<0.05). Mean patronage values showed that the level of patronage of dispensaries is higher in informal settlements (mean=3.2) compared to other settlements. Similarly, significant differences were found in the patronage of primary healthcare facilities across neighborhoods (F=3.235, p<0.05), with higher patronage in slum and slum/informal areas compared to informal settlements.
No significant variation was observed in the patronage of General hospitals across settlement types (F=910, p>0.05), indicating similar mean patronage across the settlements. However, significant variation was found in the mean patronage of Tertiary hospitals across settlements (F=3.994, p<0.05). Post-hoc comparison tests revealed that informal neighborhoods had higher patronage compared to slum and slum/informal areas. Additionally, significant differences were noted in mean patronage of Specialist hospitals across settlements (F=9.226, p<0.05), with relatively higher patronage in informal settlements compared to slum and slum/informal areas.
However, the analysis indicates that patronage of dispensaries/clinics is higher in informal settlements, while primary healthcare facilities receive more patronage in slummy neighbourhoods and slum/informal neighborhoods. General hospitals show consistent patronage across all settlement types, whereas Tertiary and Specialist hospitals have higher patronage in informal settlements compared to slum and slum/informal areas.
Table 5. Patronage Pattern of Health Facilities across the Neighbourhood types.

Type of Health Facility

Type of Neighbourhood

Mean patronage

Std. Deviation

Std. Error

F

Sig

Tukey B Post-hoc comparison test

Sub-set 1

Sub -set 2

Dispensary

Slum settlement

2.6873

.98766

.03986

9.194

0.000**

2.6873

Slum/informal settlement

2.6378

1.04479

.04392

2.6378

Informal settlement

3.1520

1.07054

.09575

3.1520

Total

2.7156

1.02162

.02741

Primary Healthcare Centre

Slum settlement

3.3844

.84654

.03416

3.235

0.022**

3.3844

Slum/informal settlement

3.3799

.96609

.04061

3.3799

Informal settlement

3.1360

.96172

.08602

3.1360

Total

3.3657

.90715

.02434

General Hospital

Slum settlement

2.4837

.96203

.03882

.910

0.436

2.4837

Slum/informal settlement

2.4240

.88870

.03735

2.4240

Informal settlement

2.4480

1.02749

.09190

2.4480

Total

2.4622

.93108

.02498

Tertiary Hospital

Slum settlement

1.6401

.88069

.03554

3.994

0.008**

1.6401

Slum/informal settlement

1.6696

.96231

.04045

1.6696

Informal settlement

1.8880

.99366

.08888

1.8880

Total

1.6904

.94094

.02525

Specialist Hospital

Slum settlement

1.5554

.89189

.03599

9.226

0.000**

1.5554

Slum/informal settlement

1.6643

1.02207

.04296

1.6643

Informal settlement

2.0320

1.17731

.10530

2.0320

Total

1.6602

.99480

.02669

Source: Author’s Field Survey, 2022
4.6. Access to Healthcare Facilities Across Neighbourhood Types
The results in Table 6 shows that about 41.3% of respondents from the slummy neighbourhoods have access to dispensary, 37.0% from slums/informal settlements, 21.8% from informal settlements. For the PHC, 46.0% and 41.5% of respondents respectively from the slum/informal and slummy neighbourhoods agreed that they have access to it. Similarly, 57.4% and 31.9% from the slums and slums/informal settlements respectively agreed that they have access to general hospital. Results further reveal that majority of respondents that agreed that they have access to Tertiary hospital are residents of informal settlements. Lastly, about 55.4% of respondents living in the slums/informal neighbourhoods have access to specialist hospital. The chi-square statistics in Table 6 reveals that there is significant difference or variation in the level of access to the different healthcare facilities across the study area (X= 134.323a, df (12), p<0.05). One salient point from the findings is the fact that access to PHC and dispensary/clinic across two settlement types (slum and slum/informal) is high compared to others. PHCs are the closest form of health facility to the people in both the rural and urban centres. Due to their proximity, they serve as the first point of call for most residents living in these informal settlements or slums when they have health issues, before they are referred to higher level facilities (General and Tertiary), if the case is serious.
Table 6. Access to Healthcare Facilities across the Neighbourhoods Types.

Type of health facility

Neighbourhood

Chi-square (X)

Sig

Slum settlement

Slum/informal settlement

Informal settlement

Total

Dispensary/clinic

160

143

84

387

134.323a

.000

41.3%

37.0%

21.8%

100.0%

Primary health centre

308

342

93

743

41.5%

46.0%

12.5%

100.0%

General Hospital

81

45

15

141

57.4%

31.9%

10.6%

100.0%

Teaching Hospital

1

5

55

61

1.6%

8.2%

90.2%

100.0%

Specialist Hospital

9

31

16

56

16.1%

55.4%

28.6%

100.0%

Total

613

566

209

1388

44.2%

40.8%

15.1%

100.0%

Source: Author’s Field Survey, 2022
5. Conclusion and Recommendation
This paper examined patronage pattern and accessibility of healthcare facilities in urban slums and informal settlements in Ibadan metropolis, Nigeria. The study categorized neighborhoods into slums, informal settlement, slum/informal settlements and relatively orderly and planned settlements. The later analyzes were based on only three categories (slums, Informal settlements and Slums/informal neighbourhoods) which was the focus of this paper. It was observed that the slummy neighbourhoods and slum/informal settlements were rated to be poor in overall environmental conditions and have low monthly income which might reduce patronage of the available healthcare facilities and services in their neighourhoods.
On patronage and accessibility, the study discovered that that distance to health facility has an inverse relationship (p<0.05) with patronage in all the five (5) healthcare facilities and this suggests that a unit decrease in distance to healthcare facility would bring about an increase in patronage. It was also discovered that residents of slummy and slum/informal neighbourhoods have access and patronize PHC more than other healthcare facilities due to its closeness while patronage of dispensary/clinic was higher in informal settlements. This paper therefore concludes by recommending the following:
1) The relevant stakeholders including State Government and local government concerned should form synergy to implement a slum improvement program that will cut across the three affected neighbourhoods types in order to improve living conditions and healthcare infrastructure in slums and informal settlements.
2) Health sector investors and urban planners must collaborate to ensure that public healthcare facilities are equitably distributed throughout slummy neighborhoods and informal settlements, considering current locations of facilities and adhere to planning standards aimed at promoting fairness, thus enhancing accessibility for all residents.
3) Due to the low income of slum and slum/informal neighbourhoods dwellers, healthcare service delivery should be subsidized by the Oyo state Government and the affected local government to make it more accessible to them.
Author Contributions
Jacob Ayorinde Adejare: Data curation, Formal Analysis, Methodology, Writing – original draft
Musibau Omoakin Jelili: Conceptualization, Methodology, Project administration, Supervision, Validation, Writing – review & editing
Akeem Bamidele Muili: Supervision, Validation, Writing – review & editing
Conflicts of Interest
The authors declare no conflicts of interest.
References
[1] Adebayo AM, Asuzu MC. (2015). Utilisation of a community-based health facility in a low-income urban community in Ibadan, Nigeria. African Journal of Primary Health Care & Family Medicine. (1).
[2] Ajibade, F. O., & Ogunmola, J. O. (2020). Spatial analysis of healthcare facilities distribution and accessibility in Ibadan, Nigeria. International Journal of Health Geographics, 19(1), 1-16.
[3] Akintola, F. O. 1994. Flooding Phenomenon in Ibadan Region. In Ibadan Region, edited by M. O. Filani, 244–255. Ibadan: Rex Charles Publications & Connel Publications.
[4] Ayiti, O. M. (2024). Impacts of Decaying Infrastructure in Urban Areas of Ibadan, Oyo State, Nigeria. International Journal of Academic Research in Public Policy and Governace, 10(1), 1–10.
[5] Babalola, S., & Fakayode, O. (2019). Urban slums and informal settlements in Ibadan: Implications for sustainable development. Journal of Sustainable Development in Africa, 21(4), 62-80.
[6] Fayehun O., Ajisola M., Uthman O., Oyebode O., Oladejo A., Taiwo O., Odunbanjo, O., Harris B., Lilford R., Omigbodun. (2022). A contextual exploration of healthcare service use in urban slums in Nigeria.
[7] Gidado, S. O., & Ayanwale, A. B. (2022). Patronage patterns of healthcare facilities among urban slum residents in Ibadan Metropolis, Nigeria. Nigerian Journal of Health Sciences, 20(1), 45-57.
[8] Jazat Joseph P., Ogunbode Timothy O.,. Akande John A (2023). Assessment of sociological indices affecting environmental pollution in Iwo, Nigeria. Environmental Quality Management Volume 33, Issue 1 p. 157-164.
[9] Jelili M. O. (2006). Environmental and Socio-economic Dimension of Begging in Ogbomoso and Ilorin; Unpublished M. Tech Dissertation, Ladoke Akintola University of Technology (LAUTECH), Ogbomoso.
[10] Ogunmola, J. O., & Oladosu, Y. S. (2021). Accessibility to healthcare services and its implications for health outcomes in urban slums: A case study of Ibadan Metropolis, Nigeria. African Geographical Review, 40(2), 212-229.
[11] Olaniyan, O. S., & Omotosho, B. A. (2018). Healthcare-seeking behavior among residents of urban slums in Ibadan Metropolis, Nigeria. Journal of Public Health in Africa, 9(2), 785-797.
[12] Olugbamila, O. B. (2018). “Spatial Distribution and Accessibility to Healthcare Facilities in Akure South Local Government Area of Ondo State,”AnaleleUniversitatii din Oradea, Seria Geografie, Vol. 28, Issue. 1, pp. 7-18.
[13] Patel, S., Sandbrook, C., & Fisher, J. (2011). Addressing urban poverty in the global South: Experiences from the urban poor in the Eastern Cape, South Africa. Urban Forum, 22(3), 253-270.
Cite This Article
  • APA Style

    Adejare, J. A., Jelili, M. O., Muili, A. B. (2024). Patronage Pattern and Accessibility of Healthcare Facilities in Urban Slums and Informal Settlements in Ibadan Metropolis. Urban and Regional Planning, 9(3), 71-87. https://doi.org/10.11648/j.urp.20240903.12

    Copy | Download

    ACS Style

    Adejare, J. A.; Jelili, M. O.; Muili, A. B. Patronage Pattern and Accessibility of Healthcare Facilities in Urban Slums and Informal Settlements in Ibadan Metropolis. Urban Reg. Plan. 2024, 9(3), 71-87. doi: 10.11648/j.urp.20240903.12

    Copy | Download

    AMA Style

    Adejare JA, Jelili MO, Muili AB. Patronage Pattern and Accessibility of Healthcare Facilities in Urban Slums and Informal Settlements in Ibadan Metropolis. Urban Reg Plan. 2024;9(3):71-87. doi: 10.11648/j.urp.20240903.12

    Copy | Download

  • @article{10.11648/j.urp.20240903.12,
      author = {Jacob Ayorinde Adejare and Musibau Omoakin Jelili and Akeem Bamidele Muili},
      title = {Patronage Pattern and Accessibility of Healthcare Facilities in Urban Slums and Informal Settlements in Ibadan Metropolis
    },
      journal = {Urban and Regional Planning},
      volume = {9},
      number = {3},
      pages = {71-87},
      doi = {10.11648/j.urp.20240903.12},
      url = {https://doi.org/10.11648/j.urp.20240903.12},
      eprint = {https://article.sciencepublishinggroup.com/pdf/10.11648.j.urp.20240903.12},
      abstract = {Slums and informal settlements are residential areas physically and socially disintegrated. In spite of this, inadequate health-related data on slum areas and informal settlements has led to inappropriate and unrealistic allocation of healthcare resources by the public and private health providers. This study investigates the patronage pattern and accessibility of healthcare facilities to residents of urban slums and Informal settlements in Ibadan Metropolis, a rapidly growing urban area in Nigeria facing challenges related to urbanization and healthcare infrastructure. Data were collected from both primary and secondary sources. Structured questionnaire was administered on 1,389 residents of the slummy neighbourhoods and informal settlements in Ibadan metropolis, and obtained data were analyzed using descriptive and inferential statistics. Results revealed that out of 109 neighbourhoods, 42.1% were categorized as slummy neighbourhoods, 36.7% as slums/informal settlements, while 21.2% were informal settlement using slummy and informality conditions respectively. Results revealed that distance to health facility (β= -0.353, p<0.05), educational qualification (β=-0.063, p<0.05) and household size (β= -0.052, p<0.05) had an inverse relationship with patronage of health facilities, while age (β=0.086, p< 0.05) had a positive relationship. It was also revealed that access to PHC and dispensary/clinic in slummy neighbouhoods and slum/informal settlements is higher compared to informal settlements in the study area. The study therefore recommends implementation of slum improvement program for the slummy and slums/informal neighbourhoods, provision of additional healthcare facilities to be located especially in the slummy neighbourhoods and informal settlements to ensure equitable distribution.
    },
     year = {2024}
    }
    

    Copy | Download

  • TY  - JOUR
    T1  - Patronage Pattern and Accessibility of Healthcare Facilities in Urban Slums and Informal Settlements in Ibadan Metropolis
    
    AU  - Jacob Ayorinde Adejare
    AU  - Musibau Omoakin Jelili
    AU  - Akeem Bamidele Muili
    Y1  - 2024/07/29
    PY  - 2024
    N1  - https://doi.org/10.11648/j.urp.20240903.12
    DO  - 10.11648/j.urp.20240903.12
    T2  - Urban and Regional Planning
    JF  - Urban and Regional Planning
    JO  - Urban and Regional Planning
    SP  - 71
    EP  - 87
    PB  - Science Publishing Group
    SN  - 2575-1697
    UR  - https://doi.org/10.11648/j.urp.20240903.12
    AB  - Slums and informal settlements are residential areas physically and socially disintegrated. In spite of this, inadequate health-related data on slum areas and informal settlements has led to inappropriate and unrealistic allocation of healthcare resources by the public and private health providers. This study investigates the patronage pattern and accessibility of healthcare facilities to residents of urban slums and Informal settlements in Ibadan Metropolis, a rapidly growing urban area in Nigeria facing challenges related to urbanization and healthcare infrastructure. Data were collected from both primary and secondary sources. Structured questionnaire was administered on 1,389 residents of the slummy neighbourhoods and informal settlements in Ibadan metropolis, and obtained data were analyzed using descriptive and inferential statistics. Results revealed that out of 109 neighbourhoods, 42.1% were categorized as slummy neighbourhoods, 36.7% as slums/informal settlements, while 21.2% were informal settlement using slummy and informality conditions respectively. Results revealed that distance to health facility (β= -0.353, p<0.05), educational qualification (β=-0.063, p<0.05) and household size (β= -0.052, p<0.05) had an inverse relationship with patronage of health facilities, while age (β=0.086, p< 0.05) had a positive relationship. It was also revealed that access to PHC and dispensary/clinic in slummy neighbouhoods and slum/informal settlements is higher compared to informal settlements in the study area. The study therefore recommends implementation of slum improvement program for the slummy and slums/informal neighbourhoods, provision of additional healthcare facilities to be located especially in the slummy neighbourhoods and informal settlements to ensure equitable distribution.
    
    VL  - 9
    IS  - 3
    ER  - 

    Copy | Download

Author Information
  • Abstract
  • Keywords
  • Document Sections

    1. 1. Introduction
    2. 2. Review of Literature
    3. 3. Material and Methods
    4. 4. Results and Discussion
    5. 5. Conclusion and Recommendation
    Show Full Outline
  • Author Contributions
  • Conflicts of Interest
  • References
  • Cite This Article
  • Author Information