Research Article | | Peer-Reviewed

Effect of NPS and Urea Fertilizer Rates on Phenology, Growth and Yield Components of Bread Wheat (Triticum Aestivum L.) in West Guji Southern Oromia

Received: 27 July 2026     Accepted: 10 August 2026     Published: 8 September 2026
Views:       Downloads:
Abstract

Bread wheat (Triticum aestivum L.) is one of the major food crops cultivated in West Guji and plays a significant role in ensuring food security in Ethiopia. However, low soil fertility and inadequate fertilizer application are among the major constraints limiting wheat productivity in the study area. The study took place in the West Guji southern Oromia, during the main cropping season in 2023. The study was aimed to determine the combined application of NPS and urea (N) fertilizer rates for bread wheat (Triticum aestivum L.) production. The treatments were (0 NPS) negative control, 60 kg NPS, 120 kg NPS, and 180 kg NPS, and (0 N) negative control, 140 kg N, 280 kg N, and positive control (100/100 kg ha⁻1 NPS/N). The treatments were arranged in a randomized complete block design and replicated three times. The results of the analysis of variance for agronomic characters indicated that the effects of fertilizer application rates were significant for the date of 50% heading, the date of 90% physiological maturity, plant height, the number of total tillers per plant, spike length per plant, effective tiller per plant, spikelet per spike, the number of grains per spike, thousand seed weight, and harvest index. The maximum duration of 50% days to heading (83.67 days) and day to 90% physiological maturity (136 days) was obtained from unfertilized plants, whereas the minimum duration of 50% day to heading (70.33 days) and day to 90% physiological maturity (120 days) was obtained from 180 kg NPS ha⁻1 + 280 kg N ha⁻1 fertilizer rates, respectively. The maximum plant height (92.5 cm) was also recorded under the highest fertilizer treatment, indicating a strong correlation between nutrient application and plant growth. These findings suggest that balanced fertilizer rates can significantly enhance both yield components and overall plant development. 21 cm), effective tiller per plant (5.21), number of total tillers per plant (5.25), spike length (9.21 cm), and 180 kg NPS ha⁻1 + 280 kg N ha⁻1 fertilizer rates, respectively. The maximum spikelet per spike (19) and number of grains per spike (74.67) were obtained from 120 kg NPS ha⁻1 + 140 kg N ha⁻1 fertilizer rates, respectively. The maximum thousand grains weight (38.00 gm) and harvest index (44.33%) were obtained from 180 kg NPS ha⁻1 + 140 kg N ha⁻1 fertilizer rates, respectively. Therefore, 180 kg/280 kg and 180 kg/140 kg ha⁻1 NPS/urea (N) are better, but 120/140 kg is best for gain yield, and the farming community can be used in the study area. This suggests that optimizing fertilizer application can significantly enhance bread wheat yield and yield components. Future research should focus on refining these rates further to maximize efficiency and sustainability in agricultural practices.

Published in Science Journal of Chemistry (Volume 14, Issue 4)
DOI 10.11648/j.sjc.20261404.12
Page(s) 130-141
Creative Commons

This is an Open Access article, distributed under the terms of the Creative Commons Attribution 4.0 International License (http://creativecommons.org/licenses/by/4.0/), which permits unrestricted use, distribution and reproduction in any medium or format, provided the original work is properly cited.

Copyright

Copyright © The Author(s), 2026. Published by Science Publishing Group

Keywords

Bread Wheat, West Guji, Fertilizer Rate, Ethiopia

1. Introduction
Wheat is a major global cereal crop that feeds more than one-third of the world’s population and reached about 761 million tons of production in 2020 . It is an important staple food and protein source, especially in developing and low-rainfall regions . Eastern African highlands, particularly Ethiopia and Kenya, are key wheat-producing areas . However, wheat productivity differs among countries, with Egypt producing around 67 quintals per hectare and Ethiopia about 28 quintals per hectare in 2020. Wheat also contributes about 19% of global calorie intake and is widely used for human food and animal feed. In Ethiopia, wheat is commonly processed into foods such as injeraEthiopia is the second-largest wheat producer in Africa, producing about 5.5 million tons annually and contributing around 21.7% of the continent’s total wheat production . Wheat is mainly grown in the highland areas and plays a vital role in food security and household income generation. Both durum and bread wheat are cultivated, with bread wheat accounting for over 80% of the production area. The crop also provides more than 15% of the caloric intake for nearly 90 million Ethiopians . However, wheat productivity in the West Guji region remains low, averaging about 32.23 quintals per hectare, which is below national and global standards. Besides grain production, wheat straw is commonly used for livestock feed and compost. Wheat production in the area is constrained by several challenges, including poor agronomic practices, inadequate fertilizer use, poor crop management, diseases, lack of improved and disease-resistant varieties, low soil fertility, limited application of organic manure, and improper plant population density.
Soil fertility is one of the major constraints affecting agricultural productivity, as it determines the soil’s ability to provide essential nutrients for plant growth and crop development. Properly managed soil fertility improves plant health, growth, and yields both organic and inorganic fertilizers are important for enhancing wheat production and maintaining soil fertility . However, intensive farming practices without considering local soil and climatic conditions have led to serious soil degradation and nutrient depletion.
In Ethiopia, declining soil fertility is a major challenge to sustainable agriculture. Factors such as soil erosion, deforestation, continuous cultivation, inadequate fertilizer use, and the decline of traditional soil restoration practices have reduced soil productivity, particularly in the highlands . Additional problems, including limited knowledge of proper fertilizer application, poor crop management, and lack of improved crop varieties, have further lowered wheat productivity. As a result, poor soil fertility and the absence of site-specific fertilizer recommendations contribute significantly to low grain yield, poor grain quality, and food insecurity in the country .
Fertilization is a key agronomic practice that improves soil fertility and increases crop productivity, with the ability to raise yields by 30-50% . Together with improved seed varieties and sufficient water supply, balanced fertilizer application plays a major role in enhancing agricultural production. Fertilizers support crop growth, increase productivity, and contribute to agricultural development However; continuous agricultural intensification without proper nutrient management has accelerated soil fertility depletion. Despite this challenge, inorganic fertilizers remain essential for improving soil fertility and boosting food production in Ethiopia . Nitrogen (N) and phosphorus (P) are key nutrients required for plant growth, but many tropical soils, including those in Ethiopia, are deficient in these nutrients, leading to low crop productivity. Excessive nitrogen application, however, can reduce nitrogen use efficiency and contribute to environmental pollution. Sulfur (S) is also an essential nutrient that supports protein synthesis, chlorophyll formation, optimum crop yield, and grain quality. Continuous cultivation and imbalanced fertilizer use have negatively affected soil fertility and crop performance, while sulfur deficiency has recently become a major constraint in Ethiopian agriculture.
In the West Guji Zone, particularly in Bule Hora District, the use of balanced fertilizers is inadequate, limiting bread wheat productivity. In addition, there is limited information on bread wheat production and site-specific fertilizer recommendations in the area. Therefore, identifying appropriate combined application rates of NPS and urea fertilizers is necessary to improve bread wheat yield and agricultural productivity in the study area.
2. Materials and Methods
2.1. Description of Study Area
The experiment was conducted during the 2023 cropping season in West Guji, Bule Hora District, located in the West Guji Zone of southern Ethiopia. The study area lies at 5°35′ N latitude and 38°15′ E longitude, at an altitude of about 2000 meters above sea level. The area experiences a bimodal rainfall pattern, with an average annual rainfall of 586.84 mm, maximum temperature of 28.08°C, and minimum temperature of 8.22°C. The dominant soils are silty and sandy loam with a soil pH of 5.8.
2.2. Experimental Materials
The experiment used the bread wheat variety “Sanate,” released by the Sinana Agricultural Research Center in 2012. The variety was selected because of its high yield potential, disease resistance, farmer preference, and adaptability to the local agroecology. Fertilizer materials included blended NPS fertilizer (18% N, 38% P2O5, and 7% S) and urea as a nitrogen source.
2.3. Experimental Design and Treatments
The study consisted of thirteen fertilizer treatments involving different combinations and rates of NPS and urea fertilizers, including the farmers’ conventional fertilizer practice as a control. The experiment was arranged in a Randomized Complete Block Design (RCBD) with three replications. Each plot measured 3 m × 1.2 m (3.6 m2), with spacing of 0.20 m between rows, 0.5 m between plots, and 0.75 m between blocks.
Table 1. Treatments used for the experiment.

No Trt

Fertiliozer treatements

Nutrient contents

N

P2O5

S

1

Control (negative)

0

0

0

2

140kg (N)

64.4

0

0

3

280kg (N)

128.8

0

0

4

60 kgNPS

10.8

22.8

4.2

5

60 kgNPS + 140kg (N)

75.2

22.8

4.2

6

60 kgNPS + 280kg (N)

139.6

22.8

4.2

7

120kg NPS

21.6

45.6

8.4

8

120kg NPS + 140kg (N)

86

45.6

8.4

9

120kg NPS + 280kg (N)

150.4

45.6

8.4

10

180kg NPS

32.4

68.4

12.6

11

180kg NPS + 140kg (N)

96.8

68.4

12.6

12

180kg NPS + 280kg (N)

161.2

68.4

12.6

13

100kgNPS+100kg (N) control (positive)

64

38

7

2.4. Experimental Procedure
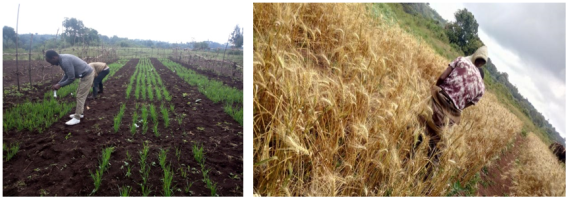
Before planting, the experimental field was prepared through three plowings using oxen, after which the field layout was arranged and treatments were randomly assigned to plots within each block. The improved bread wheat variety was planted manually in rows during the 31 March 2023 cropping season, using a spacing of 20 cm between rows and a seed rate of 125 kg ha⁻1. Nitrogen, phosphorus, and sulfur fertilizers were applied in the form of Urea and NPS fertilizer according to the treatment arrangements. The full dose of NPS fertilizer was applied at planting time, while nitrogen fertilizer from urea was applied in split applications. Half of the nitrogen was applied at sowing, and the remaining half was top-dressed at the tillering stage to improve nitrogen use efficiency and reduce nutrient loss. Fertilizers were applied uniformly to each plot based on the recommended treatment rates and incorporated into the soil during planting.
Figure 1. Fertilizer application and measure of yield parameters.
Soil Sampling and Analysis
Before sowing, representative composite soil samples were collected from a depth of 0-30 cm using a zigzag sampling method across the experimental field. Six soil samples were taken with an auger and combined into a 1 kg composite sample. The samples were air-dried, ground, and sieved to 2 mm for general analysis, while finer sieving (0.025 mm) was used for organic carbon and available nitrogen analysis to improve surface area and solubility. The pre-sowing soil samples were analyzed for important physicochemical properties, including soil texture, pH, total nitrogen, organic carbon, organic matter, available phosphorus, and cation exchange capacity (CEC).
After harvest, soil samples were again collected from each treatment plot at a depth of 0-30 cm using the zigzag method. Three samples (0.5 kg each) were taken from every experimental unit, giving a total of 39 post-harvest soil samples. Laboratory analyses were conducted at the Yabello Pastoral and Dryland Agriculture Research Center and the Jimma Agricultural Research Center for sulfur analysis and other soil property evaluations.
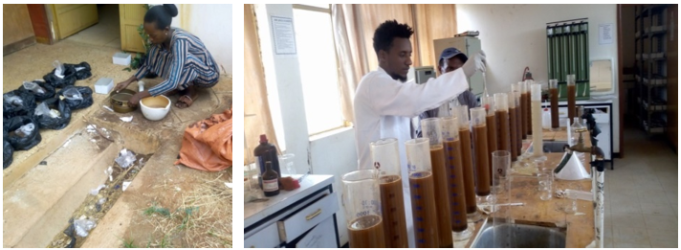
After harvest, soil samples were analyzed for soil pH, total nitrogen (N), available phosphorus (P), available sulfur (S), organic carbon (OC), organic matter (OM), and cation exchange capacity (CEC). Soil texture and particle size distribution were determined using the hydrometer method. Organic carbon was analyzed using the Walkley and Black oxidation method while total nitrogen was measured using the Kjeldahl method . Soil pH was determined in a 1:2.5 soil-to-water suspension using a pH meter. Cation exchange capacity was measured by saturating the soil with 1N ammonium acetate and displacing it with 1N sodium acetate. Available phosphorus was analyzed using the Olsen method , and available sulfur was determined using the turbid metric method.
The analyzed soil parameters were interpreted based on standard soil fertility rating classifications to evaluate the fertility status of the experimental site before planting and after harvesting.
Figure 2. Soil analysis.
2.5. Data Collection
All phenological, growth, yield, and yield component data were collected following standard agronomic procedures. Data were recorded from the four central rows of each net plot area, while observations on individual plant characteristics were taken from eight randomly selected plants from each experimental unit. The collected data were subjected to statistical analysis.
Days to 50% heading: Days to 50% heading were recorded as the number of days from sowing until 50% of the plants in each plot had emerged spikes from the flag leaf sheath. Days to 90% Physiological Maturity: Days to physiological maturity were recorded as the number of days from sowing to the stage when 90% of the plants in each plot changed from green to yellow color. Plant Height: Plant height was measured at physiological maturity from the ground surface to the tip of the spike, excluding awns, using randomly selected plants from the net plot area. The average height was expressed in centimeters (cm). Spike Length: Spike length was measured from the base of the spike to the tip of the spike, excluding awns, using randomly selected spikes from each plot, and the average value was recorded in centimeters. Number of total tillers per plant: The number of total tillers per plant was determined by counting all tillers from eight randomly selected plants at the full tillering stage, and the mean value was calculated for each plot. Effective Tillers per Plant: The number of effective tillers per plant was determined by counting productive tillers from randomly selected plants in each plot at maturity, and the average value was recorded. Spikelets per Spike: The number of spikelets per spike was counted from randomly selected spikes taken from the net plot area, and the average was computed. Number of Grains per Spike: The number of grains per spike was determined by counting grains from sampled spikes collected randomly from each plot, and the mean value was recorded. Thousand Seed Weight: Thousand seed weight was measured by counting 1000 grains from the harvested seed of each plot and weighing them using a sensitive balance after adjusting the seed moisture content to a standard level. The result was expressed in grams. Harvest Index: Harvest index was calculated as the ratio of grain yield to total aboveground biomass yield and expressed as a percentage using the following formula:
HI(%)=(GrainYield/AbovegroundBiomassYield)×100
2.6. Data Analysis
All recorded data were subjected to analysis of variance (ANOVA) using SAS statistical software following the General Linear Model (GLM) procedure. The analysis was carried out in accordance with the procedures described by Gomez and Gomez (1984). Treatment means were compared using the Least Significant Difference (LSD) test at the 5% probability level whenever the analysis of variance indicated significant differences among treatments.
3. Results and Discussion
Table 1. Soil physicochemical properties of the experimental site before sowing and after harvest.

Properties

Values

Ratings

Before

After

Before

After

Clay (%)

14.6

Silt (%)

12.7

Sand (%)

72.7

Textural class

Sandy loam

pH: (H2O) 1:2:5

5.8

6.16

Moderately acid

Slightly acid

Organic Carbon (%)

1.91

1.73

low

low

Total nitrogen (%)

0.16

0.17

medium

medium

Available phosphorus (mg/kg soil)

7.8

45.63

low

Very high

Available Sulfar (mg/kg soil)

0.036

0.042

Very low

Very low

Cathane Exchange Capacity (CEC meq/100g)

5.6

23.52

Very low

medium

Source:.
3.1. Soil Physicochemical Properties Before Planting and After Harvest
The analysis of soil physicochemical properties conducted before planting and after harvest showed noticeable changes in soil fertility status due to crop cultivation and fertilizer application (Table 2). The results indicated variations in soil reaction, organic matter content, nutrient availability, and cation exchange capacity.
The soil of the experimental site contained 72.7% sand, 14.6% clay, and 12.7% silt, which was classified as sandy loam textural class. Sandy loam soils are generally characterized by good drainage, high aeration, and relatively low nutrient-holding capacity. The dominance of sand particles in the experimental field suggests a greater possibility of nutrient leaching, particularly nitrogen and sulfur. This finding agrees with the reports of who stated that sandy loam soils usually possess low water and nutrient retention capacities compared with clay soils. Similarly reported that sandy loam soils are common in several wheat-growing areas of Ethiopia and often require integrated nutrient management practices to maintain soil fertility.
The soil pH increased from 5.80 before planting to 6.16 after harvest (Table 2). According to soil rating standards, the soil reaction changed from moderately acidic to slightly acidic. The increase in soil pH may be attributed to the application of fertilizers containing basic cations and decomposition of crop residues during the growing period. The observed soil pH range is considered favorable for wheat production because most essential nutrients become adequately available between pH 6.0 and 7.0. The result is consistent with the findings of who reported that slight increases in soil pH may occur following fertilizer application and crop residue mineralization.
Organic carbon content decreased from 1.91% before planting to 1.73% after harvest, and both values were rated as low (Table 2). The reduction in organic carbon might be due to rapid decomposition of organic matter, continuous cultivation, and removal of crop biomass from the field. Low organic carbon content indicates poor organic matter status and limited soil structural stability. This finding is in agreement with the reports of who stated that cultivated tropical soils commonly exhibit declining organic carbon levels due to intensive farming practices. Similarly, explained that continuous cropping without adequate organic amendments contributes to depletion of soil organic matter.
Total nitrogen slightly increased from 0.16% before planting to 0.17% after harvest, though both values remained within the medium rating category (Table 2). The slight increase may be associated with the residual effects of nitrogen-containing fertilizers and mineralization of organic materials during crop growth. The result agrees with the findings of who reported that application of nitrogen fertilizers can improve total soil nitrogen content after harvest. Likewise, observed moderate total nitrogen levels in cultivated Ethiopian soils receiving inorganic fertilizers.
Available phosphorus showed a substantial increase from 7.80 mg kg⁻1 before planting to 45.63 mg kg⁻1 after harvest. The rating changed from low to very high (Table 2). The dramatic increase in available phosphorus could be attributed to the application of phosphorus-containing fertilizers such as NPS fertilizer and improved phosphorus availability under the slightly acidic soil condition. The increase indicates that fertilizer application significantly improved phosphorus availability in the soil. This finding is consistent with the reports of who stated that phosphorus fertilizer application markedly enhances available phosphorus levels in cultivated soils. Similarly, reported that Ethiopian soils deficient in phosphorus respond positively to phosphorus fertilization.
Available sulfur increased slightly from 0.036 to 0.042 mg kg⁻1 soil; however, the soil remained under the very low category after harvest (Table 2). The slight improvement may be due to sulfur supplied from NPS fertilizer application. Nevertheless, the sulfur level was still insufficient for optimum crop production. The result is in agreement with the findings of. Likewise, confirmed that sulfur deficiency is becoming one of the major nutrient limitations in Ethiopian farmlands due to continuous cropping and limited sulfur replenishment.
The cation exchange capacity increased considerably from 5.60 cmol (+) kg⁻1 before planting to 23.52 cmol (+) kg⁻1 after harvest, improving from very low to medium rating status (Table 2). The increase in CEC may be associated with improved soil fertility conditions, fertilizer application, and accumulation of exchangeable basic cations in the soil. Higher CEC values indicate better nutrient retention and improved soil fertility status. This finding agrees with the report of who explained that soil amendments and improved nutrient management can enhance CEC values. Similarly, Brady and Weil stated that increases in organic matter and soil nutrient status contribute to improved cation exchange capacity.
Generally, the experimental soil was sandy loam with moderately acidic reaction before planting. After harvest, improvements were observed in soil pH, available phosphorus, sulfur content and cation exchange capacity, while organic carbon slightly declined. The findings suggest that fertilizer application positively influenced soil fertility parameters, particularly phosphorus availability and nutrient-holding capacity. However, the low organic carbon and very low sulfur status indicate the need for integrated soil fertility management practices, including the use of organic amendments and sulfur-containing fertilizers for sustainable crop production.
3.2. Phenology
3.2.1. Days to 50% Heading (DH)
The effects of fertilizer rates was significant (P<0.05) on days of 50% heading of bread wheat. The longest days to 50% heading (83.67days) was recorded from the unfertilized plot whereas the shortest days of 50% heading (70.33days) was recorded from 180 kg NPS +280 kg urea (N) ha-1 (Table 3). This might be due to the Nitrogen feed as NPS fertilizer enhance the vegetative development as well as stimulate shoot growth and due minimum duration of heading days. The result in line with the finding of reported that sufficient nitrogen at right time results in rapid growth and heading and short duration time. The result was in agreement with many authors reported that an increase in the level of NPS fertilizer application significantly hastened the days to 50% heading of the wheat plants across NPS fertilizer treatments.
3.2.2. Days to 90% Physiological Maturity (DPM)
The effects of fertilizer rate was highly significant (P < 0.0001) on days of 90% physiological maturity of bread wheat. The longest days to physiological maturity (136days) was recorded with the control plot whereas the early maturing (120days) was recorded from 180 kg NPS +280 kg urea ha-1. Increasing of NPS and Urea level enhanced the earlier anthesis and early maturity of crop over the unfertilized (Table 3). A adequate supply of phosphorus improves numerous aspects of plant physiology, including photosynthesis, blooming, seed maturity, and seed development and promotes root development and photosynthesis. Similar results with reported of reported that increasing rate of phosphorus enhance earlier production in wheat and ultimately early maturity of crop and also parallel with the results of other authors informed that earlier days to 90% physiological maturity (119 days) were recorded from plots treated with high NPS fertilizer level (250 kg ha-1), while delayed maturity (128 days) was recorded on control treatment.
Table 3. The effects of NPS and Urea fertilizer rate on days to 50% heading and days to 90% physiological maturity of bread wheat.

No trt.

Fertilizer treatments

DH 50%

DPM 90%

1

Control (negative)

83.67a

136.0a

2

140kg UREA (N)

79.33ab

128.0bc

3

280kg UREA (N)

73.67cde

121.67de

4

60 kgNPS

76.00bcd

128.67b

5

60 kgNPS + 140kg UREA (N)

75.667bcd

124.33cd

6

60 kgNPS + 280kg UREA (N)

76.67bcd

122.67de

7

120kg NPS

78.0bc

127.67bc

8

120kg NPS + 140kg UREA (N)

75.33bcd

121.00de

9

120kg NPS + 280kg UREA (N)

73.67cde

120.00e

10

180kg NPS

70.333e

123.33de

11

180kg NPS + 140kg UREA (N)

73.00de

121.33de

12

180kg NPS + 280kg UREA (N)

70.33e

120.00e

13

100kgNPS+100kgUREA (N) control (positive)

75.67bcd

125.00bcd

Means

75.49

124.58

CV%

3.47

2.03

LSD (0.05)

4.45

4.26

Means within a column followed by the same letter are not significantly different at 5% level of significance LSD (0.05) = least significant differenced; CV = Coefficient of Variation.
3.3. Growth Parameters
3.3.1. Plant Height
The effect of fertilizer rate was highly significantly different at the probability level of (P < 0.0001) on plant height of bread wheat.). The maximum plant height (92.21cm, 90.75cm and 89.38cm) were obtained from the application of 180kg NPS+ 280kg, 60 kgNPS + 280kg UREA (N), 120kg NPS + 140kg UREA (N) Urea fertilizer rates ha-1. Whereas the minimum value (76.46cm) was obtained from unfertilized plot (Table 4). Increasing the rate of NPS + N fertilizer rates with increased plant height of bread wheat. The beneficial role of N and P in cell division and elongation as well as the root growth and dry matter content of plants. The result was parallel with the report that increasing the rate of phosphorous fertilizer was significantly increase the plant height of bread wheat, this might be due to better development of root system and nutrient absorption. The plant height increased from 70.2 cm to 87.2 cm and as the P rate increased from 0 to 100 kg/ ha the plant height increased from 70.2 cm to 87.2 cm. Similarly, reported that as the nitrogen fertilizer rate increased from 0 to 69 kg/ha, the plant height increased from 82.63 cm to 94.18 cm and as the P rate increased from 0 to 30 kg/ha the plant height increased from 86.41 to 90.56 cm. Other authors Bereket reported that plant height and head length of wheat increased with N application rate. who repport that application of maximum N and application of N and P fertilizer rates increased plant height of bread wheat and also the highest height of durum wheat at applications of N and P affected the mean plant height of bread wheat. Many authors reports that the mean plant height bread wheat was significantly affected by the application of blended NPS and nitrogen fertilizer rates. Informed that increasing the increased the mean level of nitrogen from 0 to 60 kg ha-1 plant height of bread wheat reported that plant height increased with an increase of NPS fertilizer rate supplemented by Urea. This result is reliable with the results of who found that increasing nitrogen rates increased wheat plant height.
3.3.2. Total Number of Tillers Per Plant
Number of total tiller per plant was highly significant (P < 0.0001) affected by the fertilizer rates. The maximum number of total tiller per (5.25) was produced under application of the NPS rates of 180kg + 280kg ha-1 respectively (Table 4) whereas, the minimum numbers of total tiller per plant (1.83) recorded from unfertilized. Maximum number of total tiller per plant recorded at highest fertilizer application rate as compare to recommended and control. According to informed phosphorus fertilization impact on wheat yield and its shortage has been reported as one of the main reasons for reduced number of tillers. According to who reported that “the highest number of tillers per plant of bread wheat due to the combined application of 200/200 kg NPS/N ha-1 indicating the positive role of Nitrogen for tillering.
3.3.3. Spike Length
The effect of fertilizer rate was highly significant (P < 0.0001) effect on the spike length of bread wheat. The longest spike (9.2cm) was recorded at the application of 180kg NPS and Urea 280kg fertilizer rates ha-1 whereas the shortest spike length (5.58cm) was recorded under application unfertilized (Table 4). The result showed that increasing the rate of NPS at higher levels increased spike length might be due to adequate NPS fertilizer applications which resulted in better length of the spike. informed that the spike length was consistently increased with increasing N rates. reported that head length of wheat increased with N application rate.
Table 4. The effects of NPS and Urea (N) fertilizer rate on plant height, total tiller per plant and spike length per plant of bread wheat.

No. trt.

Fertilizer treatments

PH (cm)

NTP (no)

SLP (cm)

1

Control (negative)

76.46g

1.83k

5.58i

2

140kg UREA (N)

83.88f

3.21j

7.13g

3

280kg UREA (N)

86.50cdef

3.75g

7.50f

4

60 kgNPS

84.08ef

3.13j

6.58h

5

60 kgNPS + 140kg UREA (N)

87.63cd

4.0f

7.71e

6

60 kgNPS + 280kg UREA (N)

90.75ab

4.25e

8.13d

7

120kg NPS

86.88cde

3.38i

7.88 e

8

120kg NPS + 140kg UREA (N)

89.38abc

5.0b

8.50c

9

120kg NPS + 280kg UREA (N)

88.58bcd

4.71c

8.88b

10

180kg NPS

86.04def

3.63h

8.08d

11

180kg NPS + 140kg UREA (N)

88.71bcd

5.08b

9.08a

12

180kg NPS + 280kg UREA (N)

92.21a

5.25a

9.21a

13

100kgNPS+100kgUREA (N) control (positive)

88.21bcd

4.38d

8.38 c

Means

86.87

3.96

7.89

Cv%

2.03

2.12

1.6

LSD (0.05)

2.97

0.14

0.21

Means within a column followed by the different letter are significantly different at 5% level of significance. LSD (0.05) = least significant differenced; CV= Coefficient of Variation.
3.4. Yield Components
3.4.1. Effective Tiller Per Plant (Etp)
Number of effective tiller was highly significantly (P < 0.0001) affected by the effect of fertilizer rates. The maximum number of effective tillers (5.21) was recorded at NPS 180kg with urea (N) 280kg fertilizer rate ha-1 and the statistically less (1.63) was recorded from unfertilized (Table 5). Effective tillers are the most important because of the influence in final yield. The NPS and urea (N) fertilizer rate application increasing from zero to 180/280kg ha-1 with increased effective tiller per plant from 1.63 to 5.21. This might be due to applied top-dressing of urea fertilizer at time of tillering initiations. informed that nitrogen fertilization contributed in increasing tiller production up to an optimal level.
3.4.2. Spikelet Per Spike
The effect of fertilizer rate was highly significant (P < 0.0001) effect on number of spikelet per spike of bread wheat. The maximum number of spikelet per spike (19.0) were recorded from both 120kg NPS + 140kg urea (N) fertilizer level ha-1 and followed by (18.96) obtained from 180kg NPS + 280kg urea (N) fertilizer levels while the minimum number of spikelet per spike (14.04) were recorded from unfertilized (Table 5). The increased of NPS and Urea (N) fertilizer rates as increase spikelet per spike. The number of spikelet, fertile floret, and grains would allow the control of the spikelet fertility, fertile florets proportion, and grain/fertile florets to more measure .
3.4.3. Number of Grains Per Spike
The effect of fertilizer rate was highly significant (P < 0.0001) effect on number of grain per spike. The maximum number of grains per spike (74.67) were recorded from both 120kg NPS +140 kg urea (N) fertilizer rates ha-1 and followed by (74.46) recorded from 180kg NPS + 280kg urea (N) fertilizer rates whereas the minimum number of grains per spike (49.58) was recorded from unfertilized (Table 5). This might be due to spike length and spikelet count are crucial factors in determining the number of kernels each spike and increased number of grains per spike could be because optimum crop stand with better nutrition of NPS fertilizer. Better nutrition enhanced the source capacity to better fill of the sink. Nitrogen is the most important nutrient which affects the assimilate production and distribution and also affecting directly and indirectly the source-sink relation. According to informed that the application of 150 kg NPSB fertilizer rate ha-1 gave the highest number of grains per spike and also other authors informed that application of 150 kg N ha-1 gave the maximum number of grains per spike. According to informed that nitrogen level of 125 kg ha-1 resulted in highest number of spikes m-2 (368) and less number of spikes m-2(261) was testified in control plots. Also reported phosphorus application maximum spikes m-2 (364) were produced by 90 kg P ha-1 while minimum spikes m-2 (261) were counted in control plots.
3.4.4. Thousand Grains Weight
The effect of fertilizer rate was significant ((P < 0.05) effect on thousand grains weight of bread wheat. The maximum number of thousand grains weight (38gm) was obtained from 180kg NPS + 140kg urea (N) fertilizer rate (Table 5) while the minimum thousand grains weight (29gm) was obtained from unfertilized. This result comparable with who reported that increased NPS fertilizer rate it increased Thousand grains weight and confirm with who reported that the thousand kernels weight was increased with increase in phosphorus level. reported that delayed sowing shortens the duration of each development phase, which ultimately reduces grain filling period and lowers the grain weight.
3.4.5. Harvest Index
The effect of fertilizer rate was highly significant (P<0.0001) effect on harvest index of bread wheat. The maximum harvest index value (44.36) was obtained from180kgNPS and 140kg urea fertilizer rate followed by (39.7) was obtained from application of 180kgNPS and 280kg urea fertilizer rate ha-1, respectively whereas minimum harvest index (25.07) was obtained from 60/140(Table 5). Harvest index is an ability of a cultivar to convert the dry matter into economic yield. The higher the harvest index value, the greater the physiological potential of the crop for the converting dry matter to grain yield. This result confirm with report of who informed that N application increased as increased harvested index of winter wheat. Contrasting of this result who repport that Phosphorus fertilizer rates influenced yield and yield components of bread wheat, as well as all other agronomic parameters except the harvesting index. In contrasting reported that increased in harvest index of bread wheat was obtained with (38%) whereas application of higher 150 and 125 kg N ha-1 the lowest harvest index (34%) was recorded from control. According to informed that harvest index of bread wheat was different from farm to farm and with application of urea and blended NPSB fertilizer rates.
Table 5. The effects of NPS and Urea (N) fertilizer rate on effective tiller per plant, spikelet per spike, number of grain per spike, thousands seed weight and hevest index of bread wheat.

No trt.

Fertilizer treatments

ETP

SPS

NGP

TSW

HI (%)

1

Control (negative)

1.63i

14.04f

49.58g

29.0f

25.42e

2

140kg UREA (N)

3.04h

15.75e

60.54f

34.0abcde

25.27e

3

280kg UREA (N)

3.63f

16.92cd

64.83e

31.0def

28.15cde

4

60 kgNPS

3.0h

16.04e

66.42de

30.8ef

29.07cde

5

60 kgNPS + 140kg UREA (N)

3.88e

16.79d

69.46c

32.5bcdef

25.07e

6

60 kgNPS + 280kg UREA (N)

4.13d

17.58bc

69.3c

31.0def

26.05de

7

120kg NPS

3.25g

17.29bcd

66.0de

35.92ab

28.43cde

8

120kg NPS + 140kg UREA (N)

4.88b

19.000

74.67a

33.67bcde

38.18b

9

120kg NPS + 280kg UREA (N)

4.63c

18.46a

71.38b

35.0abcd

38.62ab

10

180kg NPS

3.50f

17.38bcd

67.0d

31.75cdef

32.08c

11

180kg NPS + 140kg UREA (N)

5.0b

18.92a

74.08a

38.0a

44.36a

12

180kg NPS + 280kg UREA (N)

5.21a

18.96a

74.46a

35.2abc

39.75ab

13

100kgNPS+100kgUREA (N) control (positive)

4.25d

17.71b

69.71bc

32.0bcdef

31.68cd

Means

3.84

17.26

67.49

33.0

31.7

CV%

2.64

2.29

1.62

7.14

11.45

LSD (0.05)

0.17

0.72

1.84

5.81

6.12

Means within a column followed by the different letter are significantly different at 5% level of significance. LSD (0.05) = least significant differenced; CV= Coefficient of Variation.
4. Conclusion and Recommendations
The study was conducted to evaluate the effects of different rates and combinations of NPS and urea fertilizers on soil properties, growth, phenology, yield components, and yield performance of bread wheat under the agro ecological conditions of the study area. The results of the experiment clearly demonstrated that fertilizer application significantly influenced soil fertility status and agronomic performance of bread wheat compared with the unfertilized control treatment. Overall, the study revealed that balanced application of NPS and urea fertilizers enhances soil fertility, improves crop growth and development, and increases yield components of bread wheat. Among the tested treatments, the combined application of 180 kg NPS with 140 kg or 280 kg urea was found to be the most effective for improving wheat performance under the conditions of the study area. Based on the findings of the study, the following recommendations are forwarded.
The combined application of NPS and urea fertilizers should be encouraged for bread wheat production because balanced nutrient management significantly improved crop growth, yield components, and soil fertility status. The application of 180 kg NPS combined with 140 kg urea is recommended for bread wheat production under the study area conditions because it provided high performance for most agronomic and yield parameters while likely being more economical than excessive nitrogen application. Farmers in the study area should avoid continuous cultivation without proper nutrient replenishment, since the soil was found to have low organic carbon and very low sulfur content. Integrated soil fertility management practices, including the use of organic fertilizers, compost, crop residue incorporation, and sulfur-containing fertilizers, should be promoted to improve soil organic matter and sustain long-term soil productivity. Further studies should be conducted across different locations, seasons, and wheat varieties to verify the consistency of the findings and determine the economically optimum fertilizer rates for broader recommendation. Future research should also include detailed economic analysis and soil nutrient balance assessment to identify fertilizer treatments that provide maximum profitability and sustainable soil fertility management.
Abbreviations

AGB

Above-Ground Biomass

CEC

Cathane Exchange Capacity

CV

Coefficient of Variation

GLM

Generalized Linear Model

JARC

Jimma Agricultural Research Center

LSD

Level of Significance

NB

Net Benefit

NPS

Nitrogen Phosphorus Sulfar

OC

Organic Carbon

OM

Organic Matter

YPDARC

Yabello Pastoral and Dry Land Agriculture Research Center

Author Contributions
Deme Megersa Jida: Conceptualization, Data curation, Formal Analysis, Funding acquisition, Investigation, Methodology, Resources, Software, Writing – original draft, Writing – review & editing
Conflicts of Interest
The author declares no conflicts of interest.
References
[1] Abera, D., Tana, T., & Dessalegn, T. (2020). Effects of blended NPSB fertilizer rates on yield and grain quality of durum wheat (Triticum turgidum L.) varieties in Minijar Shenkora District, Central Ethiopia. Ethiopian Journal of Agricultural Sciences, 30(3), 57-76.
[2] Abera, T., & Adinew, A. (2020). Effect of blended NPS fertilizer supplemented with nitrogen on yield components and yield of maize (Zea mays L.) in Kachabirra district, Kembata Tambaro zone, southern Ethiopia. International Journal of Research in Agricultural Sciences, 7(3), 2348-3997.
[3] Abera, T., Lemma, A., Hundesa, C., Husen, A., & Firomsa, T. (2021). Response of yield components and yield of bread wheat (Triticum aestivum L.) to blended NPS and N fertilizers levels at Liban Chukala District, East Shewa Zone, Oromia, Ethiopia. International journal of research and innovation in earth science, 8(1), 2394-1375.
[4] Abera, T., Tola, B., Tufa, T., Adugna, A., & Midega, T. (2021). Effects of belended (NPSB) and urea fertilizer rate on yield and yield components of wheat in ultisols of liban jawi district, Oromia, Ethiopia. American-Eurasian Journal of Agricultural and Environmental Sciences, 21(2), 87-97.
[5] Abera, Y., & Kassa, S. (2017). Status of soil micronutrients in Ethiopian soils: a review. Journal of environment and earth science, 7(4), 85-90.
[6] Aboye, A. D., & Teto, A. M. (2022). Pilot Review Study on Current Research Status and Economic Value Limitations of Bread Wheat (Triticum aestivum L.) Production in Ethiopia. Economics, 11(4), 137-166.
[7] Alamzeb, M., Anwar, S., Iqbal, A., Parmar, B., & Iqbal, M. (2017). Organic sources, nitrogen and tillage systems improve wheat productivity and profitability under semiarid climates. Journal of Pharmacognosy and Phytochemistry, 1, 73-78.
[8] Alemu Rorisa, S. (2017). EFFECT OF BLENDED NPS AND N FERTILIZER RATES ON YIELD COMPONENTS, YIELD AND GRAIN PROTEIN CONTENT OF BREAD WHEAT (Triticum aestivum L.) IN BORE DISTRICT, GUJI ZONE, SOUTHERN ETHIOPIA (Doctoral dissertation, Haramaya university)., Ethiopia).
[9] Ali, A., Ahmad, A., Syed, W. H., Khaliq, T., Asif, M., Aziz, M., & Mubeen, M. (2011). Effects of nitrogen on growth and yield components of wheat.(Report). Science International (Lahore), 24, 331-2.
[10] Anwar, S., Israeel, B. I., Khan, S., Faraz, M., Ali, N., Hussain, S., & Anjum, M. M. (2021). 07. Nitrogen and phosphorus fertilization of improved varieties for enhancing yield and yield components of wheat. Pure and Applied Biology (PAB), 5(4), 727-737.
[11] Arega, G., & Setu, B. (2014). Prevalence, Incidence and Severity of Wheat Rust, an Response of Wheat Cultivars to Rust Infection. International Journal of Agronomy and Plant Production, 5(1), 13-19.
[12] Beketa, H. J., Kefale, D., & Yoseph, T. (2020). Effect of blended fertilizer types and rates on growth, yield and yield components of bread wheat (Triticum aestivum L.) in Wondo District, Southern Ethiopia. International Journal of Agriculture Innovations and Research, 8(4), 326-342.
[13] Brady, N. C., Weil, R. R. and Weil, R. R., 2008. The nature and properties of soils (Vol. 13, pp. 662-710). Upper Saddle River, NJ: Prentice Hall.
[14] Chaparro, J. M., Sheflin, A. M., Manter, D. K., & Vivanco, J. M. (2012). Manipulating the soil microbiome to increase soil health and plant fertility. Biology and Fertility of Soils, 48, 489-499.
[15] Das, D. K., & Mandal, M. (2015). Advanced technology of fertilizer uses for crop production. Fertilizer Technology I Synthesıs. Sinha, S., Pant, KK, Bajpai, S. (Eds.). Studium Press, LLC, USA, 101-150.
[16] Dewis, J. and Freitas, F., 1970. Physical and chemical methods of soil and water analysis.
[17] Donis, A., Getahun, D., Geremu, T., Girma, D., Feyisa, A., Dejene, L., & Tolosa, M. (2021). Determination of NPS Fertilizer Rate Based on Calibrated Phosphorus for Yield of Bread Wheat in Wachale District, North Shewa Zone, Oromia, Ethiopia. American Journal of Plant Biology, 6(3), 73-77.
[18] EthioSIS, 2014. Soil fertility classification system.
[19] Goda, D. D. (2022). Influence of nitrogen fertilizer levels on growth and development of bread wheat (Triticum aestivum L.) varieties at Kulumsa, South-Eastern Ethiopia. American Journal of Life Sciences, 10(2), 21-27.
[20] Grant, C. D., 2003. Book Review: The Nature and Properties of Soils, NC Brady, RR Weil, Prentice Hall, Upper Saddle River, NJ, 960 pp., ISBN 0-13-016763-0. Agriculture, Ecosystems and Environment, 95(1), pp. 393-394.
[21] Guarin, J. R., Martre, P., Ewert, F., Webber, H., Dueri, S., Calderini, D., Reynolds, M., Molero, G., Miralles, D., Garcia, G. and Slafer, G., 2022. Evidence for increasing global wheat yield potential. Environmental Research Letters, 17(12), p. 124045.
[22] Guo, Z., Zhao, Y., Röder, M. S., Reif, J. C., Ganal, M. W., Chen, D., & Schnurbusch, T. (2018). Manipulation and prediction of spike morphology traits for the improvement of grain yield in wheat. Scientific reports, 8(1), 1-10.
[23] Haileselassie, B., Habte, D., Haileselassie, M., & Gebremeskel, G. (2014). Effects of mineral nitrogen and phosphorus fertilizers on yield and nutrient utilization of bread wheat (Tritcum aestivum) on the sandy soils of Hawzen District, Northern Ethiopia. Agriculture, Forestry and Fisheries, 3(3), 189-198.-198.
[24] Harfe, M. (2017). Response of bread wheat (Triticum aestivum L.) varieties to N and P fertilizer rates in Ofla district, Southern Tigray, Ethiopia. African Journal of Agricultural Research, 12(19), 1646-1660.
[25] Havlin, J., Balster, N., Chapman, S., Ferris, D., Thompson, T. and Smith, T., 2010. Trends in soil science education and employment. Soil Science Society of America Journal, 74(5), pp. 1429-1432.
[26] Hazelton, P. and Murphy, B., 2025. Interpreting soil test results: What do all the numbers mean?. CSIRO publishing.
[27] Horneck, D. A., et al., 2011. Soil nutrient analysis methods.
[28] Horneck, D. A., Sullivan, D. M., Owen, J. S. and Hart, J. M., 2011. Soil test interpretation guide.
[29] Hussain, S., Farooq, M., Wahid, M. A., & Wahid, A., 2013 (2019). Grain quality and yield response of bread wheat (Triticum aestivum L.) Varieties to different rates of blended fertilizer at Kulumsa, South-eastern Ethiopia, 4(August), pp. 120-133.
[30] Islam, J. N. (2002). An introduction to mathematical cosmology. Cambridge University Press.
[31] Itelima, J. U., Bang, W. J., Onyimba, I. A., Sila, M. D. and Egbere, O. J., 2018. Bio-fertilizers as key player in enhancing soil fertility and crop productivity: A review.
[32] Khan MA, Hussain I, Baloch MS. 1999. Wheat yield potential current status and future strategies. Pak J Biol Sci.; 3(1): 82-6.
[33] KINACI, G. (2000). Effect of zinc microelement on quality of some wheat cultivars grown in Central Anatolia. Turkish Journal of Agriculture and Forestry, 24(5), 601-606.
[34] Landon, J. R., 1991. Booker tropical soil manual; a handbook for soil survey and agricultural land evaluation in the tropics and subtropics.
[35] Landon, J. R., 2014. Booker tropical soil manual: a handbook for soil survey and agricultural land evaluation in the tropics and subtropics. Routledge.
[36] Maqsood, M. U. H. A. M. M. A. D., Ali, A. S. I. F., Aslam, Z., Saeed, M., & Ahmad, S. (2002). Effect of irrigation and nitrogen levels on grain yield and quality of wheat (Triticum aestivum L). Int. J. Agri. Biol, 4(1), 164-165.
[37] Melesse H., 2017. Response of bread wheat (Triticum aestivum L.) varieties to N and P fertilizer rates in Ofla district, Southern Tigray, Ethiopia. African Journal of Agricultural Research 12(19): 1646-1660.
[38] Mulugeta, T., 2018. EFFECTS OF LAND USE TYPES ON SELECTED SOIL PHYSICOCHEMICAL PROPERTIES: THE CASE OF KUYU DISTRICT, CENTRAL HIGHLAND OF ETHIOPIA (Doctoral dissertation).
[39] Olsen, S. R., 1954. Estimation of available phosphorus in soils by extraction with sodium bicarbonate (No. 939). US Department of Agriculture.
[40] Prystupa, P., Slafer, G. A. and Savin, R., 2003. Leaf appearance, tillering and their coordination in response to NxP fertilization in barley. Plant and Soil, 255, pp. 587-594.
[41] Rut-Duga, D., Diriba-Shiferaw, G., & Worku, W. (2019). Effects of blended fertilizer rates on bread wheat (Triticum aestivum L.) varieties on growth and yield attributes. Journal of Biology, Agriculture and Healthcare, 9(15), 1-12.
[42] Senbeta, A. F., & Worku, W. (2023). Ethiopia’s wheat production pathways to self-sufficiency through land area expansion, irrigation advance, and yield gap closure. Heliyon, 9(10). Bio-resource and Stress Management, 14(1), 19-32.
[43] Sigaye, M. H., Mekuria, R. and Kebede, K., 2022. Effect of NPS-B Blended and Nitrogen Fertilizers Application on Bread Wheat Yield and Economic Profitability on Nitisol of Southern, Ethiopia.
[44] Singh nee’ Nigam, P., Gupta, N. and Anthwal, A., 2009. Pre-treatment of agro-industrial residues. Biotechnology for agro-industrial residues utilisation: Utilisation of agro-residues, pp. 13-33.
[45] Spink, J. H., Semere, T., Sparkes, D. L., Whaley, J. M., Foulkes, M. J., Clare, R. W., & Scott, R. K. (2000). Effect of sowing date on the optimum plant density of winter wheat. Annals of applied biology, 137(2), 179-188.
[46] Stewart, W. M., Dibb, D. W., Johnston, A. E. and Smyth, T. J., 2005. The contribution of commercial fertilizer nutrients to food production. Agronomy journal, 97(1), pp. 1-6.
[47] Tadesse, W., Bishaw, Z., & Assefa, S. (2019). Wheat production and breeding in Sub-Saharan Africa: Challenges and opportunities in the face of climate change. International Journal of Climate Change Strategies and Management, 11(5), 696-715.
[48] Tagesse, A., B. Ketema and T. Tamado, 2018. Effect of Blended NPS Fertilizer Supplemented with Nitrogen on Yield Components and Yield of Bread Wheat (Triticum aestivum L.). Journal of Natural Sciences Research, 18(11): 90-96.
[49] Tekalign, M., et al., 1991. Ethiopian soil analysis procedures.
[50] Usman Kedir1, Tamado Tana2, W. W., 2020. Effects of Blended (NPSB) Fertilizer Rates on Yield Components, Yield and Grain Quality of Bread Wheat (Triticum Aestivum L.) Varieties at Kulumsa, South-Eastern Ethiopia, 8(9), pp. 14-27.
[51] Walkley, A. and Black, I. A., 1934. An examination of the Degtjareff method for determining soil organic matter, and a proposed modification of the chromic acid titration method. Soil science, 37(1), pp. 29-38.
Cite This Article
  • APA Style

    Jida, D. M. (2026). Effect of NPS and Urea Fertilizer Rates on Phenology, Growth and Yield Components of Bread Wheat (Triticum Aestivum L.) in West Guji Southern Oromia. Science Journal of Chemistry, 14(4), 130-141. https://doi.org/10.11648/j.sjc.20261404.12

    Copy | Download

    ACS Style

    Jida, D. M. Effect of NPS and Urea Fertilizer Rates on Phenology, Growth and Yield Components of Bread Wheat (Triticum Aestivum L.) in West Guji Southern Oromia. Sci. J. Chem. 2026, 14(4), 130-141. doi: 10.11648/j.sjc.20261404.12

    Copy | Download

    AMA Style

    Jida DM. Effect of NPS and Urea Fertilizer Rates on Phenology, Growth and Yield Components of Bread Wheat (Triticum Aestivum L.) in West Guji Southern Oromia. Sci J Chem. 2026;14(4):130-141. doi: 10.11648/j.sjc.20261404.12

    Copy | Download

  • @article{10.11648/j.sjc.20261404.12,
      author = {Deme Megersa Jida},
      title = {Effect of NPS and Urea Fertilizer Rates on Phenology, Growth and Yield Components of Bread Wheat 
    (Triticum Aestivum L.) in West Guji Southern Oromia},
      journal = {Science Journal of Chemistry},
      volume = {14},
      number = {4},
      pages = {130-141},
      doi = {10.11648/j.sjc.20261404.12},
      url = {https://doi.org/10.11648/j.sjc.20261404.12},
      eprint = {https://article.sciencepublishinggroup.com/pdf/10.11648.j.sjc.20261404.12},
      abstract = {Bread wheat (Triticum aestivum L.) is one of the major food crops cultivated in West Guji and plays a significant role in ensuring food security in Ethiopia. However, low soil fertility and inadequate fertilizer application are among the major constraints limiting wheat productivity in the study area. The study took place in the West Guji southern Oromia, during the main cropping season in 2023. The study was aimed to determine the combined application of NPS and urea (N) fertilizer rates for bread wheat (Triticum aestivum L.) production. The treatments were (0 NPS) negative control, 60 kg NPS, 120 kg NPS, and 180 kg NPS, and (0 N) negative control, 140 kg N, 280 kg N, and positive control (100/100 kg ha⁻1 NPS/N). The treatments were arranged in a randomized complete block design and replicated three times. The results of the analysis of variance for agronomic characters indicated that the effects of fertilizer application rates were significant for the date of 50% heading, the date of 90% physiological maturity, plant height, the number of total tillers per plant, spike length per plant, effective tiller per plant, spikelet per spike, the number of grains per spike, thousand seed weight, and harvest index. The maximum duration of 50% days to heading (83.67 days) and day to 90% physiological maturity (136 days) was obtained from unfertilized plants, whereas the minimum duration of 50% day to heading (70.33 days) and day to 90% physiological maturity (120 days) was obtained from 180 kg NPS ha⁻1 + 280 kg N ha⁻1 fertilizer rates, respectively. The maximum plant height (92.5 cm) was also recorded under the highest fertilizer treatment, indicating a strong correlation between nutrient application and plant growth. These findings suggest that balanced fertilizer rates can significantly enhance both yield components and overall plant development. 21 cm), effective tiller per plant (5.21), number of total tillers per plant (5.25), spike length (9.21 cm), and 180 kg NPS ha⁻1 + 280 kg N ha⁻1 fertilizer rates, respectively. The maximum spikelet per spike (19) and number of grains per spike (74.67) were obtained from 120 kg NPS ha⁻1 + 140 kg N ha⁻1 fertilizer rates, respectively. The maximum thousand grains weight (38.00 gm) and harvest index (44.33%) were obtained from 180 kg NPS ha⁻1 + 140 kg N ha⁻1 fertilizer rates, respectively. Therefore, 180 kg/280 kg and 180 kg/140 kg ha⁻1 NPS/urea (N) are better, but 120/140 kg is best for gain yield, and the farming community can be used in the study area. This suggests that optimizing fertilizer application can significantly enhance bread wheat yield and yield components. Future research should focus on refining these rates further to maximize efficiency and sustainability in agricultural practices.},
     year = {2026}
    }
    

    Copy | Download

  • TY  - JOUR
    T1  - Effect of NPS and Urea Fertilizer Rates on Phenology, Growth and Yield Components of Bread Wheat 
    (Triticum Aestivum L.) in West Guji Southern Oromia
    AU  - Deme Megersa Jida
    Y1  - 2026/09/08
    PY  - 2026
    N1  - https://doi.org/10.11648/j.sjc.20261404.12
    DO  - 10.11648/j.sjc.20261404.12
    T2  - Science Journal of Chemistry
    JF  - Science Journal of Chemistry
    JO  - Science Journal of Chemistry
    SP  - 130
    EP  - 141
    PB  - Science Publishing Group
    SN  - 2330-099X
    UR  - https://doi.org/10.11648/j.sjc.20261404.12
    AB  - Bread wheat (Triticum aestivum L.) is one of the major food crops cultivated in West Guji and plays a significant role in ensuring food security in Ethiopia. However, low soil fertility and inadequate fertilizer application are among the major constraints limiting wheat productivity in the study area. The study took place in the West Guji southern Oromia, during the main cropping season in 2023. The study was aimed to determine the combined application of NPS and urea (N) fertilizer rates for bread wheat (Triticum aestivum L.) production. The treatments were (0 NPS) negative control, 60 kg NPS, 120 kg NPS, and 180 kg NPS, and (0 N) negative control, 140 kg N, 280 kg N, and positive control (100/100 kg ha⁻1 NPS/N). The treatments were arranged in a randomized complete block design and replicated three times. The results of the analysis of variance for agronomic characters indicated that the effects of fertilizer application rates were significant for the date of 50% heading, the date of 90% physiological maturity, plant height, the number of total tillers per plant, spike length per plant, effective tiller per plant, spikelet per spike, the number of grains per spike, thousand seed weight, and harvest index. The maximum duration of 50% days to heading (83.67 days) and day to 90% physiological maturity (136 days) was obtained from unfertilized plants, whereas the minimum duration of 50% day to heading (70.33 days) and day to 90% physiological maturity (120 days) was obtained from 180 kg NPS ha⁻1 + 280 kg N ha⁻1 fertilizer rates, respectively. The maximum plant height (92.5 cm) was also recorded under the highest fertilizer treatment, indicating a strong correlation between nutrient application and plant growth. These findings suggest that balanced fertilizer rates can significantly enhance both yield components and overall plant development. 21 cm), effective tiller per plant (5.21), number of total tillers per plant (5.25), spike length (9.21 cm), and 180 kg NPS ha⁻1 + 280 kg N ha⁻1 fertilizer rates, respectively. The maximum spikelet per spike (19) and number of grains per spike (74.67) were obtained from 120 kg NPS ha⁻1 + 140 kg N ha⁻1 fertilizer rates, respectively. The maximum thousand grains weight (38.00 gm) and harvest index (44.33%) were obtained from 180 kg NPS ha⁻1 + 140 kg N ha⁻1 fertilizer rates, respectively. Therefore, 180 kg/280 kg and 180 kg/140 kg ha⁻1 NPS/urea (N) are better, but 120/140 kg is best for gain yield, and the farming community can be used in the study area. This suggests that optimizing fertilizer application can significantly enhance bread wheat yield and yield components. Future research should focus on refining these rates further to maximize efficiency and sustainability in agricultural practices.
    VL  - 14
    IS  - 4
    ER  - 

    Copy | Download

Author Information
  • Abstract
  • Keywords
  • Document Sections

    1. 1. Introduction
    2. 2. Materials and Methods
    3. 3. Results and Discussion
    4. 4. Conclusion and Recommendations
    Show Full Outline
  • Abbreviations
  • Author Contributions
  • Conflicts of Interest
  • References
  • Cite This Article
  • Author Information