1. Introduction
Today, there are very few countries that are completely self-sufficient in terms of technology. Even advanced countries are not free from the need to import technology. However, the need for technology transfer is much more urgent and critical for countries like ours, as technology transfer is considered one of the key components of development. The approach to technology transfer in importing countries focuses on selecting technologies that align with the needs of these countries. In this approach, the main issue is adapting the imported technology to the specific requirements of the importing country. This adaptation, sometimes referred to as 'localization, aims to both determine the nature and extent of dependence on technology, and to find ways to overcome it while preserving cultural identity
| [24] | Mahnak, K. (2003), Technology Transfer. (A. Azarang, Ed.). Tehran: Hermes Publications. |
[24]
.
The prerequisite for technology transfer is converting imported technology into technology that is suitable for the conditions and circumstances of each region, which is an issue that is often not given serious attention in developing countries. As a result, technology transfer is often limited to the production of equipment and training of specialized personnel. However, when transferring technology, the impact of the technology on the social and cultural characteristics of the importing country must always be taken into consideration
| [24] | Mahnak, K. (2003), Technology Transfer. (A. Azarang, Ed.). Tehran: Hermes Publications. |
[24]
.
In the study by Toso et al., it is stated that the types of risks associated with technology transfer include deductive risk, production process risk, equipment, facilities, and infrastructure risk, and project risk. However, change is one of the factors that leads to deductive risk. Some technology transfer risks arise from known and unforeseen changes in the technology transfer process
. Regarding intellectual property rights risk, it can also be noted that some countries provide limited protection for intellectual property rights and allow greater freedom for former employees with regard to proprietary information of other companies
| [9] | Cannice, M. V.; Roge. (Rongxin) C. D. D. (2003), Managing international technology transfer risk: A case analysis of U.S. high-technology firms in Asia. The Jurnal of High Technology Management Research, 14, 171-178. https://doi.org/10.1016/S1047-8310(03)00020-8 |
[9]
.
Just as enablers for technology transfer have been identified, 17 barriers to the technology transfer process have also been identified, which include social risks, political risks, economic risks, personal barriers, cultural risks, managerial attitudes, resistance to change, lack of communication and information management systems, lack of IT empowerment, lack of time, extremely high costs, meeting needs with current products, lack of access to labor and resources, resource wastage in imported technologies, complexity, incompatible technologies, the neutral role of small and medium-sized enterprises, and weak and inefficient internal R&D activities
.
Teese, who has also been studying 26 reasons for international technology transfer, has mentioned transfer costs as significant
| [9] | Cannice, M. V.; Roge. (Rongxin) C. D. D. (2003), Managing international technology transfer risk: A case analysis of U.S. high-technology firms in Asia. The Jurnal of High Technology Management Research, 14, 171-178. https://doi.org/10.1016/S1047-8310(03)00020-8 |
| [38] | Teece, D. J. (1977), Technology Transfer by Multinational Firms: The Resource Cost of Transferring Technological Know-How. The Economic Journal, 87, 242-261. https://doi.org/10.2307/2232084 |
[9, 38]
.
Based on the studies by Jung et al, 29 additional risks were identified through surveys and their related strategies, which impact the internal environment of the technology-receiving organization. These risks include: shortage of personnel and excessive workload, insufficient support from the executive unit and management, unrealistic budgets and plans, ambiguity in work stages and implementation guidelines, a work environment that easily becomes chaotic and is prone to intervention (difficult to focus on work), a work environment lacking a sense of collaboration and cooperation, insufficient knowledge of the introduced technology, lack of experience such as tacit technical knowledge in executing projects to introduce new technology, lack of understanding of the systems in which the new technology is applied, lack of business information and objectives, failure to establish proper communication between related companies or departments, design errors or mistakes, immaturity and lack of operational growth due to the lack of experience with new technologies, poor specifications of requirements (unclear requirements), weakness in delivery, delivery delays, lack of sufficient information about the project, potential risks due to the incompleteness of the new technology, inadequate system for approving new technology, absence of foundational technology for deploying new technology, the impact of interfering systems when introducing new technology, effects on certifications (uncertainty in obtaining permits), practical constraints such as: availability of equipment suppliers, equipment supply from suppliers with insufficient industry experience, reduced requirements due to practical limitations of equipment (caused by pressure from higher management fearing project failure), avoidance of responsibility due to insufficient compensation relative to the high work risks, errors or mistakes resulting from overconfidence or negligence, lack of employee commitment, frequent changes in participants, and stress
.
Another study conducted by Akbari et al, identified components that create risks in technology transfer for both the technology-donating organization and the technology-receiving organization. According to this research, these components include weaknesses in knowledge factors, organizational factors, technological factors, and communication factors, as well as a lack of workforce training and inadequate understanding of the physical environment
| [2] | Akbari, Morteza; Mehrabi Firozabad, Leila; Mobini Dehkordi, Ali. (2015), Identifying Factors Affecting the Successful Transfer of Nanotechnology. Quarterly Journal of Innovation Management, 4(3), 75-96. |
[2]
.
Moreover, most organizations delay adopting complex technologies until they acquire sufficient tacit knowledge about successful implementation and operation. Reinvention and learning by doing may serve as a response to the challenges or shortcomings in transferring technical knowledge between recipient and sender organizations. Technical tacit knowledge is relatively immobile and must be recreated by the user organizations. Consequently, the responsibility of developing technical tacit knowledge through learning organizations becomes a barrier to the adoption of new technologies. Given such obstacles, the relationships between technology-receiving and technology-sending organizations within a network extend beyond mere buying and selling
.
One of the problems faced by industries in developing countries is the ineffectiveness of imported transferred technologies. The most significant factor contributing to this issue is the incomplete execution of the technology transfer phases or the failure to use an appropriate technology transfer method
| [22] | KHAMSEH, ABBAS; AZADI, AZADEH. (2011), ASSESSMENT OF TECHNOLOGY TRANSFER PROCESS AND DETERMINING THE BEST PRACTICES FOR TECHNOLOGY TRANSFER BY AHP MODEL; CASE STUDY: AZARAB INDUSTRY. ROSHD-E-FANAVARI, 7(26), 3-13. |
[22]
.
Given the importance of the dietary supplements industry in human and animal health, as well as its role in the development of the agricultural sector and exports, it is essential to identify and assess the risks that this sector poses to individual health and the environment. Our goal is to leverage the sensitivity surrounding dietary-pharmaceutical supplements and utilize the backpropagation algorithm method to develop a model for evaluating the risks associated with technology transfer in the production of pharmaceutical-dietary supplements.
2. Literature Review and Research Background
2.1. Risk Assessment and Management
In project management, risk management is an area where significant financial savings can be achieved. A critical stage of project risk management is associated with the assessment of potential risk sources, through which potential responses can be formulated
.
Organizing individuals and documentation is a critical aspect of risk management in technology transfer. Having an integrated technology transfer team structure allows all relevant functions to address changes promptly, mitigate them in a timely manner, and escalate issues quickly
.
According to Razz et al, the highly competitive world of today constantly drives significant changes in organizations and work environments
| [32] | Razz, R.; Urdaneta, J. M.; Clavero, T. (2001), Effect of the frequency and height of defoliation on the nutritive value of Acacia mangium Willd. Rainy season. Cuban Journal of Agricultural Science, 35(2), 179-182. |
[32]
. These changes lead to the emergence of risks that threaten organizational goals, potentially hindering the achievement of these objectives and even leading to the organization's downfall. Project-based organizations are more exposed to risks compared to function-specific organizations due to the unique and dynamic nature of projects, which inherently introduces numerous risks.
For this reason, risk management in project management has gained special importance. Today, it constitutes one of the main components of the "Project Management Body of Knowledge." Since projects are characterized by complexity and uniqueness and are carried out over different timeframes with diverse requirements for human resources, financial resources, raw materials, and intellectual capital, their predetermined objectives are always susceptible to risks. Therefore, risk management is now recognized as a critical factor in organizational success and an essential and inseparable part of project management.
As complexity and competition in project execution increase, the significance of risk management becomes even greater. There is now a direct relationship between project success and effective risk management
| [29] | Mulcahy, M.; Evans, DS.; Hammond, SK.; et al. (2005), Secondhand smoke exposure and risk following the Irish smoking ban: an assessment of salivary cotinine concentrations in hotel workers and air nicotine levels in bars. Tobacco Control, 14, 384-388. |
[29]
. Risk management is a systematic process and an effective approach for analyzing and responding to future uncertainties
| [21] | Kezsbum, D. S.; Edward, K. (2001), The new dynamic project management: wining trough the competitive advantage. John Wiley 2nd ed. ISBN: 0471254940. |
[21]
. It serves as a tool for efficient project management throughout its lifecycle by identifying, assessing, and responding to uncertainties to maximize positive outcomes and minimize the negative consequences of events
| [8] | Burke, Robin. (1999), Integrating Knowledge-based and Collaborative-filtering Recommender Systems. Proceedings of the Workshop on AI and Electronic Commerce, 1. |
[8]
.
This process involves identifying and assessing risks based on their significance and the organization's capabilities, taking the necessary steps to reduce the likelihood and impact of these risks. Risk assessment is a process aimed at better understanding risks, prioritizing them for further actions such as quantitative risk analysis or response planning. This process ensures optimal allocation of time, budget, and resources by the risk management team to effectively address risks, as limited resources do not allow for dealing with all risks. Therefore, it is essential to focus on those risks that are most critical to the project.
Thus, risk is an inseparable part of any technology transfer project, stemming from the unique and dynamic nature of projects. Proper management of project-threatening risks can ensure project success in today’s competitive environment. This can only be achieved through teamwork and comprehensive collaboration among all project stakeholders. Risks can only be effectively managed and controlled when the value of each risk to the project is clearly defined, which requires a thorough evaluation of the various impacts of risks while considering the temporal conditions of the project.
The importance of identifying and assessing risk is evident to everyone. Clearly, this importance becomes even greater for unknown products and new technologies. On the other hand, there are many methods available for identifying and assessing risks. However, there is no specific model to suggest the most appropriate method for risk identification and assessment tailored to different industrial processes
| [5] | Asgharizadeh, Ezzatollah.; Saeedi, Azita.;. (2007), Optimizing project risk assessment by developing impact indicators. The First International Risk Management Congress, Tehran, https://civilica.com/doc/42394 |
[5]
.
2.2. Health Technology Assessment (HTA)
The significant growth of health technologies in recent years in areas such as pharmaceuticals, diagnostic tools, telemedicine, and surgical equipment has brought notable advancements in achieving health, improving quality of life, and delivering treatments
| [3] | Arabzouzani, M.; Vafaeenasab, M.; Ameri, H.; Jafari, A. (2014), The role of health technology assessment in evidence-based decision-making and policy-making in the health sector. Health management, 57, 99-112. |
[3]
. Today, countries around the world spend substantial amounts on enhancing the health of their populations. To ensure proper prevention and treatment of various diseases, the healthcare system must utilize the best and most up-to-date technologies to achieve effectiveness in society while saving costs for both the government and patients
| [36] | Sadat Hoseini, S. A.; Baghestani, M.; Dehghan, H.; Behzadifar, M. (2015), Ethics in Health Technology Assessment, Quarterly Journal of Khorramabad Medical System Organization. 1(1), 33-43. |
[36]
.
Health Technology Assessment (HTA) is a multidisciplinary process that systematically, transparently, and robustly summarizes information related to the medical, social, economic, and ethical aspects of health technology applications. Its purpose is to raise awareness and provide information for formulating accurate and effective health policies that are patient-centered and aim to achieve the best value
.
The scope of this field is vast and involves addressing issues such as identifying a problem within a country’s healthcare structure. It then evaluates new technologies for addressing that issue, assessing their safety, clinical effectiveness, cost-effectiveness, ethical considerations, organizational implications, and the legal and social aspects of using a new technology
| [23] | Liberati, A. A. S. D. B. (1997), EUR-ASSESS Project Subgroup Report on Methodology: Methodological Guidance for the Conduct of Health Technology Assessment. Int J Techno Assess Health Care, 13(2), 186-219. https://doi.org/10.1017/s0266462300010369 |
[23]
.
Health Technology Assessment (HTA) aims to provide appropriate inputs for setting priorities and making important decisions in the healthcare system. It emphasizes systematic evaluation of the characteristics, effects, and side effects of healthcare technologies, as well as the analysis of the short-term and long-term impacts of a specific technology or a group of technologies.
Some experts consider HTA as a part of policy studies, aiming to gather information on the economic, environmental, social, political, and legal impacts and outcomes of a new technology or significant changes in an older one, for the benefit of decision-makers in that field. Meanwhile, others believe that HTA can focus solely on identifying and analyzing the negative consequences of a technology, viewing it as a research-based process aimed at assessing the problems arising from the use of various technologies in health and disease domains
| [30] | Nouri Najafi, S. G.; Sedighi, A. (2008), Technology Transfer through Clean Development Mechanism. Iran Technology Management Conference. https://sid.ir/paper/813316/fa |
[30]
.
HTA takes into account the broader impacts of health technologies and evaluates their benefits and costs in both clinical and economic dimensions. This helps optimize the use of specific interventions, appropriately position them within the spectrum of care, and identify the patients who will benefit from them. Historically, HTA has been applied to medical devices and expensive drugs, but it is increasingly being used to assess a broader range of interventions, including therapeutic and surgical methods, organizational and supportive tools for care, and, to a lesser extent, public health programs
| [31] | Oliver, A; Mossialos, E. R. R. (2004), Health technology assessment and its influence on health-care priority setting. International Journal of Technology Assessment in Health Care, 20(1), 1-10. https://doi.org/10.1017/s026646230400073x |
[31]
.
The use and implementation of health technologies have increasingly been driven by a growing group of healthcare policymakers. In fact, producers of health products, physicians, patients, hospital managers, payers, political leaders, and others are increasingly seeking information to support their decisions regarding how to implement a technology, approve it for market access, acquire it, pay for its use, and more. This information needs to be prepared in an optimal manner. The emergence and dissemination of Health Technology Assessment (HTA) in the public and private sectors likely reflect this type of demand
| [35] | Sacchini, D.; Virdis, A.; Refolo, P.; Pennacchini, M.; Carrasco de Paula, I. (2009), Health technology assessment (HTA): ethical aspects. Medicine, Health Care and Philosophy, 12(4), 453-457. https://doi.org/10.1007/s11019-009-9206-y |
[35]
.
HTA is a comprehensive form of policy research that examines the short-term and long-term social consequences (e.g., social, economic, ethical, and legal) of technology applications
| [34] | Saarni, S. I.; Annett, B.-M. H.-J.-W. (2011), Different methods for ethical analysis in health technology assessment: An empirical study. International Journal of Technology Assessment in Health Care, 27(4), 305-312. https://doi.org/10.1017/S0266462311000444 |
[34]
.
The dimensions identified in Health Technology Assessment (HTA) by various individuals and organizations include the technological, political and legal, social and cultural, economic, organizational, and health dimensions
| [14] | Farnoodi, Sanam. (2009), Presenting a Framework for Evaluation of Health Technologies in Health and Medical System of Iran; Case Study: Robolens Robot. Quarterly Scientific-Research Journal of Science and Technology Policy, 2(3), 75-86. https://doi.org/20.1001.1.20080840.1388.2.3.7.4 |
[14]
. The creation and development of technologies do not always lead to health benefits. In the history of medicine, drugs, and healthcare, there are numerous examples of technologies that not only failed to deliver the expected benefits but also caused harm. Therefore, it is essential to ensure that health technologies are properly assessed and then effectively applied in healthcare delivery.
HTA can help reduce the use of technologies that are unsafe, inefficient, or have costs that outweigh their benefits. It serves as a knowledge management tool, producing findings that enhance our understanding of the relationships between interventions and healthcare outcomes. HTA can also be used to create and refine a range of standards and strategies aimed at improving the quality of healthcare services.
Another key role of HTA is to provide evidence-based data for the decision-making process to policymakers and healthcare system decision-makers who are primarily concerned about the use of health technologies. In other words, HTA acts as a bridge between research and decision-making.
In HTA, aspects such as applications, technical features, safety, performance, clinical effectiveness, economic factors, costs, and structural issues (cultural, social, and ethical) of a technology are examined
| [27] | Mokhtari, P.; Akbari Sari, A.; Ai, M.; Manavi, S. (2010), Safety and performance of dual-source CT scan compared with single-source CT scan and conventional angiography in the diagnosis of coronary artery disease (systematic review). Hospital, 9(2-1(34)), 25-32. https://sid.ir/paper/106715/fa |
| [25] | Marzban, S.; Shariati, B.; Hashemi, E. (2007), Health Technology Assessment Methodology. Tehran: Shokravi. |
| [17] | Goodman, C. S. (2004), INTRODUCTION TO HEALTH TECHNOLOGY ASSESSMENT, Virginia, USA: The Lewin Group. |
| [7] | Boos, N. (2007), Health care technology assessment and transfer. Eur Spine J, 16, 1291-1292. https://doi.org/10.1007/s00586-007-0440-9 |
| [18] | Hailey, D. (2002), LOCAL HEALTH TECHNOLOGY ASSESSMENT: A Guide for Health Authorities. Alberta Heritage Foundation for Medical Research. |
| [4] | Ascoli, G. L. B. A. M. J. M. G. (2009), Health technology assessment: principles, methods and current status. Radio L Med, 114, 673-691. https://doi.org/10.1007/s11547-009-00387-5 |
[27, 25, 17, 7, 18, 4]
.
In terms of technology adoption, numerous theories and models exist, some of which have been applied in healthcare. The key factors influencing the adoption of information technology in healthcare systems include ease of use, perceived usefulness, social influence, facilitating conditions, attitude toward use, and user behavior. Developing countries should implement electronic medical records (EMRs) to manage patient care
; however, before doing so, they need to establish electronic health records (EHRs).
In a study conducted by the American Institute of Medicine in 2001, only 31% of physicians stated that using electronic human resources would reduce the burden of managing medical records
. Studies have shown that the use of electronic records in today’s complex healthcare systems faces many challenges, requiring organizational readiness and workforce preparedness.
Researchers and policymakers managing new information systems can measure system adoption. Measuring adoption provides significant support for the successful implementation of a system. Therefore, before implementation, both technical and non-technical factors should be identified, and barriers to implementation must be addressed
| [6] | Block, B. M. (2008), How We Improved Our Practice and Our Bottom Line with a New EMR System. FAMILY PRACTICE MANAGEMENT, 15(7), 25-30. PMID: 18763681. |
| [16] | Garavand, A.; M. M. H. A. M. E. M. M.-J. A., & Moosavi. (2016), Factors influencing the adoption of health information technologies: a systematic review. Electronic Physician, 8(8), 2713-2718. https://doi.org/10.19082/2713 |
[6, 16]
.
2.3. Pharmaceutical-Nutritional Supplements
In 1994, the U.S. Council for Dietary Supplement Education and Health passed the Dietary Supplement Health and Education Act (DSHEA), defining dietary or pharmaceutical supplements as follows:
A dietary supplement is a product taken orally that contains a nutrient intended to supplement an individual's diet. The nutritional components in these products include vitamins, minerals, herbal ingredients, amino acids, and substances like enzymes, glandular secretions, and metabolites.
Dietary supplements are available in forms such as tablets, capsules, syrups, or powders. While they are not classified as drugs, they can enhance bodily functions and, in addition to prevention, aid in the treatment of various diseases.
According to the U.S. Council for Dietary Supplement Education and Health, a product is considered a dietary supplement only if it is labeled as a dietary supplement
| [37] | Shini Moghadam, K. (2014), How the FDA Regulates Dietary Supplements. Taran Yab Quarterly, 5, 25. |
[37]
.
In Iran, since 1976, with the establishment of units for monitoring food, beverages, cosmetics, health products, and pharmaceuticals, matters related to supplements and specialized foods were handled by either the food or drug departments. However, in 2005, these responsibilities were consolidated under the newly independent "Department of Supplements and Specialized Foods." Currently, the General Directorate for the Supervision and Evaluation of Natural, Traditional, and Supplementary Products operates as one of the executive arms of the Food and Drug Organization. It is tasked with ensuring the safety and security of supplements and specialized foods by utilizing skilled experts, legal frameworks, and adherence to religious values and beliefs to guarantee maximum safety and health for all members of society.
The Food and Drug Organization conducts continuous monitoring of supplements in the market to ensure public health and track product quality. Distribution of supplements is carried out through companies approved by the organization. The distribution of the first batch of imported products is conditional upon receiving test results confirming compliance with the analysis certificate from the National Reference Laboratory for Food and Drug Control.
The responsibilities of registering products, monitoring the quality of domestically produced or imported products, providing information, recalling products, and addressing any adverse effects on human health or environmental impact lie fully with the producing or importing company. These measures are in place to ensure consistent quality and safety standards
| [37] | Shini Moghadam, K. (2014), How the FDA Regulates Dietary Supplements. Taran Yab Quarterly, 5, 25. |
[37]
.
The reality is that the vast majority of pharmaceutical and supplement production technologies in Iran have foreign origins, with domestic researchers playing a limited role in the development and creation of these technologies. Additionally, most pharmaceutical products currently manufactured in Iran rely on technologies of foreign origin. Unfortunately, the number of pharmaceutical and supplement technologies with indigenous origins that have reached the commercialization stage is very limited—barely exceeding a handful—due to various reasons, including the lack of proper infrastructure for knowledge production and technology creation.
It seems that until appropriate foundations for generating knowledge and developing practical technologies are established within the country, the pharmaceutical industry will continue to struggle with its current challenges. These challenges include the absence of "why-knowledge" and technical expertise related to the production of pharmaceuticals and supplements, as well as weaknesses in the organizational disciplines of pharmaceutical companies and a traditional, non-specialized marketing system
| [37] | Shini Moghadam, K. (2014), How the FDA Regulates Dietary Supplements. Taran Yab Quarterly, 5, 25. |
[37]
.
Overall, the findings indicate that the key factors influencing the introduction of technology in the pharmaceutical and supplement sectors—such as the domestic science and technology landscape, the business environment, infrastructure and legal requirements, and international collaborations—are not in a favorable state
| [37] | Shini Moghadam, K. (2014), How the FDA Regulates Dietary Supplements. Taran Yab Quarterly, 5, 25. |
[37]
.
2.4. Summary of Risk Assessment Factors in Technology Transfer
From the review of theoretical foundations and previous research, utilizing library studies including books, articles, and theses, a total of 161 risks in technology transfer were identified. Based on the conducted studies, the most significant risks in the pharmaceutical-nutritional supplement industry were narrowed down to 37 prioritized risks through expert interviews and their insights. These 37 risks have been categorized into 5 main groups, as shown in the table below.
Table 1. Technology Transfer Risks Affecting the Pharmaceutical-Nutritional Supplement Industry.
Row | ID | The main criterion | ID | Technology transfer risks |
1 | Q1 | Influence on health | X1 | The risk of microbial contamination |
2 | | X2 | Medicine side effects |
3 | | X3 | The short-term and long-term effects on the health system |
4 | Q2 | Resources accessibility | X4 | Incompleteness of technology supply chain and the lack of proper suppliers |
5 | | X5 | Organization inability to repair and maintain the equipment required in the intended technology |
6 | | X6 | The problems with funding needed to transfer |
7 | | X7 | Limited access to equipment and facilities due to sanctions or other reason. |
8 | | X8 | Failure to supply the necessary raw materials to conduct the project |
9 | | X9 | Lack of availability of specialist workforce |
10 | | X10 | lack of new technology verification systems |
11 | | X11 | Lack of education in accordance with technology |
12 | Q3 | Organizational Management and leadership Capability | X12 | Delay in project scheduling |
13 | | X13 | Inability to market new products |
14 | | X14 | Lack of proper capacity building in the organization (human capacity, hardware, etc.) |
15 | | X15 | Lack of experience and tacit knowledge for the project |
16 | | X16 | Failure to document the transfer process for optimal use in upcoming technology transfer projects |
17 | | X17 | Lack of alignment between the transfer model with organization goals and strategy |
18 | | X18 | Disproportion of organizational structure with the transfer model |
19 | | X19 | Inability to manage and upgrade technology |
20 | Q4 | The essence of technology and its nature | X20 | Technology incompatibility with the environment |
21 | | X21 | HSE problems |
22 | | X22 | Failure to achieve new developments after the transfer |
23 | | X23 | The technology complexity |
24 | | X24 | Inadequate and inefficient internal R&D activities |
25 | | X25 | Lack of technical know-how in the field of the introduced technology |
26 | | X26 | Immaturity and the growth of operations due to the lack of experience of new technologies |
27 | | X27 | Immaturity of technology |
28 | | X28 | Lack of basic technology to deploy the new technology |
29 | | X29 | Little knowledge of the company and industry on new technology |
30 | Q5 | Dependence on government policy and socioeconomic problems | X30 | Changes in business rules |
31 | | X31 | Lack of realistic estimation of transfer costs |
32 | | X32 | Change of government and its strategies |
33 | | X33 | Lack of legal security of the intellectual property of technology |
34 | | X34 | Disapproval of the transfer model with sanctioning conditions |
35 | | X35 | Lack of an incentive market in the industry |
36 | | X36 | Increased inflation |
37 | | X37 | The moral consequences of using technology (ignoring individuals, norms, beliefs and decisions about using or not using a technology) |
3. Materials and Methods
This study is applied in terms of its objective and uses a mixed quantitative and qualitative method. Accordingly, the error backpropagation algorithm is employed in this research to evaluate and predict the risks of technology transfer.
The research question is as follows:
What is an appropriate model for evaluating the risks of technology transfer in the pharmaceutical-nutritional supplement industry?
The statistical population of this research consists of approximately 150 experts in the field of technology transfer, preferably those familiar with the domain of animal pharmaceutical supplements. A total of 52 questionnaires from this population were used for statistical analysis.
To determine validity, feedback was sought from several experts in the pharmaceutical-nutritional supplement industry. After reviewing the questionnaires, these experts provided their opinions, and the questionnaires were subsequently revised based on their suggestions.
For reliability, the Cronbach's alpha coefficient was employed to measure the impact of the indicators. The Cronbach's alpha coefficient is presented in the table below.
Table 2. Reliability Coefficients Using Cronbach's Alpha.
Row | ID | The main criterion | Question Numbers | Number of Questions | Cronbach's Alpha Value | Standardized Cronbach's Alpha Value |
1 | Q1 | influence on health | 1-3 | 3 | 0.677 | 0.678 |
2 | Q2 | Resources accessibility | 4-11 | 8 | 0.877 | 0.879 |
3 | Q3 | Organizational Management and leadership Capability | 12-19 | 8 | 0.857 | 0.858 |
4 | Q4 | The essence of technology and its nature | 20-29 | 10 | 0.902 | 0.905 |
5 | Q5 | Dependence on government policy and socioeconomic problems | 30-37 | 8 | 0.839 | 0.841 |
As observed, since the Cronbach's alpha values are greater than 0.7, the reliability is confirmed. This indicates an internal consistency among the variables in measuring the intended concepts. Therefore, it can be concluded that the present research has the necessary reliability and dependability.
Error Backpropagation Algorithm:
In the past decade, significant work has been done on tuning the parameters of neural networks, leading to improved performance. The aim of many of these algorithms and proposed methods is to find a parameter value that minimizes the network's error. For example, various methods have been developed to adjust the learning rate and momentum for the error backpropagation algorithm, most of which aim to minimize the mean squared error. Additionally, strategies to avoid local minima in this algorithm have been proposed, with adding the momentum parameter being one such approach. Due to its desirable efficiency, the error backpropagation algorithm is often used as a learning algorithm in layered neural network structures
| [33] | Rumelhart, David E.; Hinton, Geoffrey E.; Williams, Ronald J., (1986), Learning representations by back-propagating errors, Nature Journal, 323, 533-536. https://doi.org/10.1038/323533a0 |
[33]
.
This algorithm is an iterative gradient descent method used for training feedforward neural networks. One of the key issues in multilayer feedforward neural networks is finding an appropriate (near-optimal) structure to solve the problem. In classical methods, the network designer specifies a structure for the network at the beginning of the training process, after which the network is trained, and the predetermined structure remains fixed during training. In these methods, determining the number of neurons in the hidden layer and their weights has a significant impact on the network's performance
| [26] | Meibodi, M.; Beigi, H. (2000), Neural Network Engineering by Learning Automata: Determining the Optimal Size for Three-Layer Neural Networks. Faculty of Engineering Journal, 34(4), 1-26. |
[26]
. The gradient descent rule, upon which this algorithm operates, is expressed as follows:
Here, W is the Weight Vector, n is the number of iterations, η is the learning rate, α is the momentum, and G is the gradient of the error function, which is calculated as follows:
Where Ep equals the sum of the following squared errors:
(3)
Where and represent the desired output and the actual output for pattern 𝑝 at output neuron 𝑗, respectively. The performance of this algorithm for a specific application depends heavily on the network topology (number of layers, number of neurons per layer, and inter-layer connections). Several algorithms have been proposed to optimize the structure of feedforward neural networks. In this research, the researcher employs the method of estimating optimal learning rate and momentum proposed by Chen and Yo.
Estimation of Optimal Learning Rate and Momentum in the Backpropagation Algorithm:
In 1995, Chen and Yo proposed a method for estimating momentum and learning rate, which will be discussed further below
| [11] | Chen, Jian De Z.; Lin, Zhiyue; Wu, Qiang; Mc Callum, Richard W., (1995), Non-invasive identification of gastric contractions from surface electrogastrogram using backpropagation neural networks, Medical Engineering & Physics, 17, 3, 219-225. https://doi.org/10.1016/1350-4533(95)95713-K |
[11]
.
Basic Formulas:
In this section, a general overview of the Backpropagation algorithm is first presented, followed by an explanation of the concept.
Cost Function (Least Squares):
(4)
represents the S-th output vector in a network with M layers. The training pairs are represented as:
. Each vector is the desired output vector with a dimension of . Similarly, represents the input vectors with a dimension of .
Weight Adjustment Method:
µ: Learning Rate
β: Momentum
: The gradient at
To analyze E(µ,β) where E is the cost function, μ is the learning rate, and β is the momentum, we treat E(µ,β) as a two-parameter function. The goal is to compute the first and second derivatives of E(μ,β) with respect to μ and β. Below are the required notations and the steps for the computations:
(6)
The i-th output of layer m for the s-th input training pattern is denoted as: .
P(k) represents the direction for gradient descent, defined as the negative of the gradient of the cost function E at W(k): P(k)=−∇E[W(k)]
represents the vector comprising all outputs of layer m-1 for the s-th input training pattern.
The estimation is based on the first and second derivatives of the cost function. Moreover, only the derivatives of E(μ,β) with respect to μ and β at the point μ=0 and β=0 are required. W(k), ΔW(k−1), and P(k) are unknown, and W(k−1) is obtained from Equation (
3). The results of the derivatives of Equation (
2) with respect to μ and β are presented below:
(7)
(8)
(9)
(10)
(11)
To complete equations (
5) through (
9), the derivatives of
at the point μ=0 and β=0 must be determined, which are obtained from equation (
4):
(12)
(13)
(14)
(15)
(16)
Note that
. The derivatives of
can be calculated iteratively from equation (
10) to equation (
14) by setting m=1, 2,…, M. Therefore, the derivatives of E(µ,β) are obtained. Additionally, in the above calculations, there are repetitive elements that should be computed only once to avoid redundant computations. However, the amount of computation for the first and second derivatives of E(µ,β) is double that of the standard BP computations.
Estimation of Learning Rate and Momentum:
Given that the goal is to optimize the two-variable function E(µ,β) with known values of W(k), P(k), and ΔW(k−1), E(μ,β) can be approximated using the second-order equation below:
To determine an optimal estimate for the learning rate and momentum, two cases are considered:
Case 1: A is Positive
If A is explicitly positive such that det(A)>0 (or greater than a small positive value) and , then the optimal values are given as follows:
Case 2: A is Non-Positive
In this case, it is not possible to define E(µ,β) in the vicinity of μ=0 and β=0 as a second-order approximation. Therefore, it is suggested to set β to null and consider
| [11] | Chen, Jian De Z.; Lin, Zhiyue; Wu, Qiang; Mc Callum, Richard W., (1995), Non-invasive identification of gastric contractions from surface electrogastrogram using backpropagation neural networks, Medical Engineering & Physics, 17, 3, 219-225. https://doi.org/10.1016/1350-4533(95)95713-K |
[11]
:
4. Model Results and Analysis
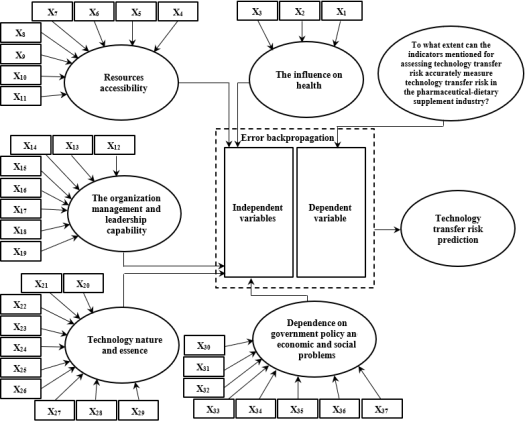
Based on the designed questionnaire, the 37 technology transfer risks influencing the pharmaceutical-nutritional supplement industry, categorized into 5 main groups, were used as inputs to the backpropagation algorithm. The average scores of the risks in each main group were calculated as the final scores of those groups. These 5 main groups were then considered as explanatory variables and inputted into the backpropagation algorithm. On the other hand, the score from the question regarding the overall ability of these risks to accurately measure technology transfer risk in the pharmaceutical-nutritional supplement industry was used as the dependent variable in the backpropagation algorithm.
To predict the likelihood of these risks occurring during the technology transfer process, the neural network was trained using the backpropagation method. The selection of appropriate training data is critical to the quality of neural network results. Insufficient diversity in the training data can cause the network to fall into local optima.
The computational results of the proposed neural network's training and testing process were implemented in MATLAB and were run on a system with a 2.27 GHz processor, 4 GB of RAM, and Windows 8. Common performance metrics were employed to evaluate how well the neural network learned the data correlations. For prediction problems, these metrics often focus on the error between predicted outputs and the actual desired outputs.
The table below shows some common performance metrics for prediction tasks. The first two metrics belong to the family of standard error computations. They include Mean Absolute Deviation (MAD), Root Mean Squared Error (RMSE), and the Coefficient of Determination (R²), which ranges from 0 to 1. An R² value of 1 indicates a perfect match between the predicted and actual data, while a value of 0 reflects performance equivalent to using the average actual output as the basis for predictions.
Since each evaluation metric assesses a specific aspect of network performance, all three metrics were used to evaluate the neural network's performance. The results of these evaluation metrics for test data, using the neural network, are summarized in the table below. This model was chosen as the best-performing option among other models reviewed.
The network architecture, after iterative training and error reduction, was optimized to (5-15-1), meaning 5 neurons in the input layer, 15 neurons in the hidden layer, and 1 neuron in the output layer.
Table 3. Values of Performance Evaluation Metrics for the Artificial Neural Network Method.
R2 | MAD | RMSEA | Prediction Method |
Testing | Training | Testing | Training | Testing | Training |
0.9883 | 0.9826 | 0.0677 | 0.0206 | 0.0780 | 0.0210 | Neural Network with Backpropagation Algorithm |
Based on the performance criteria used in the model, a feedforward neural network with a backpropagation algorithm was employed in this study. Initially, the data were randomized to eliminate any inherent order or pattern. As a result, the input and output sets were devoid of specific systematic arrangements. After this step, the amount of information to be utilized in the network training process was determined
| [13] | Farjamnia, I.; Naseri, M.; Ahmadi, S. M. (2007), Oil price forecasting using two methods: ARIMA and artificial neural networks. Iranian Economic Research Quarterly, 32, 161-182. |
[13]
.
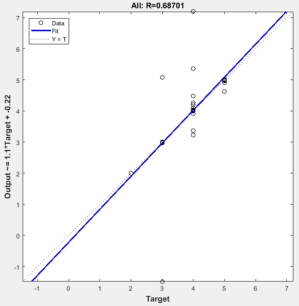
Table 4. Coefficient of Determination (R²) for Validating the Proposed Model.
Row | Training Algorithm | Number of Training Elements | Network Structure | R |
1 | levenberg-marquardt | 52 | 1-15-5 | 0.687 |
Figure 1. Coefficient of Determination for Validating the Proposed Model.
Based on this, a portion of the data is allocated for training, and another portion for testing the network. Most researchers select training and validation samples using one of the following rules: 90% vs. 10%, 80% vs. 20%, or 70% vs. 30%. The choice of these rules depends on the number of data points and the type of problem under study. Generally, the more training samples used, the better the network's performance in prediction. In this study, due to data limitations, 70% of the observations were used for training and 30% for validation.
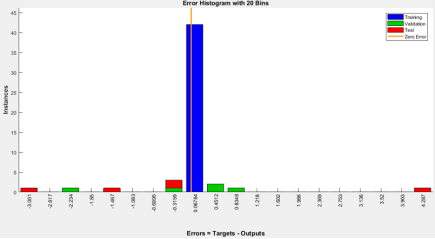
In this chart, the degree of association for each data category is analyzed against various error levels. The left side of the chart shows the minimum error values, while the right side displays the maximum error values. Considering the peak of the chart at the point 0.067, it indicates that the majority of the errors for all data are concentrated around 0.067, with most of the data belonging to the training set.
Furthermore, during the 20th iteration of the network, training was halted to prevent overfitting. At this iteration, the MSE (Mean Squared Error) for the training data was 16, while the MSE values for the test and validation datasets were 16 and 1.1109, respectively. These results are relatively ideal.
The validation of artificial neural networks is assessed using test data or cross-validation.
Figure 2. Frequency Chart of Error for Training Data, Validation Data, and Test Data.