This study aimed to evaluate the nectar secretion patterns and honey production potential of three plant species: Erythrina brucei, Ehretia cymosa, and Persea americana. To measure nectar volume and concentration, five inflorescences from different parts of each tree were enclosed in fine mesh bags one day prior to sampling. From these, fifty flowers per tree were randomly selected, and nectar volume was measured at one-hour intervals. The average nectar volume per flower over 24 hours, mean nectar concentration, and sugar content per flower per season, as well as per tree and honey yield per tree, were determined for each species. The results showed that E. brucei produced 9 µl of nectar per flower with 40.34% sugar concentration, amounting to 8.08 kg of sugar per flower/season and 9.85 kg per tree. E. cymosa produced 5.8 µl of nectar with 20% sugar, resulting in 5.8 kg per flower/season and 7 kg per tree. P. americana produced 4.37 µl of nectar with 24% sugar, totaling 9.1 kg per flower/season and 11 kg per tree. The actual harvestable honey was estimated at approximately half of the potential yield (895.5 kg/ha). Mean nectar volume and concentration varied significantly throughout the day, with temperature positively correlated with nectar concentration. Based on honey production potential, one hectare of productive trees can support the following number of colonies: E. brucei -127 (traditional), 59 (transitional), 33 (frame); E. cymosa -125, 58, 33; P. americana -212, 98, 55, respectively. Given their high nectar potential, these species can be used to produce honey wherever they are abundant. Therefore, propagation and in-situ conservation are recommended to ensure sustainable honey production and environmental conservation.
| Published in | Science Discovery Plants (Volume 1, Issue 1) |
| DOI | 10.11648/j.sdplants.20260101.17 |
| Page(s) | 62-71 |
| Creative Commons |
This is an Open Access article, distributed under the terms of the Creative Commons Attribution 4.0 International License (http://creativecommons.org/licenses/by/4.0/), which permits unrestricted use, distribution and reproduction in any medium or format, provided the original work is properly cited. |
| Copyright |
Copyright © The Author(s), 2026. Published by Science Publishing Group |
Nectar Secretion Dynamics, Honey Production Potential, Erythrina Brucei, Sugar Concentration
Plant species | Mean Number of branches per tree | Mean no of inflorescences per branch ± SE | Mean no of flower heads per inflorescence ± SE | Mean no of flower heads per tree ± SE |
|---|---|---|---|---|
E. brucei | 14.53±2.76 | 89.93±30.27 | 189.66± 37.46 | 260733.34±86683.02 |
E. cymosa | 14.68±2.05 | 108.0± 16.89 | 224.5 ±34.48 | 470959.81±204116.49 |
P. america | 15.6±2.98 | 344.42 ±55.23 | 254.38 ± 29.145 | 1071966.16±1143574.35 |
Plant species | Mean nectar volume (µl) | Mean nectar concentration (%) | Mean nectar secretion length (days) |
|---|---|---|---|
E. brucei | 9.0± 0.3 | 40.34± 1.22 | 6.98 ±0.46 |
E. cymosa | 5.88±0.17 | 20.038± 0.61 | 4.78±0.32 |
P. america | 4.37± 0.24 | 24.84± 0.97 | 5.1±0.3 |
Time (hour) | Average nectar concentration (%) + SE | Average nectar volume (µl) ± SE | Average sugar amount per flower/1hr intervals |
|---|---|---|---|
9:00 | 30.96c±0.69 | 10.6a ± 0.6 | 2.81a ± 0.48 |
10:00 | 41.52ab±0.78 | 9.83a± 0.6 | 4.46bc ± 0.42 |
11:00 | 39.7ab± 1.7 | 10.0a ± 0.58 | 6.56ab ± 0.41 |
12:00 | 44.1a ± 0.24 | 9.33a ± 0.21 | 3.0a ± 0.35 |
13:00 | 44.6a ± 0.36 | 7.67ab ± 0.43 | 3.87a±0.164 |
Time (hour) | Average nectar concentration (%) + SE | Average nectar volume (µl) ± SE | Average sugar amount per flower/1hr intervals |
|---|---|---|---|
10:00 | 21.17bc ± 1.13 | 5.27ab±0.33 | 2.3bc ± 0.38 |
11:00 | 23.02a ± 2.34 | 7.04a±0.87 | 2.94bc ± 0.45 |
12:00 | 22.55a ± 2.28 | 2.63bc±0.16 | 2.12bc ± 0.24 |
13:00 | 24.35a ± 1.18 | 3.18bc±0.35 | 1.75abc ± 0.47 |
Time (hour) | Average nectar concentration (%) + SE | Average nectar volume (µl) ± SE | Average sugar amount per flower/1hr intervals |
|---|---|---|---|
9:00 | 22.19c ± 0.73 | 2.9c±0.62 | 1.19c ± 0.09 |
10:00 | 26.2a± 0.7 | 3.93ab±0.53 | 3.7ab ± 0.64 |
11:00 | 28.27ab ± 1.54 | 4.18ab±0.55 | 1.59c ± 0.14 |
12:00 | 21.94c ± 0.57 | 6.81a±1.73 | 2.62a ± 0.25 |
13:00 | 26.2a ± 0.76 | 5.93bc±2.23 | 1.98c ± 0.26 |
14:00 | 23.38c ±0.48 | 8.62abc±1.52 | 5.4ab ± 1.03 |
TH | Traditional Hives |
IH | Intermediate Hives |
FH | Frame Hives |
| [1] | Addi, A., and T. Bareke. 2019. “Review: Floral Resources Diversity of Honeybees in Important Types of Vegetation of Ethiopia.” 3(2): 64-68. |
| [2] | Adgaba, N., A. Al-ghamdi, Y. Tadesse, A. Getachew, A. M. Awad, M. J. Ansari and A. S. Alqarni. 2017. “Nectar Secretion Dynamics and Honey Production Potentials of Some Major Honey Plants in Saudi Arabia. Saudi Journal of Biological Sciences 24(1): 180–191. |
| [3] | Adgaba, N., A. M. Awad, A. A. Al-Ghamdi, A. S. Alqarni, and S. E. Radloff. 2012. “Nektar Ziziphus spina-christi (L.) Willd (Rhamnaceae): Dynamika Nektarowania I Wydajność Miodowa.” Journal of ApiculturalScience 56(2): 49–59. |
| [4] | Adjaloo, M., A. Ankomah, K. Yeboah-Gyan, and B. Dzomeku. 2015. “Nectar Production Dynamics in Two Melliferous Plant Species.” Genetics and Plant Physiology 5(2): 145–161. |
| [5] | Afik, O., Dag, A., Kerem, Z. et al. Analyses of Avocado (Persea americana) Nectar Properties and their Perception by Honey bees (Apis mellifera). J Chem Ecol 32, 1949–1963 (2006). |
| [6] | Al-Ghamdi, A., N. Adgaba, A. Getachew, and Y. Tadesse. 2016. “New Approach for Determination of an Optimum Honeybee Colony’s Carrying Capacity Based on Productivity and Nectar Secretion Potential of Bee Forage Species.” Saudi Journal of Biological Sciences 23(1): 92–100. |
| [7] | Bareke, K. T., M. A. Addi, and H. Wakjira. 2014. “Evaluation of Propagation Methods of Schefflera abyssinica.” American Journal of Agriculture and Forestry 2(6): 278–283. |
| [8] | Bareke, T., and A. Addi. 2018. “Honeybee Flora Resources of Guji Zone, Ethiopia Honeybee Flora Resources of Guji Zone, Ethiopia.” Journal of Biology, Agriculture and Healthcare 8(21). |
| [9] | Bareke, T., and A. Addi. 2019. “Bee Flora Resources and Honey Production Calendar of Gera Forestin Ethiopia.” Asian Journal of Forestry 3(2): 69-74. |
| [10] | Bareke, T., T. Kumsa, K. Roba, and A. Addi. 2020. “Nectar Secretion Dynamics and Honey Production Potential of Croton macrostachyus L., Euphorbiaceae.” Bee World. |
| [11] | Beyene, T., D. Abi, G. Chalchissa and M. WoldaTsadik. 2015. Evaluation of Transitionaland Modern Hives for Honey Production in Mid RiftValley of Ethiopia. Global Journal of Animal Scientific Research. 3(1): 48-5. |
| [12] | Bolten, A. B., P. Feinsinger, H. G. Baker, and I. Baker. 1979. “On the calculation of sugar concentration in flower nectar. Oecologia 304: 301–304. |
| [13] |
Center for International Forestry Research. Erythrina brucei – Useful Trees and Shrubs of Ethiopia. World Agroforestry Centre; 2006. Available from:
https://apps.worldagroforestry.org/usefultrees/pdflib/Erythrina_brucei_ETH.pdf |
| [14] | Chaudhary, G. N. 2009. “The Economics of Honey Production in Alberta.” Crane, E., P. Walker, and R. Day. 1984. “Directory of Important World Honey Sources.” International Bee Research Association, London. pp. 384. |
| [15] | Crane, E. 1990. Bees and Beekeeping: Science, Practice and World Resources. London: Heinnmann Newness. |
| [16] | Dafni, A. 1992. book-Pollination Ecology, edited by B. D. Rickwood and D. Hames. Oxford University Press. APrcticalApprocachA.dafni55optimized.pdf |
| [17] | Farkas, Á., and Z. S. Orosz-Kovács. 2003. “Nectar Secretion Dynamics of Hungarian Local Pear Cultivars.” Plant. Syst. Evol. 238: 57-67. |
| [18] | Fichtl, R., and A. Adi. 1994. Honeybee Flora of Ethiopia. Margraf Verlag. Germany. 43-50. Jakobsen, H. B., and K. Kristjansson. 1994. “Influence of Temperature and Floret Age on Nectar Secretion in Trifolium repens L.” Annals of Botany. 74: 327-334. |
| [19] | Jakobsen, H. B., and K. Kristjansson. 1994. “Influence of Temperature and Floret Age on Nectar Secretion in Trifolium repens L.” Annals of Botany. 74: 327-334. |
| [20] | Kim, S. H., A. Lee, D. Kang, H. Y. Kwon, Y. Park, and M. S. Kim. 2017. “Análisis de Características de Néctar Floral de Espino Blanco Coreano y Chino (Crataegus pinnatifida Bunge).” Journal of Apicultural Research 57(1): 119–128. |
| [21] | Macukanovic, M., S. Duletic, and G. Jocic. 2004 “Nectar Production in Three Melliferous Species of Lamiaceae in Natural and Experimental Conditions.” Acta Vet. Beograd 54(5-6): 475- 487. |
| [22] | Masierowska, M. L. 2003. “Floral Nectaries and Nectar Production in Brown Mustard (Brassica juncea) and White Mustard (Sinapis alba) (Brassicaceae).” Plant Systematic and Evolution 238: 97–107. |
| [23] | Mohammed Bikamo Biramo and Demelash Bassa Belayneh, 2024. Beekeeping Calendar and Identification of Honeybee Floras for Honey Production in Different Agro-Ecologies of SNNPR, Ethiopia. International Journal of Botany, 20: 151-166. |
| [24] | Mulugeta, Y., T. Bekele, and E. Kelbessa. 2015. “Floristic Composition, Species Diversity and Vegetation Structure of Gera Moist Montane Forest, Jimma Zone of Oromia National Regional State, Southwest Ethiopia.” Ethiopian Journal of Biological Sciences 14(1): 45– 68. |
| [25] | Negash L. Erythrina brucei: propagation attributes, leaf nutrient concentration and impact on barley grain yield. Agroforestry Systems. 2002, 56: 39–46. |
| [26] | Pattrick, JG, Scott J, Wright GA. The concentration and energetic content of floral nectar sugars: calculation, conversions, and common confusions. Journal of Pollination Ecology. 2025; 38(11): 161–170. |
| [27] | Petanidou, T., and E. Smets. 1996. “Does Temperature Stress Induces Nectar Secretion in Mediterranean Plants?” New Phytol. 133: 513-518. |
| [28] | Prys-Jones, O. E., and S. A. Corbet. 1987. Bumblebees: Naturalists' Handbooks 6. The Richmond Publishing Co. Ltd, Slough. |
| [29] | Shenkute, A. G., D. Assefa, N. Adgaba, and W. A. Wodajo. 2012. “Honey Production Tropical Plants Database, Ken Fern. 2025-11-27. tropical.theferns.info/viewtropical.php?id=Erythrina+brucei |
APA Style
Beyi, M. W., Lema, T. B., Gemadi, D. A. (2026). Investigating Nectar Secretion Dynamics and Honey Production Potentials of Erythrina brucei, Ehretia cymosa and Persea americana. Science Discovery Plants, 1(1), 62-71. https://doi.org/10.11648/j.sdplants.20260101.17
ACS Style
Beyi, M. W.; Lema, T. B.; Gemadi, D. A. Investigating Nectar Secretion Dynamics and Honey Production Potentials of Erythrina brucei, Ehretia cymosa and Persea americana. Sci. Discov. Plants 2026, 1(1), 62-71. doi: 10.11648/j.sdplants.20260101.17
@article{10.11648/j.sdplants.20260101.17,
  author = {Mekonen Wolditsadik Beyi and Taye Beyene Lema and Desta Abi Gemadi},
  title = {Investigating Nectar Secretion Dynamics and Honey Production Potentials of Erythrina brucei, Ehretia cymosa and Persea americana},
  journal = {Science Discovery Plants},
  volume = {1},
  number = {1},
  pages = {62-71},
  doi = {10.11648/j.sdplants.20260101.17},
  url = {https://doi.org/10.11648/j.sdplants.20260101.17},
  eprint = {https://article.sciencepublishinggroup.com/pdf/10.11648.j.sdplants.20260101.17},
  abstract = {This study aimed to evaluate the nectar secretion patterns and honey production potential of three plant species: Erythrina brucei, Ehretia cymosa, and Persea americana. To measure nectar volume and concentration, five inflorescences from different parts of each tree were enclosed in fine mesh bags one day prior to sampling. From these, fifty flowers per tree were randomly selected, and nectar volume was measured at one-hour intervals. The average nectar volume per flower over 24 hours, mean nectar concentration, and sugar content per flower per season, as well as per tree and honey yield per tree, were determined for each species. The results showed that E. brucei produced 9 µl of nectar per flower with 40.34% sugar concentration, amounting to 8.08 kg of sugar per flower/season and 9.85 kg per tree. E. cymosa produced 5.8 µl of nectar with 20% sugar, resulting in 5.8 kg per flower/season and 7 kg per tree. P. americana produced 4.37 µl of nectar with 24% sugar, totaling 9.1 kg per flower/season and 11 kg per tree. The actual harvestable honey was estimated at approximately half of the potential yield (895.5 kg/ha). Mean nectar volume and concentration varied significantly throughout the day, with temperature positively correlated with nectar concentration. Based on honey production potential, one hectare of productive trees can support the following number of colonies: E. brucei -127 (traditional), 59 (transitional), 33 (frame); E. cymosa -125, 58, 33; P. americana -212, 98, 55, respectively. Given their high nectar potential, these species can be used to produce honey wherever they are abundant. Therefore, propagation and in-situ conservation are recommended to ensure sustainable honey production and environmental conservation.},
 year = {2026}
}
TY  - JOUR
T1  - Investigating Nectar Secretion Dynamics and Honey Production Potentials of Erythrina brucei, Ehretia cymosa and Persea americana
AU  - Mekonen Wolditsadik Beyi
AU  - Taye Beyene Lema
AU  - Desta Abi Gemadi
Y1  - 2026/03/19
PY  - 2026
N1  - https://doi.org/10.11648/j.sdplants.20260101.17
DO  - 10.11648/j.sdplants.20260101.17
T2  - Science Discovery Plants
JF  - Science Discovery Plants
JO  - Science Discovery Plants
SP  - 62
EP  - 71
PB  - Science Publishing Group
UR  - https://doi.org/10.11648/j.sdplants.20260101.17
AB  - This study aimed to evaluate the nectar secretion patterns and honey production potential of three plant species: Erythrina brucei, Ehretia cymosa, and Persea americana. To measure nectar volume and concentration, five inflorescences from different parts of each tree were enclosed in fine mesh bags one day prior to sampling. From these, fifty flowers per tree were randomly selected, and nectar volume was measured at one-hour intervals. The average nectar volume per flower over 24 hours, mean nectar concentration, and sugar content per flower per season, as well as per tree and honey yield per tree, were determined for each species. The results showed that E. brucei produced 9 µl of nectar per flower with 40.34% sugar concentration, amounting to 8.08 kg of sugar per flower/season and 9.85 kg per tree. E. cymosa produced 5.8 µl of nectar with 20% sugar, resulting in 5.8 kg per flower/season and 7 kg per tree. P. americana produced 4.37 µl of nectar with 24% sugar, totaling 9.1 kg per flower/season and 11 kg per tree. The actual harvestable honey was estimated at approximately half of the potential yield (895.5 kg/ha). Mean nectar volume and concentration varied significantly throughout the day, with temperature positively correlated with nectar concentration. Based on honey production potential, one hectare of productive trees can support the following number of colonies: E. brucei -127 (traditional), 59 (transitional), 33 (frame); E. cymosa -125, 58, 33; P. americana -212, 98, 55, respectively. Given their high nectar potential, these species can be used to produce honey wherever they are abundant. Therefore, propagation and in-situ conservation are recommended to ensure sustainable honey production and environmental conservation.
VL  - 1
IS  - 1
ER  -
Oromia Agricultural Research Institute (IQQO), Adami Tulu Agricultural Research Center, Batu, Ethiopia
Oromia Agricultural Research Institute (IQQO), Adami Tulu Agricultural Research Center, Batu, Ethiopia
Oromia Agricultural Research Institute (IQQO), Adami Tulu Agricultural Research Center, Batu, Ethiopia
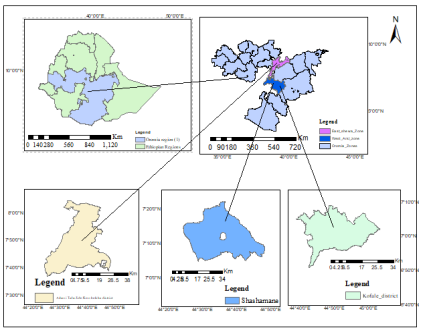
Figure 1. Map of study area.
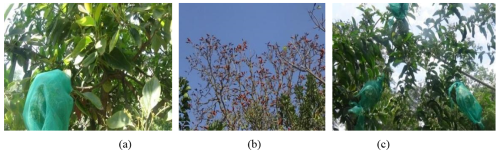
Figure 2. Flowers of E. brucei (b), E. cymosa (c) and P. Americana (a).
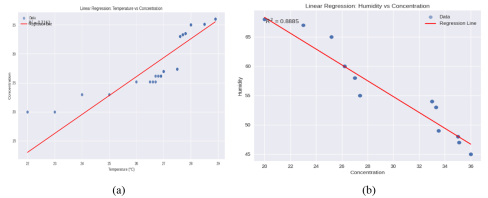
Figure 3. Effects of temperature on nectar concentration (a), Humidity (b) P. americana.
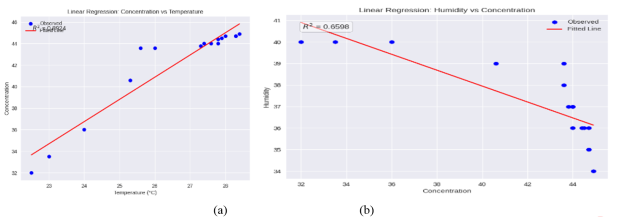
Figure 4. Effect of temperature on nectar concentrations (a) and Humidity (b) of E. brucei.
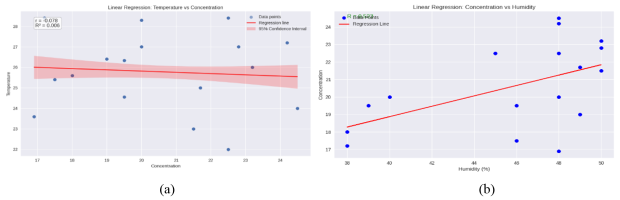
Figure 5. Effect of temperature on nectar concentrations (a) and Humidity (b) E. cymosa.
Information

