Abstract
Agriculture not only provides food for the human existence, it is also a big source for the economy of any country. Pests damage the crops and, thus, are very dangerous for the overall growth of the crop. In this proposed system sorghum leaf image was given as an input and for noise removal median filtering algorithm is used then the background subtraction takes place using Otsu thresholding algorithm. Then, at the end of image processing step extract and calculate three types of feature color, texture and morphological features for the segmented foreground leaf image. After feature selection algorithm is implemented, six color, five texture and ten morphological features are extracted from each sorghum plant leaf image and combined to get dataset which is used to develop the model, though model attempts with separate features were conducted in experiment. Finally, these extracted features are feed in to the classifier for the classification, K-Nearest Neighbor, Support Vector Machine and Artificial Neural Network implemented for classification purposes. In general the overall experimental result shows that the developed Artificial Neural Network model with a combination of three features namely color, texture and morphological features achieved a better result with an accuracy of 90%.
|
Published in
|
Science Discovery Computers (Volume 1, Issue 2)
|
|
DOI
|
10.11648/j.sdcomput.20260102.11
|
|
Page(s)
|
69-79 |
|
Creative Commons
|

This is an Open Access article, distributed under the terms of the Creative Commons Attribution 4.0 International License (http://creativecommons.org/licenses/by/4.0/), which permits unrestricted use, distribution and reproduction in any medium or format, provided the original work is properly cited.
|
|
Copyright
|
Copyright © The Author(s), 2026. Published by Science Publishing Group
|
Keywords
Sorghum Plant, Artificial Neural Network, Pest Detection, K-Nearest Neighboring
1. Introduction
1.1. Background
Ethiopia is a country of large biodiversity and agricultural complexity. As in many developing countries, agriculture plays a key role in Ethiopia’s economy. Millions of dollars are being spent to safeguard the crops annually
| [1] | S. G. K. K. S. V. a. S. R. R. S. R. Huddar, “Novel algorithm for segmen-tation and automatic identification of pests on plants using image processing”, 2012 3rd International Conference on Computing, Communication and Networki, nologies, ICCCNT 2012, no. July, 2012.
https://doi.org/10.1109/ICCCNT.2012.6396012 |
[1]
. It provides employment for more than 80% of the population and contributes to nearly 50% of gross domestic product
. However, the cultivation of crops for optimum yield and quality produce is highly essential. Research in agriculture is aimed towards increase of productivity and food quality at reduced expenditure and with increased profit, which has received importance in recent time. In Ethiopia, sorghum is a major staple food crop, ranking second after maize in total production
| [3] | Z. A. A. K. a. B. G. Tsehaye, “Dynamic Sorghum (Sorghum Bicolor (L.) Moench) diversity Management in Situ and Livelihood Resilience in South and Central Tigray Region, Ethiopia”, Momona Ethiopian Journal of Science, vol. 1, no. 2, pp. 67-94, 2009,
https://doi.org/10.4314/mejs.v1i2.46049 |
[3]
. It ranks third after wheat and maize in productivity per hectare, and after Teff and maize in area cultivated. It is grown in almost all regions, covering a total land area of 1.8 million production
| [3] | Z. A. A. K. a. B. G. Tsehaye, “Dynamic Sorghum (Sorghum Bicolor (L.) Moench) diversity Management in Situ and Livelihood Resilience in South and Central Tigray Region, Ethiopia”, Momona Ethiopian Journal of Science, vol. 1, no. 2, pp. 67-94, 2009,
https://doi.org/10.4314/mejs.v1i2.46049 |
[3]
. Sorghum is considered as one of the potential crop to alleviate the challenges of recurrent drought in Ethiopia. Tigray is known for its rich sorghum genetic diversity. Despite its huge potential in the region, sorghum productivity is well below the average production
| [3] | Z. A. A. K. a. B. G. Tsehaye, “Dynamic Sorghum (Sorghum Bicolor (L.) Moench) diversity Management in Situ and Livelihood Resilience in South and Central Tigray Region, Ethiopia”, Momona Ethiopian Journal of Science, vol. 1, no. 2, pp. 67-94, 2009,
https://doi.org/10.4314/mejs.v1i2.46049 |
[3]
. The major sorghum plant pests were stalk borer, armyworm, bollworm, grasshoppers, sorghum chaffer, and shoot fly and storage weevils production
| [3] | Z. A. A. K. a. B. G. Tsehaye, “Dynamic Sorghum (Sorghum Bicolor (L.) Moench) diversity Management in Situ and Livelihood Resilience in South and Central Tigray Region, Ethiopia”, Momona Ethiopian Journal of Science, vol. 1, no. 2, pp. 67-94, 2009,
https://doi.org/10.4314/mejs.v1i2.46049 |
[3]
. In fact, in production conditions, staff periodically observes plants and search for pests. This manual method is very time consuming. With the recent advancement in image processing techniques, it is possible to develop an autonomous system for disease/pest classification of crops
(S. Umaa Mageswari 2013) There are different crops which are cultivated in Tigray e.g. maize, wheat, barley and sorghum etc. stalk borer, armyworm, bollworm, grasshoppers, sorghum chaffer, shoot fly and storage weevils are pests which attack on these crops. The only way to stop the effect of these pests is pesticides. But excess use of the pesticides is very harmful to the crops, soil, air, water resources and the animals which came in contact with the pesticides. Pesticide residues have also been found in rain and groundwater.
The aims of this study were (i) To capture relevant sorghum plant images both infected by pests and healthy from different areas of the region, (ii) To develop automatic pest detection algorithm using image processing, (iii) To integrate the image processing and machine learning components for realization of the model. Important for the classifiers, (IV) to design the optimal classifier for sorghum plant pest detection.
1.2. Problem Statement
All role in it that can address this problem by improving and increasing the quality and quantity of production by making farms more intelligent and more connected through the precision agriculture
| [5] | M. Krishnan and G Jabert, “Pest Control in Agricultural Plantations Using Image Processing”, vol. 6, no. 4, pp. 68–74, 2013. |
[5]
. Currently in Ethiopia, there is a problem of threat of pest and disease incidence in sorghum crops. Traditional method of examination of the fields is naked eye examination but it is very difficult to have a detailed examination in large fields. To examine the whole field, many human experts are needed which is very expensive, time consuming and less efficient.
The aim of this study is therefore to investigate the possibility of designing an automated early pest detection using machine learning algorithm in the image domain. To this end, this study attempts to explore and answer the following research questions.
1) Which image preprocessing techniques, such as noise removal and edge detection techniques are effective in extracting the features of sorghum plant image?
2) Our system uses images of plant infected by pests and healthy plant images taken in-place, and analyzing them in the laboratory and to what extent the prototype works in pest identification?
3) Which classification algorithm is effective for detecting pests?
1.3. Objectives
1.3.1. General Objective
The general objective of this research is to design an intelligent image processing model for early pest detection in Sorghum crop plantations: The case of southern Tigrai1.
1.3.2. Specific Objectives
The specific objective of this research includes: -
o capture relevant sorghum plant images both infected by pests and healthy from different areas of the region.
1) To develop automatic pest detection algorithm using image processing.
2) Examining the crops to detect pest infestation and Classifying the type of pests on crops.
3) To integrate the image processing and machine learning components for realization of the model.
4) To design the optimal classifier for sorghum plant pest detection.
1.4. Scope of the Study
The main intent of this study is to assess pests in sorghum and to provide an automatic detection algorithm for those threat incidences and this facilitates improving and increasing the quality and quantity of production by making farms more intelligent. There are about 7 sorghum diseases/pests registered pests in the area
. Since it’s very difficult to develop and acquire a model for all the pests, due to the limited resource, time and cost. We have selected two main diseases/pests depending on the level of destructiveness; disease symptoms (on the leaf), information availability and the disease/pests existence and the amount of distribution in the area.
1.5. Significance of the Study
This action research tried to add one input by adding new feature of learning style for the computing college. Directly or indirectly, the whole college student, instructors and other supporting bodies are beneficiary from this research. Particularly, second year students and top scorer senior students are directly benefited from this action research. By the help of this study, second year student who are joined college of computing and informatics for the first time they can able to improve their programming skill with the help of senior students and the researchers.
2. Literature Review
2.1. Overview
The application of Information and Communication Technology (ICT) has been increasingly implemented as a solution to improve and support different sectors such as health, agriculture, government and education.
2.2. Review of Related Works
Global research works
A number of authors have developed plant pest detection and diagnosis system with different ways. In line with this, many proposed works the authors came up with by varying the techniques and approaches that used in both for image processing steps and classification.
Rupesh G. Mundada
| [6] | R. G. Mundada and V. V. Gohokar, “Detection and Classification of Pests in Greenhouse Using Image Processing”, vol. 5, no. 6, pp. 57-63, 2013. |
[6]
et. al proposed a system for early pest detection. In this, feature extrac-tion was done with the help of Support Vector Machines (SVM’s). SVM is a supervised learning method. SVM classification first finds a hyper plane which separates the d-dimensional data per-fectly into two classes. This is done by maximizing the margin from the hyperplane. Hyper plane is defined as, Yi = <w. x> + c (1) Where w is n-dim vector and c is a constant or scalar. By adding a scalar value c it increases the margin between hyper planes and in the absence of c, hyper plane is forced to pass through the origin. Multiclass classification is also recommended and used two class SVMs to solve the problem 1) one-versus-all or one 2) kernel function. A common disadvantage of non-parametric techniques such as SVMs is the lack of transparency of results and Mundada have proposed a system to detect white flies, aphids and trips on the infected crops in greenhouse.
Images of the infected cotton leaf are captured by a camera and pre-processed by converting these images from RGB to gray scales and filtering in order to obtain an enhanced image set of pests. Properties such as region properties and gray covariance matrix properties such as entropy, mean, standard deviation, contrast, energy, correlation and eccentricity were extracted from these images. The classification was performed by the use of support vector machines. Proposed system is used for rapid detection of pests.
Ganesh Bhadane
| [7] | S. S. a. V. B. N. G. Bhadane, “Early Pest Identification in Agricultural Crops using Image Processing Techniques”, vol. Bhadane201, 2013. |
[7]
et. al describes a software prototype system for pest detection on the infected images of different leaves. Images of the infected leaf are captured by digital camera and processed using image growing, image segmentation techniques to detect infected parts of the particular plants. Then the detected part is been processed for further feature extraction which gives general idea about pests. Object extraction is done by background subtraction. Thresholding is used for background subtraction. Then segmentation is used to partition the image in to multiple regions.
For this particular type of edge detection sobel operator is used. The drawback of this system is that if the color of pest and leaf is almost similar then the background subtraction method cannot identify the pest. The color change on the leaf is also identifying as pest. The accuracy of pest identification depends on the selection of threshold value.
3. Materials and Methods
3.1. Description of the Study Area
The study was conducted in Maichew, raya azebo, which is located in the southern part of Tigray.
3.2. Data Collection and Measurements
In the road within this research, we collect data through agreement with the experts in the organization and with some farmers through interviewing them of what types of pests are there in the field. Both healthy as well as infected sorghum plant pest images are collected from two area of the region namely maichew and raya azebo. There are many pests which commonly attacks sorghum plants such as Ageda korkur, Temch, Guay til, Fentara/Anbeta, Zinzina, Bileh and others. Healthy as well as infected sorghum plant images are collected from the area of the region namely raya azebo, Machew to train and test the system. Around 1500 sorghum leaf images are collected.
Interview Questions Asked to Farmers and the Experts:
1) What are the pests always happened in the region?
2) What are the most destructive pests that exist in the area?
3) What treatments are used when pests exists?
4) Which part of the crops attacked more?
Table 1. Pests that attack sorghum plant.
Local name of pest | Common name |
Ageda korkur | Stalk borer |
Temch | Armyworm |
Guay Til | Bollworm |
Fantara/Anbeta | Grasshopper |
ye ehil kimal | Aphids |
3.3. Methodology
a) Image acquisition
Image acquisition is the process of obtaining a digital image of object in real world using camera or scanner. During the acquisition process of each image, we may introduce random changes into the values of pixels in the image which is called noise
| [8] | T. Seemann, Digital image processing using local segmentation. Monash University, 2002. |
[8]
(T. Seemann 2002). Atmosphere degradation, motion of image or camera, distance between camera lens and image are some of the causes for pixel values changes in image acquisition
| [8] | T. Seemann, Digital image processing using local segmentation. Monash University, 2002. |
[8]
(T. Seemann 2002). For the process of Image Processing, Image Acquisition is an important framework as without an image no processing can be done. The image can be extracted and used for further processing.
b) Image Preprocessing
Image pre-processing creates an enhanced image that is more useful in processing the still image. In RGB color model, each color appears in its primary spectral components of red, green, and blue. The color of a pixel is made up of three components; red, green, and blue (RGB), described by their corresponding intensities. RGB color image require large space to store and consume much time to process. In image processing it needs to process the three different channels so it consumes large time. Preprocessing stage includes collection of operations that are applied for successive transformations of image. These are color image to gray scale conversion, noise removal, boundary enhancement and edge detection
| [9] | Y. Chen and X. Zhou, “Plant root image processing and analysis based on 2D scanner”, roceedings 2010 IEEE 5th International Conference on Bio-Inspired Computing: Theo-ries and Applications, BIC-TA 2010, pp. 1216-1220, 2010.
https://doi.org/10.1109/BICTA.2010.5645146 |
[9]
(Y. Chen and X. Zhou 2010). The details of each preprocessing stage operations are discussed in the following section: Color Image to Gray Image Conversion Color Images require large scale storage and processing time during preprocessing. Each pixel’s information in the color image consists of the intensities of three components namely: Red, Green and Blue (RGB). That is why it requires three channels to process during any process on the images. Therefore, images are converted into gray scale images so that they can be handled easily and require less storage. Gray scale image pixel values range from 0 to 255. The conversion process of color image to gray scale is done using a Matlab function which is called rgb2gray () and it works by forming a weighted sum of the R, G, and B components; as shown in equation (
1) below.
Gray=0.2989∗R+0.5870∗G+0.1140∗B(1)
The information retained by gray scale image is enough for our method. So we convert RGB image to gray scale image for image processing. Noise Removal/Filtering: Filtering in image processing is a process that cleans up appearances and allows for selective highlighting of specific information. Noise occurs due to the random changes into the values of pixels in the image
| [8] | T. Seemann, Digital image processing using local segmentation. Monash University, 2002. |
[8]
. In digital images we may face a variety of noises types. The most common types of noises are Impulsive noise (thermal noise), Additive noise (Gaussian Noise) and Multiplicative noise (salt and pepper noise). A number of techniques are available and the best options can depend on the image and how it will be used. Both analog and digital image processing may require filtering to yield a usable and attractive end result. During the pre-processing, the image is enhanced so that pests on leaves can only be focused. Low frequency background noise is removed during the filtering process. Average and median filters are applied on the images. In this study we use median filter technique. Median filter looks at its nearby neighbor’s pixel values to decide whether or not it is representative of its surrounding pixels and replaces with the median of those values. The median filter takes an area of an image as per filtering window defined (3x3, 5x5, 7x7, etc.), sorts out all the pixel values in that area, and replaces the center pixel with the median value. If the image contains an even number of pixels, the average of the two middle pixel values is used.
c) Feature Extraction
Feature Extraction Feature extraction is the process of retrieving relevant information that can characterizes an image. It can also be defined as the process of distinguishing the primitive characteristics or attributes of an image. One of the key concepts in image analysis is the extraction of sufficient information which leads to describe the type and nature of image
. In the process of images feature extraction, the retrieved information is in the form feature vectors. These feature vectors have an observable impact on efficiency during identification since identifiers use these vectors to identify the input image with target output unit
| [10] | G. Kumar and P. K. Bhatia, “A detailed review of feature extraction in image processing systems”, International Conference on Advanced Computing and Communication Technolo-gies, ACCT, no. FEBRUARY 2014, pp. 5-12, 2014, https://doi.org/10.1109/ACCT.2014.74 |
| [11] | M. Habtamu, “Image analysis for Ethiopian coffee classification”, PhD thesis, MSc Thesis, Addis Ababa University, School of Graduate Studies, 2008. |
[10, 11]
. According to Kumar
| [10] | G. Kumar and P. K. Bhatia, “A detailed review of feature extraction in image processing systems”, International Conference on Advanced Computing and Communication Technolo-gies, ACCT, no. FEBRUARY 2014, pp. 5-12, 2014, https://doi.org/10.1109/ACCT.2014.74 |
[10]
different features are associated with different feature extraction methods such as Template matching, Deformable templates, Graph description, Projection Histograms, Contour profiles, Fourier descriptors, Gradient feature and Gabor features. In order to simplify the process of image analysis and reduce time consumption of feature extraction methods, some quantitative information can be extracted from the objects region of interests so that the computational cost of object analysis is greatly reduced. For object identification or detection, the features should have sufficient information of the object in the image and any irrelevant information should be reduced to avoid redundant knowledge from the extraction and to the identifier. Identification with large information is computationally intensive so that information should be easy to compute
| [12] | Y. Chen and X. Zhou, “Plant root image processing and analysis based on 2D scanner”, Proceedings 2010 IEEE 5th International Conference on Bio-Inspired Computing: Theories and Applications, BIC-TA 2010, pp. 1216–1220, 2010.
https://doi.org/10.1109/BICTA.2010.5645146 |
| [13] | R. M. Haralick, “Statistical and structural approaches to texture”, Proceedings of the IEEE, vol. 67, no. 5, pp. 786–804, 1979, https://doi.org/10.1109/PROC.1979.11328 |
[12, 13]
. A color space is a mathematical representation of a set of colors. There are different color spaces: RGB, HSV (Hue Saturation Value), HSI (Hue Saturation 2.6. Classification 17 Intensity), HSB (Hue Saturation Brightness), YCbCr (luminance and chrominance), etc. and each of color model have their own advantage and disadvantage. In most cases both the term HSI, HSV and HSB it’s used interchangeably with similar fashion but a little bit difference appear in each of color spaces in Intensity, Value and Brightness of the color value. RGB color is the most dominant and default type of representation of color due to the importance on the real world applications like television and camera. Color has been successfully applied to recognize images, because it has very strong correlations with the underlying objects in an image. Most of the time because of the non-uniformity of RGB color space we need to convert them to the suitable color space. RGB is not suited for describing colors in ways that are practical for human interpretation (not applicable in percentage explanation of each RGB channel). The non-uniformity of RGB color model is eliminated by changing it to HSI or HSV color model. Texture feature is suitable for visualizing pattern and surface properties. It provides information about intensity variation of an image surface. Energy, contrast, entropy, homogeneity, correlation are some of the texture features used in image identification. Some of the methods of texture feature extraction are Gray level Co-occurrence Matrix (GLCM), Gabor filter, Wavelet transform, Principal Component Analysis (PCA) etc. GCLM also known as Spatial Gray level Dependence Matrix (SGDM), is a very powerful texture feature extractor proposed by
| [14] | Arun Kanti Manna, “Image Processing With Sampling and Noise Filtration in Image Recognition Process”, International Journal of Engineering Inventions (IJEI), vol. 03, no. 7, pp. 35–47, 2014. [Online]. Available:
http://www.ijeijournal.com/papers/Vol.3-Iss.7/F0373547.pdf |
| [15] | D. Al Bashish, M. Braik, and S. Bani-Ahmad, “Detection and classification of leaf diseases using K-means-based segmentation and neural-networks-based classification”, Information Technology Journal, vol. 10, no. 2, pp. 267–275, 2011.
https://doi.org/10.3923/itj.2011.267.275 |
[14, 15]
where fourteen features are extracted used to measure the probability of distribution of pixel in a given gray level image. GLCM is a statistical method that examining spatial relationships with pixels. Morphology, color and texture are the recommended features for crop identification using image analysis.
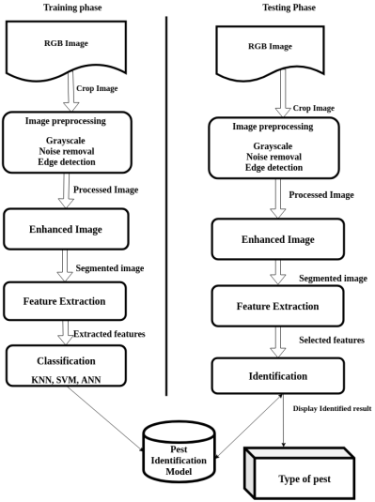
3.4. Design of Early Pest Detection Model
This research work is concerned with designing early pest image identification model for sorghum crop plantations in case of southern Tigray. The details of these steps, main focuses of this study, are depicted in
Figure 1 below.
Figure 1. The General Architecture of Early Pest Detection Model.
4. Results and Discussion
4.1. Results
Once the model is developed an experiment is conducted to evaluate its performance in the identification of plant pest images. To this end, experiments are conducted for each classifier using morphology, color, texture features and the combination of each where the combination is done using Forward Feature Selection (FFS) method which creates a combined feature set by adding a candidate set sequentially starting from an empty set until the addition of further features does not decrease the performance. In each experiment the classification algorithms; MLP, KNN and SVM are used so as to select the best performer for identification of pest images. In this study, first we extracted 10 morphological, 5 textural and 6 color features from the segmented pest image and then FFS method is applied for feature set selection during combination. We have computed the entire possible feature set by combining each of the three features except combining color and morphology. After we have computed the combined features, the selected dimensional space of the feature vectors of the data sets is used for experiment. In this classification approaches we evaluate the performance of the classifier by measuring the accuracy. An experiment is conducted in case of classification and features selection; color, texture, morphological and a combination of each other and selecting the best classifier model among KNN, SVM and ANN. In both cases we use the same training and testing dataset in the processes of building classification the model run separately for color, texture, morphological, texture and morphology, and combination of all. Three predicated class for outputs were used and ones the predication models build successfully measure the performance of each classifier will be the next work. In this experiment our aim is to classify the testing datasets based on the predication model. The percentage accuracy of identification performance of the model is defined as the ratio of correctly classified sorghum leaf sample images to the total number of sample leaf images. The measure of success of classification is done by using the classification accuracy.
Equation (
1) indicates mathematical equation used to measure the accuracy of the model.
Accuracy (%) = Totalnumberoftestingleafimages∗100 (2)
number of correctly classified testing leaf image
Errorrate(%) = 1− Totalnumberoftestingleafimage∗100(3)
Totalnumberoftestingleaf images
Another important tool for analyzing the performance of the model is confusion matrix for summarizing and describes the performance of a classification algorithm and its gives a better idea of what the classification model is getting right and what types of errors it is making. From the total dataset 20% is for testing
Table 1 gives description of the number of testing dataset in each class of the leaf image and test data for which the true values are known.
Table 1. Number of Testing Dataset of Sorghum Leaf Image.
Number of Class Types of Disease | Number of Captured RGB image sample |
0 Armyworms | 100 |
1 Aphids | 100 |
2 Healthy Leaf image | 100 |
Total | 300 |
4.1.1. Artificial Neural Network Classifier
The first classification algorithm for constructing sorghum plant pest identification model is artificial neural network. The parameters used for the classifier with their value are depicted in
Table 2 below.
Table 2. Parameters used for ANN classifiers.
Parameters | Values |
Number of hidden layers | 2 |
Network type | Feed forward with back propagation |
Number of neuron in hidden layer | 10 |
Activation function | Sigmoid function |
Algorithm | Multi-layer perceptron n function |
Initial weight | 1 |
Initial bias | 1 |
The features extracted, from sorghum plant images, using the feature extraction techniques discussed so far are then fed to the artificial neural network classifier to measure the accuracy for each technique. The accuracy of each technique is then measured, by dividing Number of correctly classified testing leaf image to the total number of testing leaf images, depicted in
Table 3 below. A confusion matrix for the combination of all features (morphology, texture and color features) using ANN: In this experiment, our neural network model used 21 (combination of morphological, textures and color) features. Hence, the neural network model has 21 inputs, 10 hidden and 3 output units (21: 10: 3) where input units are equal to the number of features and the outputs are the number of class. The results achieved during experimentation are summarized and shown in
Table 3 below.
As can be seen from
Table 4 combined feature set of morphology, texture and color registered better results than the other feature set with an accuracy of 90%. From this experimental result we have observed that using the combined features as the input of the neural network model showed relatively better discrimination result than using individual features. As illustrated from
Table 3. The confusion matrix indicates the correctly classified and misclassified testing data. The result shows that artificial neural network classifier using all features means color, texture and morphological gives correctly classified 270 leaf images out of 300 sampled testing dataset it counts 90% from the total datasets and the remaining 10% were misclassified.
Table 3. Experimental Result of ANN Classification Model.
Extracted Feature Classified Misclassified | Performance |
Color 170 130 | 56.6% |
Texture 160 140 | 53.3% |
Morphological 240 60 | 80% |
Morphology&texture 250 50 | 83.3% |
Color+ Texture 250 50 | 83.3% |
Morphology +Color +text 270 30 | 90% |
Table 4. Confusion Matrix of ANN Classification Using All Features.
Actual Class Predicted Class | 0 | 1 | 2 | Total |
Correct (%) | Incorrect (%) |
0 | 80 | 10 | 0 | 88.8% | 11.2% |
1 | 20 | 90 | 0 | 81.8% | 18.2 |
2 | 0 | 0 | 100 | 100% | 0 |
Total | Correct (%) | 80% | 90% | 100% | 90% 10% |
Incorrect (%) | 20% | 10% | 0 |
4.1.2. K-Nearest Neighbor Classification
In the case of K-nearest neighbor classification, the training data set which is used by neural network so far, both the input and their target variables are used to build the model. And then the class of the test data, which contain only the input variables, is determine by comparing the distance of the unknown tuple to K nearest neighbors of that reference model. Based on the experimental results summarized in
Table 6 the combined feature sets of morphology, texture and color features registered better results than the other feature set with an accuracy of 83.3%. From this experimental result we have observed that using the combined features, so as to discriminate between sorghum plant pests, using KNN classifier showed relatively better discrimination result than using individual features separately. Based on the above matrix the result indicates KNN with all feature estimate 83.3% high classification result and on the reverse 16.7% is misclassified which means from the total 300 testing dataset 250 leaf images are predicted successfully. The result of this matrix shows a high misclassification score 20% on Aphids and high classification accuracy on armyworms scores 88.8%.
Table 5. Experimental Result of KNN Classification Model.
Extracted Feature Classified Misclassified | Performance |
Color 220 80 | 73.3% |
Texture 220 80 | 73.3% |
Morphological 210 90 | 70% |
Morphology&texture 230 70 | 76.6% |
Color+ Texture 230 70 | 76.6% |
All 250 50 | 83.3% |
Table 6. Confusion Matrix of KNN Classification Using All Features.
Actual Class Predicted Class | 0 | 1 | 2 | Total |
Correct (%) | Incorrect (%) |
0 | 80 | 10 | 0 | 88.8% | 11.2% |
1 | 10 | 80 | 10 | 80% | 20% |
2 | 10 | 10 | 90 | 81.8% | 18.2% |
Total | Correct (%) | 80% | 80% | 90% | 83.3% 16.7% |
Incorrect (%) | 20% | 20% | 10% |
4.1.3. Support Vector Machine Classification Model
In this experimental analysis we used multiclass model support vector machine which is known as error correcting output code approaches based on one versus one technique.
Table 7. Experimental Result of SVM Classification Model.
Extracted Feature Classified Misclassified | Performance |
Color 200 100 | 66.6% |
Texture 200 100 | 66.6% |
Morphological 160 140 | 53.3% |
Morphology&texture 210 90 | 70% |
Color+ Texture 220 80 | 73.3% |
Morphology +Color + 230 70 | 76.6% |
Table 8. Confusion Matrix of SVM Classification Using All Features.
Actual Class Predicted Class 0 1 2 Total Correct (%) Incorrect (%) | 0 | 1 | 2 | Total |
Correct (%) | Incorrect (%) |
0 | 70 | 10 | 0 | 87.5% | 12.5% |
1 | 20 | 80 | 20 | 66.6% | 33.4% |
2 | 10 | 10 | 80 | 80% | 20% |
Total | Correct (%) | 70% | 80% | 80% | 76.6% 23.4% |
Incorrect (%) | 30% | 20% | 20% |
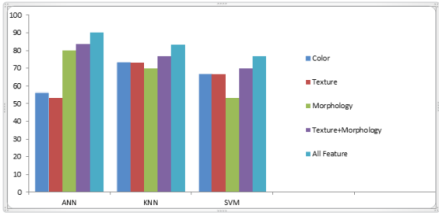
From the above experimental result SVM classifier using all features gives correctly classified 230 leaf images out of 300 sampled testing dataset it counts 76.6% from the total datasets and the remaining 23.4% were misclassified. From this experiment a high misclassification is 33.4% on aphids. In general according to the above matrixes the result clearly shows that ANN model is capable of classifying the pests better than KNN and SVM. The following chart explains the comparison of three classification model results obtained by sorghum leaf with correctly classified testing dataset.
Figure 2. Summary of All Classification Model Accuracy Performance.
4.2. Discussion of the Results
In this work, we tried to show different classification models with different type features. From the above experimental analysis we used to determined different features using three classifiers; KNN, SVM, ANN and from this classifier it is found that morphology and a combination of all features gave very important result. In this study, during experimentation combined features in the ANN model have been found to work very well in identification of sorghum plant pests. According to the three classification models the lowest result is found in the SVM because this classifier is the best fit in two classes in the case of multiclass classification it is not capable of classifying the classes therefore it needs a better works on this area. In line with this SVM the slower learner comparing with KNN and ANN. Based on the above three classification model experiment’s 90% is obtained using ANN classifier which is considered as encouraging and promising result. Confusion or errors occurred in the test result of the developed identification model can be either segmentation error or identification error. Segmentation error is an error that occurred due to the segmentation algorithm while identification error is occurred due to morphological, color and textural similarities (similarities occurred due to weather condition, soil type) between the input sorghum plant image and its identification result. Furthermore, the algorithm which has been used for noise removal in our experiment is not capable to remove noise for highly blurred and shadowed plant image. This requires an advanced noise removal algorithms that are effective in detecting blurring and shadow in sorghum plant images before applying segmentation, feature extraction and classification techniques.
As we have presented the detail in the previous sections, the experiments were conducted under five situations by using feature sets of texture, morphology and color separately, combining texture with morphology and then all color, morphology and texture following Forward Feature Selection method. Accordingly, experimental results show that morphological feature has the largest discriminating power with neural network while texture and color is better with nearest neighbor and support vector machine.
5. Conclusion and Recommendation
5.1. Conclusion
In Ethiopia, sorghum is a major staple food crop, ranking second after maize in total production. It is grown in almost all regions, covering a total land area of 1.8 million. This study proposed an intelligent sorghum plant pest detection system designed for agricultural applications in order to improve the productivity of plant during growing time by early detecting one of the main constraints which is pests by using image processing techniques. We design and implement different tech-niques for each process of image processing and classification algorithms. There are two infected and healthy sorghum leaf with a total of three types of leafs are taken for experimentation. The list features then taken into account and we build a dataset for each of three classifier; KNN, SVM and ANN. The dataset is partitioned in to training and testing. The classifier is trained by using the training dataset until the optimal classification model is found. We explored the individual performance of color, shape and texture features is analyzed. It is found that newly proposed system texture; color and shape features alone are not able to improve the performance of proposed system classification. If these features are combined one with another, there is significant improvement in the classification result. Finally, based on the finding of this study the performance of the system has been tested with testing datasets for three classification setup based on the different types of feature. The overall performance results are 83.3%, 76.6% and 90% for KNN, SVM and ANN respectively with a combination of color, texture and morphological features. In general this study gives a promising result in the detection of sorghum plant pests. In Ethiopia, sorghum is a major staple food crop, ranking second after maize in total production. It is grown in almost all regions, covering a total land area of 1.8 million. This study proposed an intelligent sorghum plant pest detection system designed for agricultural applications in order to improve the productivity of plant during growing time by early detecting one of the main constraints which is pests by using image processing techniques. We design and implement different techniques for each process of image processing and classification algorithms. There are two infected and healthy sorghum leaf with a total of three types of leafs are taken for experimentation. The list features then taken into account and we build a dataset for each of three classifier; KNN, SVM and ANN. The dataset is partitioned in to training and testing. The classifier is trained by using the training dataset until the optimal classification model is found. We explored the individual performance of color, shape and texture features is analyzed. It is found that newly proposed system texture; color and shape features alone are not able to improve the performance of proposed system classification. If these features are combined one with another, there is significant improvement in the classification result. Finally, based on the finding of this study the performance of the system has been tested with testing datasets for three classification setup based on the different types of feature. The overall performance results are 83.3%, 76.6% and 90% for KNN, SVM and ANN respectively with a combination of color, texture and morphological features. In general this study gives a promising result in the detection of sorghum plant pests.
5.2. Recommendation
As we discusses in the related work almost there is no researches has been made in Ethiopia using image processing with the help of machine learning to support agricultural sector specially in disease/pest diagnosis and treatment of the plant. Up to now Ethiopia economy is depending on agriculture on the other side there is industrialization compete this sector but still in Ethiopian economy chief is agriculture and it costs in millions because of disease/pest and other factors. So, because of the vast capacity and importance of the sector especially a young researchers it’s better to invest much effort in this area contributes your own legacy for this country. In this research, we have adopted different techniques we got a good and encouraging result. However, the following issues needs further study to develop an intelligent detection of sorghum plant pests with better result.
1) This study considers regionprops, rgb components and graycoprops Matlab functions as feature extraction techniques. However, their performance greatly affected depending on the variety of sorghum plant images used. It is therefore necessary to conduct further research to identify feature extraction techniques that are effective to extract better representative features of sorghum plant pest.
2) Using forward feature selection performs best when the optimal subset has a small number of features. And it is unable to remove features that become obsolete after the addition of other features. Hence, future works should adopt feature selection techniques such as information, principal component analysis so as to get the best representative features.
3) For future, in order to enhance the proposed model there is a need to the dataset for training and testing.
4) In this research the performance of the system also affected by noise filtering, segmentation, feature extraction algorithm and similarities between pest features so its extensive investigation in this area.
5) Our research is mainly focused on pest that infect on the leaf. Some pests are attack the sorghum plant on the stem, root or whole body of the plant. So, researcher can further investigating the pest appear on the stem, and root.
6) In this research, we study the sorghum plant pest detection, Ones the detection has been done recommend appropriate treatment is out of our work so as a result future work should consider and further investigated in its treatments.
Abbreviations
ICT | Information Communication Technology |
SVM | Support Vector Machine |
ANN | Artificial Neural Network |
Author Contributions
Asfaw Kiros Desalegn: Conceptualization, Data curation, Methodology, Resources
Kahsay Niguse Gebrekidan: Data curation, Investigation, Writing – review & editing
Conflicts of Interest
There is no any conflict of interest on this action research.
References
| [1] |
S. G. K. K. S. V. a. S. R. R. S. R. Huddar, “Novel algorithm for segmen-tation and automatic identification of pests on plants using image processing”, 2012 3rd International Conference on Computing, Communication and Networki, nologies, ICCCNT 2012, no. July, 2012.
https://doi.org/10.1109/ICCCNT.2012.6396012
|
| [2] |
A. D. M. a. S. G. D. M. Alemayehu, “Computer Vision for Ethiopian Agricultural Crop Pest Identification”, vol. 3, no. 1, pp. 209-214, 2016.
https://doi.org/10.11591/ijeecs.v3.i1.pages
|
| [3] |
Z. A. A. K. a. B. G. Tsehaye, “Dynamic Sorghum (Sorghum Bicolor (L.) Moench) diversity Management in Situ and Livelihood Resilience in South and Central Tigray Region, Ethiopia”, Momona Ethiopian Journal of Science, vol. 1, no. 2, pp. 67-94, 2009,
https://doi.org/10.4314/mejs.v1i2.46049
|
| [4] |
M. S. a. C. M. S. Umaa Mageswari, “An experimental study and analysis of different image segmentation techniques”, Procedia Engineering, vol. 64, pp. 36-45, 2013,
https://doi.org/10.1016/j.proeng.2013.09.074
|
| [5] |
M. Krishnan and G Jabert, “Pest Control in Agricultural Plantations Using Image Processing”, vol. 6, no. 4, pp. 68–74, 2013.
|
| [6] |
R. G. Mundada and V. V. Gohokar, “Detection and Classification of Pests in Greenhouse Using Image Processing”, vol. 5, no. 6, pp. 57-63, 2013.
|
| [7] |
S. S. a. V. B. N. G. Bhadane, “Early Pest Identification in Agricultural Crops using Image Processing Techniques”, vol. Bhadane201, 2013.
|
| [8] |
T. Seemann, Digital image processing using local segmentation. Monash University, 2002.
|
| [9] |
Y. Chen and X. Zhou, “Plant root image processing and analysis based on 2D scanner”, roceedings 2010 IEEE 5th International Conference on Bio-Inspired Computing: Theo-ries and Applications, BIC-TA 2010, pp. 1216-1220, 2010.
https://doi.org/10.1109/BICTA.2010.5645146
|
| [10] |
G. Kumar and P. K. Bhatia, “A detailed review of feature extraction in image processing systems”, International Conference on Advanced Computing and Communication Technolo-gies, ACCT, no. FEBRUARY 2014, pp. 5-12, 2014,
https://doi.org/10.1109/ACCT.2014.74
|
| [11] |
M. Habtamu, “Image analysis for Ethiopian coffee classification”, PhD thesis, MSc Thesis, Addis Ababa University, School of Graduate Studies, 2008.
|
| [12] |
Y. Chen and X. Zhou, “Plant root image processing and analysis based on 2D scanner”, Proceedings 2010 IEEE 5th International Conference on Bio-Inspired Computing: Theories and Applications, BIC-TA 2010, pp. 1216–1220, 2010.
https://doi.org/10.1109/BICTA.2010.5645146
|
| [13] |
R. M. Haralick, “Statistical and structural approaches to texture”, Proceedings of the IEEE, vol. 67, no. 5, pp. 786–804, 1979,
https://doi.org/10.1109/PROC.1979.11328
|
| [14] |
Arun Kanti Manna, “Image Processing With Sampling and Noise Filtration in Image Recognition Process”, International Journal of Engineering Inventions (IJEI), vol. 03, no. 7, pp. 35–47, 2014. [Online]. Available:
http://www.ijeijournal.com/papers/Vol.3-Iss.7/F0373547.pdf
|
| [15] |
D. Al Bashish, M. Braik, and S. Bani-Ahmad, “Detection and classification of leaf diseases using K-means-based segmentation and neural-networks-based classification”, Information Technology Journal, vol. 10, no. 2, pp. 267–275, 2011.
https://doi.org/10.3923/itj.2011.267.275
|
Cite This Article
-
APA Style
Desalegn, A. K., Gebrekidan, K. N. (2026). Artificial Intelligence Based Image Processing Model for Early Pest Detection in Sorghum Crop Plantations: In Case of Southern Tigrai. Science Discovery Computers, 1(2), 69-79. https://doi.org/10.11648/j.sdcomput.20260102.11
 Copy
|
Copy
|
 Download
ACS Style
Desalegn, A. K.; Gebrekidan, K. N. Artificial Intelligence Based Image Processing Model for Early Pest Detection in Sorghum Crop Plantations: In Case of Southern Tigrai. Sci. Discov. Comput. 2026, 1(2), 69-79. doi: 10.11648/j.sdcomput.20260102.11
Copy
|
Download
AMA Style
Desalegn AK, Gebrekidan KN. Artificial Intelligence Based Image Processing Model for Early Pest Detection in Sorghum Crop Plantations: In Case of Southern Tigrai. Sci Discov Comput. 2026;1(2):69-79. doi: 10.11648/j.sdcomput.20260102.11
Copy
|
Download
-
@article{10.11648/j.sdcomput.20260102.11,
  author = {Asfaw Kiros Desalegn and Kahsay Niguse Gebrekidan},
  title = {Artificial Intelligence Based Image Processing Model for Early Pest Detection in Sorghum Crop Plantations: In Case of Southern Tigrai},
  journal = {Science Discovery Computers},
  volume = {1},
  number = {2},
  pages = {69-79},
  doi = {10.11648/j.sdcomput.20260102.11},
  url = {https://doi.org/10.11648/j.sdcomput.20260102.11},
  eprint = {https://article.sciencepublishinggroup.com/pdf/10.11648.j.sdcomput.20260102.11},
  abstract = {Agriculture not only provides food for the human existence, it is also a big source for the economy of any country. Pests damage the crops and, thus, are very dangerous for the overall growth of the crop. In this proposed system sorghum leaf image was given as an input and for noise removal median filtering algorithm is used then the background subtraction takes place using Otsu thresholding algorithm. Then, at the end of image processing step extract and calculate three types of feature color, texture and morphological features for the segmented foreground leaf image. After feature selection algorithm is implemented, six color, five texture and ten morphological features are extracted from each sorghum plant leaf image and combined to get dataset which is used to develop the model, though model attempts with separate features were conducted in experiment. Finally, these extracted features are feed in to the classifier for the classification, K-Nearest Neighbor, Support Vector Machine and Artificial Neural Network implemented for classification purposes. In general the overall experimental result shows that the developed Artificial Neural Network model with a combination of three features namely color, texture and morphological features achieved a better result with an accuracy of 90%.},
 year = {2026}
}
Copy
|
Download
-
TY  - JOUR
T1  - Artificial Intelligence Based Image Processing Model for Early Pest Detection in Sorghum Crop Plantations: In Case of Southern Tigrai
AU  - Asfaw Kiros Desalegn
AU  - Kahsay Niguse Gebrekidan
Y1  - 2026/10/15
PY  - 2026
N1  - https://doi.org/10.11648/j.sdcomput.20260102.11
DO  - 10.11648/j.sdcomput.20260102.11
T2  - Science Discovery Computers
JF  - Science Discovery Computers
JO  - Science Discovery Computers
SP  - 69
EP  - 79
PB  - Science Publishing Group
UR  - https://doi.org/10.11648/j.sdcomput.20260102.11
AB  - Agriculture not only provides food for the human existence, it is also a big source for the economy of any country. Pests damage the crops and, thus, are very dangerous for the overall growth of the crop. In this proposed system sorghum leaf image was given as an input and for noise removal median filtering algorithm is used then the background subtraction takes place using Otsu thresholding algorithm. Then, at the end of image processing step extract and calculate three types of feature color, texture and morphological features for the segmented foreground leaf image. After feature selection algorithm is implemented, six color, five texture and ten morphological features are extracted from each sorghum plant leaf image and combined to get dataset which is used to develop the model, though model attempts with separate features were conducted in experiment. Finally, these extracted features are feed in to the classifier for the classification, K-Nearest Neighbor, Support Vector Machine and Artificial Neural Network implemented for classification purposes. In general the overall experimental result shows that the developed Artificial Neural Network model with a combination of three features namely color, texture and morphological features achieved a better result with an accuracy of 90%.
VL  - 1
IS  - 2
ER  -
Copy
|
Download





 Share This Article
 Twitter
 Linked In
 Facebook