Research Article | | Peer-Reviewed

Enhancing Livelihoods and Food Security Among South Sudanese Refugees and Host Communities at White Nile State, Sudan

Received: 5 May 2026     Accepted: 3 June 2026     Published: 17 July 2026
Views:       Downloads:
Abstract

The majority of South Sudanese refugees (SSR) have settled in refugee camps in White Nile State, Sudan. Many newly arrived refugees reached the Sudanese border in conditions of exhaustion, nutritional vulnerability, and poor health after escaping violence and deprivation. A sample of 447 households was selected from both SSR and HC populations, covering five refugee camps and four host community villages. Data were collected through structured household questionnaires, Focus Group Discussions (FGDs), and Key Informant Interviews (KIIs). Descriptive analysis was employed to evaluate perceptions of food adequacy, meal frequency, coping strategies, and food consumption. The findings revealed that 44.7% of SSR respondents perceived that available food was insufficient to sustain their livelihoods, while 55.3% considered it sufficient. A substantial proportion of households (68.7%) reported consuming less preferred foods one to two times per week as a coping mechanism against food shortages. In addition, 47.4% of households did not consume regular meals per day, while 36.2% consumed two meals. Seven major food consumption groups were identified across refugee camps and host communities. Legumes, kissra, dried okra, and dried fish were consumed by 87% of respondents. Carbohydrate-rich foods such as sorghum-based products, bread, rice, and cereals formed the daily staple diet for 57% of surveyed refugees. Plant-based proteins were consumed one to two times weekly by 33% of respondents, while 47.7% consumed animal protein at the same frequency. Sugar and sugar products were consumed daily by 45.8% of the respondents. The study recommends disseminating knowledge and information through awareness initiatives led by the government and various food-related organizations. Furthermore, it suggests providing training for South Sudanese refugees (SSR) and host communities (HC) in income-generating activities, home gardening, vocational skills, and other livelihood strategy.

Published in Research & Development (Volume 7, Issue 2)
DOI 10.11648/j.rd.20260702.12
Page(s) 74-83
Creative Commons

This is an Open Access article, distributed under the terms of the Creative Commons Attribution 4.0 International License (http://creativecommons.org/licenses/by/4.0/), which permits unrestricted use, distribution and reproduction in any medium or format, provided the original work is properly cited.

Copyright

Copyright © The Author(s), 2026. Published by Science Publishing Group

Keywords

Food Security, Food Consumption Group, South Sudanese Refugees, Host Communities

1. Introduction
Located in the southern part of Sudan, White Nile State is one of the country's 18 administrative states. Covering an area of about 38,000 km2, the state is divided into nine localities: Ad Douiem, Al Gutaina, Kosti, Rabak, Al Jabalien, Tendulti, Um Remta, Al Salaam, and Guli . Population estimates produced by the Central Bureau of Statistics projected that the state would have approximately 2.49 million inhabitants in 2018 . In addition to its resident population, White Nile State hosts a large refugee population, with around 930,000 refugees and vulnerable host-community members relying on humanitarian assistance. Estimates indicate that nearly 496,000 people in the state were expected to experience malnutrition in 2023 . Furthermore, recurrent droughts and other shocks increase the vulnerability of local communities to food insecurity . Owing to these demographic and humanitarian challenges, White Nile State was selected as the study area for this research.
White Nile State accommodates the second-highest number of refugees in Sudan, yet humanitarian assistance in the region remains comparatively limited . The refugee population, consisting entirely of South Sudanese nationals, is estimated at approximately 274,000 individuals. Although the situation is often characterized as a long-term displacement crisis, the state has continued to receive new asylum seekers since the outbreak of conflict in South Sudan in 2013. During 2021 alone, about 49,300 South Sudanese refugees entered the state, making White Nile the location of the country's largest refugee influx that year . The arrival of new refugees has persisted, with more than 10,500 individuals crossing into the state between January and May 2022. At the same time, food insecurity has become increasingly severe, affecting 23% of the population in 2022 compared with 15% in 2021. Despite these mounting humanitarian pressures, the operational presence of aid organizations remains limited, with only four international non-governmental organizations and six United Nations agencies active in the state .
Food security is a critical global concern. The World Food Summit defines food security as the condition in which all individuals, at all times, and has physical and economic access to adequate, safe, and nutritious food that satisfies their dietary requirements and preferences for an active and healthy lifestyle . From October 2023 to February 2024, a staggering 17.7 million of the Sudanese population are facing severe levels of acute food insecurity (37%). The states of Greater Darfur, Greater Kordofan, and Khartoum, which have seen significant levels of organized violence, are home to the most severely food insecure populations . These statistical results indicate that the crisis in Sudan has deteriorated following the current conflict, necessitating emergency interventions to aid vulnerable populations as an acceptable response .
Food insecurity is commonly classified into two broad categories: chronic food insecurity and transitory food insecurity. Chronic food insecurity describes a persistent condition in which individuals or households are unable to obtain sufficient food to meet their dietary needs over an extended period. This form of food insecurity is typically associated with long-term poverty, limited ownership of productive assets, and restricted access to economic and livelihood resources, resulting in a sustained inability to secure an adequate diet . In contrast, transitory food insecurity is characterized by a temporary reduction in access to sufficient food . It occurs when households experience a sudden decline in their capacity to produce, purchase, or obtain food necessary to maintain acceptable nutritional standards. Such situations are often triggered by short-term shocks that affect food availability or accessibility, including fluctuations in agricultural production, increases in food prices, declines in household income, or other unexpected disruptions . Transitory food insecurity can be further categorized into cyclical and temporary forms. Cyclical food insecurity arises from predictable and recurring patterns, whereas temporary food insecurity results from unforeseen events that abruptly affect food access and availability .
Despite these fluctuations, the state possesses substantial agricultural potential through the cultivation of commercial crops that contribute to employment and income generation. White Nile State is the leading sugar-producing region in Sudan and hosts major sugar enterprises, including the Kenana Sugar Company and the Asalaya Sugar Factory. Together, these schemes cover an estimated 221,000 feddans, with plans for future expansion expected to increase the cultivated area by more than threefold .
2. Material and Methods
2.1. Study Area
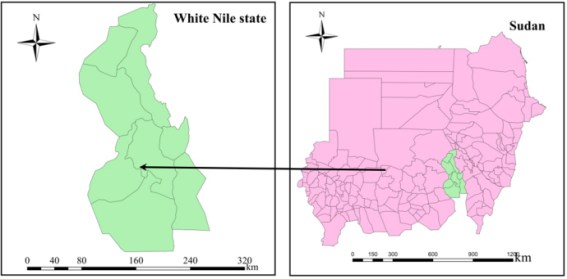
White Nile state (Figure 1) is characterized by its strategic location in central Sudan, it is bordered by Khartoum State in the north, North Kordofan State in the west, South Kordofan State and the Upper Nile State in the southeastern and Al-Gazira and Sinnar States in the east. The state area is 39, 701 square kilometers and the climate of the state characterized by hot, humid rainy summers and warm dry in winter. The area of the state is about 9,452,620 acres; the vegetation cover represents about 66% of the land of the state. The rain-fed agriculture machinery is in the area of savannah the holdings is ranging of 5-25 acres of small farmers planted with sorghum, maize, wheat, millet, sesame, peanuts, cowpeas, sunflower, guar, watermelon and vegetables as cash crops.
Figure 1. Location of the study area.
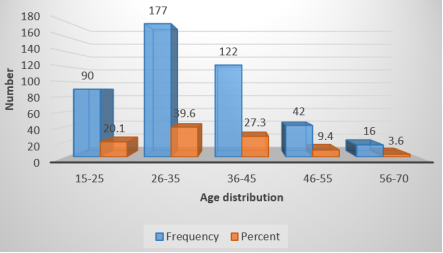
Table 1. Camp-based population of concern by location.

Camps

Households

IndividualsMale

Female

Total

Jourie

2,460

4,229

5,254

9,483

Alkashafa

2,980

5,219

6,959

12,178

Alagaya

4,318

7,114

8,174

15,288

Dabatbosin

815

1,455

1,546

3,001

Alredais1

2,914

4,878

6,408

11,286

Alredais2

4,454

8,010

10,567

18,577

Um sangour

1,632

2,591

2,428

5,019

Khoralwarel

1,898

3,311

4,639

7,950

Total

21,471

36,807

45,975

82,782

(Source: UNHCR registration database)
2.2. Data Collection and Processing & Sampling Framework
The qualitative methods included a desk literature review, Key Informant Interview (KII) and Focus Group Discussion (FGD) while the quantitative data collection methods included a rapid beneficiary assessment (RBA) using the KAP household survey employing one on one interview and case study scenarios, when necessary. A structured household questionnaire gathered the primary data, providing information on the households' demographic and economic characteristics. These included details such as the gender, age, marital status, level of education in terms of years of schooling, primary and secondary occupations, household size, experience in agricultural activities, and monthly income from both agricultural and nonagricultural activities were used.
The Assessment was conducted in 9 sample communities (5 SSR Camps and 4 HC Villages) namely, (Dabat Bosin, Alagaya, Redais 1, Redais 2, and Um Sangrur SSR Camps, and Redais Elmadrasa, Dabat Bosin, Kashsfa and Gorey Villages of Host Community. The standard approach was used following the determination of the sample size and sampling layout, considering that; as a community-based program the basic sampling unit is the Household (HH). Determination of the sample size will depend on the total number of targeted communities and on the probability and confidence level that is determined at the stage of reviewing program documents. Weights are determined based on the total number of HHs at each location and15within each livelihood group. A total of 6,134 HHs are taken as a reference to determine sample size and considered 95% as confidence level and 5% confidence interval. The sampling frame is made up of 4480HHs across 9 villages in the two targeted WNS localities on a weight basis. The selection of communities the number of targeted HHs by the study will be counted on weight-based compared to the total number of estimated beneficiaries. It is distributed in the targeted villages as shown in (Table 2). A total sample of 447 HHs have been surveyed and interviewed, as shown in Table 2.
Table2. The sample size of the survived community.

SSR camps

Number of HH

HH%

DabatBosin

37

8.26

Alagaya

60

13.39

Redais1

52

11.61

Redais 2

74

16.52

Um Sangoor

68

15.18

Total

291

64.96

Host Communities villages

RedaisElmadrasa

42

9.38

DabatBosin

30

6.47

Kashafa

42

9.38

Gorey

43

9.6

Total

157

35.04

2.3. Data Processing and Analysis
SPSS-version 22 and an upgraded version of Excel software are used based on the data level, the size, and accuracy of data gathered by the KAP survey and reported by ELFS interim the reports.
3. Results and Discussions
3.1. Population Distribution by Age and Gender
As shown in Table 3; the female represents 87% of the survived communities. This result is showed that the number of female in both the host community (HC) and South Sudanese refugees (SSR) are higher compared with the number of males. This in line with statistical information in Sudan and the global population estimates show that the number of females is rather bigger than the males. This result might be referring to the fact that women are participating in most of the activities.
Figure2 shows that the number of the population whose ages lies between 26-35 and 36-45 years old, represents 39.6% and 27.3% of the community. This could be a real demographic opportunity which means that youth as an active group is the majority. To benefit from this opportunity, genuine plans should target youth to strongly involve them in the development process. Otherwise, if they were neglected or not considered in the plans, this will lead to losing their roles and they will turn to be idle.20.1% of the targeted population their age ranged between 15-25 years old, 9.4% their age ranged between 46-55years, while the rest 3.6% of the community their age ranged between 56-70 years.
Table 3. Population distribution by gender.

Gender

Frequency

Percent

Female

389

87

Male

58

13

Total

447

100

Figure 2. Population distribution by age.
3.2. Marital Status in the Survived Area
As appear in Table 4; married HHs are higher 92% (410) in both SSR and HC, compared with 4% for each the single and divorce HHs and 3% for the widow. The divorce and widowhood among women increase the burden on her as a household head and complicate the situation for them to provide their families with the basic needs rather than a better livelihood.
Table 4. Marital Status in the survived area.

Marital Status

Frequency

Percent

Divorced

2

0.4

Married

410

91.6

Single

16

4

Separated

5

1

Widow

14

3

Total

447

100

3.3. SSR and HC Level of Education and Occupation
As shown in Figure 3; it appears that 43% of the targeted community in both SSR and HC are illiterate 38% for attending primary-basic schools, 8% of them received intermediate education, 8% received Alphabetization, 2% received university education and 1% received Khalwa "famous Islamic education). Generally, the illiteracy level is very high among the targeted communities. According to publishes UNESCO report Sudan has a higher adult literacy rate of 60.7%. While the male literacy rate is 65.44%, for females is 56.06%.
Figure3. Community level of education.
Access to education is available throughout the assessed areas, including both displacement camps and neighboring host communities. Existing educational facilities generally possess the minimum resources required for teaching and learning, and classroom space appears sufficient for the current student population. Enrollment patterns indicate no notable gender disparities, with boys and girls attending school at broadly similar rates. Despite this, attendance among older students is often disrupted during the agricultural harvesting period. At this time, many school-aged children, regardless of gender, participate in seasonal farm labor to generate income that supports their households, contributing to elevated dropout rates and interrupted learning.
Challenges remain with respect to water, sanitation, and hygiene (WASH) conditions in schools, particularly those located within the camps. Several schools lack adequate sanitation facilities, and some latrines have fallen out of use because of poor maintenance and unsanitary conditions. Furthermore, the availability of separate sanitation facilities for boys and girls is often insufficient, and access arrangements for children with disabilities or other special needs are limited. Water access is also a concern, with the school in Dabat Bosin reported to be without a functional water supply.
These livelihoods and high rates of unemployment resulted in low earnings. Combined with high food prices (the price of sorghum in Kosti was 6 percent above the three-year average), low-income levels resulted in only 22 percent of refugees having acceptable levels of purchasing power, according to WFP food security assessment for South Sudanese refugees and host communities in White Nile, April 2016 .
Table 5. Community main occupation in the targeted villages.

Main Occupation

Frequency

Percent

Livestock owner

1

2

Farming

50

11

Free labour

131

16

Housewife

5

11

Hunting

23

5

Camp Committee

2

4

Community Health Awareness

3

0.7

Housewife

209

47

Trader

10

2.2

Teacher

3

0.7

Others

10

0.4

Total

447

100

3.4. Family Size or Number of People Living in the Same House
Figure 5 shows the numbers of people stay or live at the same house. The results showed that 64% (286 out of 448) of the respondent has an average of family member of 6-10 person, 28.6% showed that the average people ranged between 1-5 person, 6% of the respondents have 11-15 person living at the same house, while 1.6% of them have 16-20 person at the same house. The heights number of people who live in small and unventilated places was observed especially in SSR refugee camps (Al alagaya and Dabatbosin, Redais1 and Redais2). The largest family numbers have negative effect on food security among SSR and HC especially with high unemployment rate and shortages in food aids. The current result agrees with the finding of . They demonstrated that smaller household sizes are more likely to attain a condition of high food security. Also, identified an inverse association between family size and food insecurity in Pakistan. Additionally, in Nepal study applied by determined that household size was negatively and statistically significant in relation to food security.
3.5. Food Consumption Groups
As shown in Table 6 there are different types of food, there is a diversity of meals during the day, in most cases; households are depending on one type of diet during the day.87.2% of the survived household (390 out of 448) depend on legumes +kissra+ dry okra+ dry fish followed by 1.6% of HH who depend on Dry okra with porridge+ Kissra with meat, 1.3% Jews mellow with meat and the percentage 0.2 depend on dry fish with porridge. Food consumption patterns among children aged 6–23 months, a critical period for physical growth and cognitive development, were found to be particularly inadequate. Only 4 percent of refugee children within this age group achieved a minimum acceptable diet, indicating significant nutritional deficiencies. Despite the implementation of large-scale food assistance programmes in refugee camps, refugees continued to represent the most food-insecure population group. The World Food Programme (WFP) food security assessment conducted in April 2016 among South Sudanese refugees and host communities in White Nile State reported that only 48 percent of refugee households were food secure, a decline from 62 percent recorded in 2015. In contrast, food security was observed among 57 percent of South Sudanese returnee households and 70 percent of households in host communities. These findings underscore the continued vulnerability of refugee populations and highlight the critical role of humanitarian food assistance in mitigating food insecurity. Without such support, food security outcomes among refugees would likely have been substantially worse.
Table 6. Food consumption group among SSR and HC.

Type of Meals

Frequency

Percent

Dry fish with porridge

1

0.2

Dry okra with porridge+ Kissra with meat sauce + Jews mellow with meat

7

1.6

Dry okra with porridge +Jews mellow with meat

1

0.2

Jews mellow with meat

6

1.3

Kissra with dry okra

4

0.9

Legumes +Kissra+ Dry Okra+ dry fish

390

87.2

Total

448

100

3.6. Number of Days and Percentages of SSR and HC Who Have Access to Sorghum Pasta, Sorghum Porridge, Bread, Rice and Other Cereals
Table 7 showed that 57% (255 out of 448) of the SSR and HC taking the carbohydrates (sorghum pasta, sorghum porridge, bread, rice & other cereals,) on daily basis, 15.7% taken the carbohydrates 5 to 6 days per week, 13.6% taken the carbohydrates 3-4 days per week, 6% taken the carbohydrates 1-2 times per week. According to WFP food security assessment for South Sudanese refugees and host communities in White Nile, April 2016, it is believed that, without assistance, food security among the refugees would be dramatically worse .
Table 7. NUmber of days and percentages of SSR and HC who have access to sorghum pasta, sorghum porridge, bread, rice and other cereals.

Days

Frequency

Percent

Zero

8

1.6

Daily

255

57

1- 2 days

28

6.3

3-4 days

61

13.6

5-6 days

70

15.7

7 days

26

5.8

Total

448

100

3.7. Number of Days and Percentages of SSR and HC Who Have Access to Vegetables the Last 7 Days
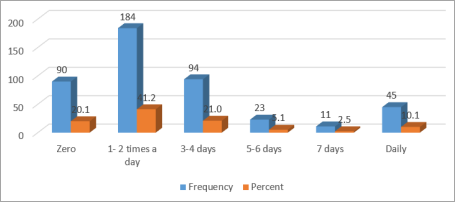
Figure 4 shows that 41.2% (148 out of 448) of the survived household taking (vegetables (fresh & dried) 1-2 times a week, 20.1 percent they have no access to the vegetable crops, 20 percent have access to the vegetable crops 3 to 4 times per week, 10.1 percent from the SSR and HC taken vegetables at daily basis, 5.1 percent taken the vegetables 6 to 5 days per week and 2.5 percent taken the vegetables 7 days per week (Figure 4).
Figure 4. Number of days and Percentages of SSR and HC who have access tovegetablesthe last 7 days.
3.8. Number of Days and Percentages of SSR and HC Who Have Access to Animal Protein in the Last 7 Days
Table 8 shows the number and percentages of SSR and HC who have access to animal protein per week. The table shows that 47.7% of the survived household taking animal protein 1-2 times a week.17 percent from the SSR and HC taken animal protein 3-4 days per week, 10% from them taken animal protein daily, 4.5 percent taken animal protein 5-6 days a week and 3.4 percent taken animal protein 7 days a week.
Table 8. Number of days of SSR and HC who have access to Animal protein: (Beef, sheep, goat, poultry, eggs & fish) during the last 7 days.

Days

Frequency

Percent

Zero

76

17.0

1- 2 days

212

47.4

3-4 days

76

17.0

5-6 days

20

4.5

7 days

16

3.4

Daily

48

10.7

Total

448

100

3.9. Number of Days and Percentages of SSR and HC Who Have Access to Sugar in the Last 7 Days and number of Males/days Among the SSR and HC
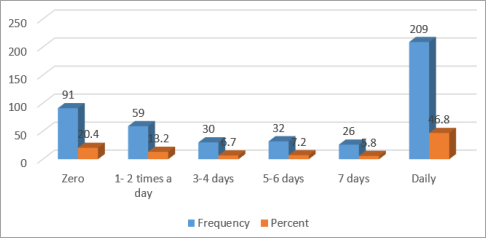
Figure5 shows the number of days who SSR and HC taken Sugar & sugar products jam, juices etc., and honey during the last 7 days. The Figure shows that 46.8% of the survived HHs (209 out of 448) use sugar and sugar products daily, 20.4 percent they have now access to sugar product, 13.2 percent have access to the sugar 1 to 2 times a week, 7.2 percent have access 5 to 6 days per week, 6.7 have access to the sugar products 3 to 4 days per week.
Figure 5. Numbers of days of SSR and HC who have rely on less preferred food.
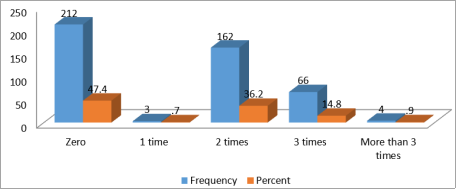
Table 9. Number of days of SSR and HC had to rely on less preferred food.

Days

Frequency

Percent

Zero

25

5.6

1- 2 a day

307

68.7

3-4 days

86

19.2

5-6 days

16

3.6

7 days

3

4

Daily

11

2.5

Total

447

100

The results showed that 68.7% of the survived households due to the food shortage taking less preferred foods 1-2 times a week, 19 percent taken the less preferred food 3-4 days per week, 5.6 did not taken the less preferred food, 4 percent taken less preferred food 7 days per week and 3.6 percent taken the less preferred food 5 to 6 days per week (Table 9 and Figure 5). Sudan experiences a significant degree of hunger, as evidenced by its ranking 103rd out of 125 nations with a score of 27.0 . From October 2023 to February 2024, a staggering 17.7 million of the Sudanese population are facing severe levels of acute food insecurity (37%). The states of Greater Darfur, Greater Kordofan and Khartoum, which have seen significant levels of organized violence, are home to the most severely food insecure populations . Households headed by women experience a disproportionate burden due to their dual responsibilities of securing household income and providing care for dependents. Inadequate livelihood opportunities, widespread unemployment, and elevated food prices have weakened household purchasing capacity, with 78 percent of refugees unable to afford the local food basket . Consequently, many refugees engage in negative coping mechanisms, including the sale of a portion of their food assistance to obtain cheaper, less nutritious food items or to finance other basic household needs such as energy and grain milling. These practices underscore the fragile state of food security among refugee populations and indicate a high risk of further deterioration, potentially resulting in widespread food insecurity across refugee settlements.
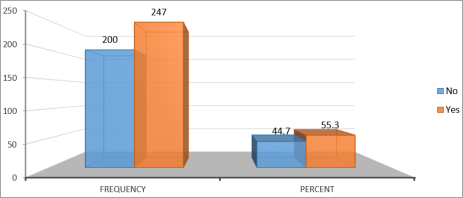
Concerning the number of males/day which is ranged between Zero to more than 3 miles/ day, the results showed that 47.4% (212 out of 448) they did not take regular males/day and this may be attributed to the difficult food security situation in the camps and surrounding host community. Furthermore, 36.2% (162 out of 448) stated that they are taking 2 males/ day (Figure 6). The results showed that 55.3% (247out of 447) from the survived household perceive that the food is enough for them to secure their life, while 44.7% (200 out of 447) from the survived HH perceived that the food is not enough to secure their life. The higher percentage of the population who feel food insecurity may be attributed to the fact that most of them living in the camps and depend on external aid (Figure6). Coping mechanisms such as begging, borrowing, and selling food rations are used by the majority of the refugee households, especially when there is no seasonal agricultural work.
Figure 6. Number of meals/day during the last 7 days.
Although large-scale food assistance programs were implemented in refugee camps, refugees continued to experience the highest levels of food insecurity. Food security among refugee households declined from 62 percent in 2015 to 48 percent in 2017, compared with 57 percent among returnees and 70 percent among host-community households (JAM, 2017). While refugee households exhibited food consumption patterns similar to those of host and returnee communities, this was largely attributable to ongoing humanitarian assistance. The proportion of refugee households with acceptable food consumption decreased from 70 percent to 59 percent over the same period, with substantial variation across settlements. In Um Sangoor, only 30 percent of households achieved acceptable food consumption. The situation was particularly severe among children aged 6–23 months, of whom only 4 percent received an acceptable diet, indicating serious nutritional vulnerability during a critical stage of development.
Figure 7. Respondent point of view towards food security.

4. Conclusion and Recommendation
The results indicate that less than half of SSR and HC household suffered from food insecurity and the food security among SSR was affected by many factors such as the high unemployment rate, illiteracy, lack of vocational training, spread of COVID, 19 and other factors. For the food consumption group about eight food groups were identified. About half percent of SSR did not take one meals per day in a regular basis that means they need urgent food aid from the NGOs or government of Sudan. The high level of dependence on external assistance for basic services and commodities, such as food, shelter, and water, raises concerns regarding the long-term sustainability of current support mechanisms. Unless appropriate interventions are introduced to improve livelihood opportunities and strengthen the self-reliance capacities of refugees and host communities, humanitarian needs are likely to persist or increase, placing additional pressure on available resources. Sustainable livelihood development should therefore be prioritized as a key component of resilience-building and food security strategies. The findings of the study highlight the importance of improving household awareness and knowledge of nutrition, particularly regarding the role of dietary quality and diversity in maintaining good health. The study therefore recommends the implementation of educational and awareness programs aimed at promoting diversified food consumption patterns and informed dietary choices to reduce the prevalence of food poverty and malnutrition. In addition, strengthening the capacity and outreach of extension services is essential for enhancing food and nutrition systems within the study area and other parts of Sudan. Such interventions would support sustainable improvements in household nutrition and food security.
Abbreviations

FGD

Focus Group Discussion

IDP

Internally Displaced People

KII

Key Informants Interview

NRC

Norwegian Refugee Council

CBS

Central Bank of Sudan

MOA

Ministry of Agriculture

HC

Host Communities

SSR

South Sudanese Refuges

ELFS

Enhancing Livelihoods and Food Security

WNS

White Nile State

WFP

World Food Program

Author Contributions
Kamal Eldin Mohammed Fadul: Conceptualization, Writing – original draft
El Tighani Mirghani Elamin: Conceptualization, Supervision, Validation
Abdelrahman Ahmed Khatir: Conceptualization
Fadwa Hassan Ibrahim: Data curation, Supervision
Dirdiri Hassan Mahmoud: Data curation, Supervision
Sona Mohammed Fadul: Data curation, Supervision
Conflicts of Interest
The authors declare no conflicts of interest.
References
[1] Akbar, M., Niaz, R., Amjad, M., 2020. Determinants of Households’ Food Insecurity with Severity Dimensions in Pakistan: Varying Estimates Using Partial Proportional Odds Model. Health and Social Care in the Community. 28(5), 1698–1709.
[2] Akinboade, O. A., Mokwena, M. P., Adeyefa, S. A., 2016. Determinants of Food Insecurity among the Urban Poor in the City of Tshwane, South Africa. Journal of Econ Development Studies. 4(2), 101–114.
[3] CBS, 2018. Population Projections from 2010 to 2018.Available from:
[4] Elzaki, R. M., Elbushra, A. A., Ahmed, S. E., et al., 2011.The Role of Livestock Production on Food Security in Sudan: Rural White Nile State. Online journal of Animal Feed and Research. 1(6), 439–443.
[5] FAO (2008). An Introduction to the Basic Concepts of Food Security. The EC-FAO Food Security Programme. Available on Line at:
[6] FAO, 2023. The Sudan: Escalating Conflict Food Security Analysis. Available from:
[7] GAM (2017). Joint assessment mission (GAM) White Nile, Sudan, Final Report, August, 2017.
[8] MoAF (2009). Annual Food Security Report 2008. General Administration for Planning and Agricultural Economics, Food Security Administration, Ministry of Agriculture and Forests, April 2009 (in Arabic).
[9] Mazenda, A., Manzi, P., Mushayanyama, T., et al., 2022. Household Level Determinants of Food Security in the City of Tshwane, South Africa. Food Research. 6(6), 184–192.
[10] Mahmood, T., Kumar, R., Ali, T. M., et al., 2023.Determinants of the Food Insecurity at Household Level in Pakistan: A Multilevel Model Approach. PLoS One. 18(10), e0291343.
[11] Maharjan, K. L., Joshi, N. P., 2011. Determinants of Household Food Security in Nepal: A Binary Logistic Regression Analysis. Journal of Mountain Science. 8, 403–413.
[12] NRC (Norwegian Refugee Council) (2022). White Nile Camps, Multispectral Need Assessment. Refugee Camps in White Nile States: White Nile Localities, AL Jabalain and Elsalam, Published July 2022.
[13] OCHA, 2023. Sudan: White Nile State Profile. Available from:
[14] SmarAbdalla (2024). Determinants of Household Food Security Status in Sudan, White.
[15] Steffan Abele, Edgar Twine, andChristoffer Legg (2007). Food Security in Eastern Africa and the Great Lakes, Final report submitted to USAID on October 15th.
[16] Von Grebmer, K., Bernstein, J., Geza, W., et al., (2023). Global Hunger Index: The Power of Youthin Shaping Food Systems. Welthungerhilfe (WHH): Bonn; Concern Worldwide: Dublin. 60p.
[17] World Food Summit, (1996). Rome Declaration on World Food Security, Available from:
Cite This Article
  • APA Style

    Fadul, K. E. M., Elamin, E. T. M., Khatir, A. A., Ibrahim, F. H., Mahmoud, D. H., et al. (2026). Enhancing Livelihoods and Food Security Among South Sudanese Refugees and Host Communities at White Nile State, Sudan. Research & Development, 7(2), 74-83. https://doi.org/10.11648/j.rd.20260702.12

    Copy | Download

    ACS Style

    Fadul, K. E. M.; Elamin, E. T. M.; Khatir, A. A.; Ibrahim, F. H.; Mahmoud, D. H., et al. Enhancing Livelihoods and Food Security Among South Sudanese Refugees and Host Communities at White Nile State, Sudan. Res. Dev. 2026, 7(2), 74-83. doi: 10.11648/j.rd.20260702.12

    Copy | Download

    AMA Style

    Fadul KEM, Elamin ETM, Khatir AA, Ibrahim FH, Mahmoud DH, et al. Enhancing Livelihoods and Food Security Among South Sudanese Refugees and Host Communities at White Nile State, Sudan. Res Dev. 2026;7(2):74-83. doi: 10.11648/j.rd.20260702.12

    Copy | Download

  • @article{10.11648/j.rd.20260702.12,
      author = {Kamal Eldin Mohammed Fadul and El Tighani Mirghani Elamin and Abdelrahman Ahmed Khatir and Fadwa Hassan Ibrahim and Dirdiri Hassan Mahmoud and Sona Mohammed Fadul},
      title = {Enhancing Livelihoods and Food Security Among South Sudanese Refugees and Host Communities at White Nile State, Sudan},
      journal = {Research & Development},
      volume = {7},
      number = {2},
      pages = {74-83},
      doi = {10.11648/j.rd.20260702.12},
      url = {https://doi.org/10.11648/j.rd.20260702.12},
      eprint = {https://article.sciencepublishinggroup.com/pdf/10.11648.j.rd.20260702.12},
      abstract = {The majority of South Sudanese refugees (SSR) have settled in refugee camps in White Nile State, Sudan. Many newly arrived refugees reached the Sudanese border in conditions of exhaustion, nutritional vulnerability, and poor health after escaping violence and deprivation. A sample of 447 households was selected from both SSR and HC populations, covering five refugee camps and four host community villages. Data were collected through structured household questionnaires, Focus Group Discussions (FGDs), and Key Informant Interviews (KIIs). Descriptive analysis was employed to evaluate perceptions of food adequacy, meal frequency, coping strategies, and food consumption. The findings revealed that 44.7% of SSR respondents perceived that available food was insufficient to sustain their livelihoods, while 55.3% considered it sufficient. A substantial proportion of households (68.7%) reported consuming less preferred foods one to two times per week as a coping mechanism against food shortages. In addition, 47.4% of households did not consume regular meals per day, while 36.2% consumed two meals. Seven major food consumption groups were identified across refugee camps and host communities. Legumes, kissra, dried okra, and dried fish were consumed by 87% of respondents. Carbohydrate-rich foods such as sorghum-based products, bread, rice, and cereals formed the daily staple diet for 57% of surveyed refugees. Plant-based proteins were consumed one to two times weekly by 33% of respondents, while 47.7% consumed animal protein at the same frequency. Sugar and sugar products were consumed daily by 45.8% of the respondents. The study recommends disseminating knowledge and information through awareness initiatives led by the government and various food-related organizations. Furthermore, it suggests providing training for South Sudanese refugees (SSR) and host communities (HC) in income-generating activities, home gardening, vocational skills, and other livelihood strategy.},
     year = {2026}
    }
    

    Copy | Download

  • TY  - JOUR
    T1  - Enhancing Livelihoods and Food Security Among South Sudanese Refugees and Host Communities at White Nile State, Sudan
    AU  - Kamal Eldin Mohammed Fadul
    AU  - El Tighani Mirghani Elamin
    AU  - Abdelrahman Ahmed Khatir
    AU  - Fadwa Hassan Ibrahim
    AU  - Dirdiri Hassan Mahmoud
    AU  - Sona Mohammed Fadul
    Y1  - 2026/07/17
    PY  - 2026
    N1  - https://doi.org/10.11648/j.rd.20260702.12
    DO  - 10.11648/j.rd.20260702.12
    T2  - Research & Development
    JF  - Research & Development
    JO  - Research & Development
    SP  - 74
    EP  - 83
    PB  - Science Publishing Group
    SN  - 2994-7057
    UR  - https://doi.org/10.11648/j.rd.20260702.12
    AB  - The majority of South Sudanese refugees (SSR) have settled in refugee camps in White Nile State, Sudan. Many newly arrived refugees reached the Sudanese border in conditions of exhaustion, nutritional vulnerability, and poor health after escaping violence and deprivation. A sample of 447 households was selected from both SSR and HC populations, covering five refugee camps and four host community villages. Data were collected through structured household questionnaires, Focus Group Discussions (FGDs), and Key Informant Interviews (KIIs). Descriptive analysis was employed to evaluate perceptions of food adequacy, meal frequency, coping strategies, and food consumption. The findings revealed that 44.7% of SSR respondents perceived that available food was insufficient to sustain their livelihoods, while 55.3% considered it sufficient. A substantial proportion of households (68.7%) reported consuming less preferred foods one to two times per week as a coping mechanism against food shortages. In addition, 47.4% of households did not consume regular meals per day, while 36.2% consumed two meals. Seven major food consumption groups were identified across refugee camps and host communities. Legumes, kissra, dried okra, and dried fish were consumed by 87% of respondents. Carbohydrate-rich foods such as sorghum-based products, bread, rice, and cereals formed the daily staple diet for 57% of surveyed refugees. Plant-based proteins were consumed one to two times weekly by 33% of respondents, while 47.7% consumed animal protein at the same frequency. Sugar and sugar products were consumed daily by 45.8% of the respondents. The study recommends disseminating knowledge and information through awareness initiatives led by the government and various food-related organizations. Furthermore, it suggests providing training for South Sudanese refugees (SSR) and host communities (HC) in income-generating activities, home gardening, vocational skills, and other livelihood strategy.
    VL  - 7
    IS  - 2
    ER  - 

    Copy | Download

Author Information
  • Abstract
  • Keywords
  • Document Sections

    1. 1. Introduction
    2. 2. Material and Methods
    3. 3. Results and Discussions
    4. 4. Conclusion and Recommendation
    Show Full Outline
  • Abbreviations
  • Author Contributions
  • Conflicts of Interest
  • References
  • Cite This Article
  • Author Information