Abstract
The Wafa oil and gas field, located in Libya's Ghadames Basin, has historically faced challenges in accurately characterizing its F3 Sandstone Reservoir due to limited structural and stratigraphic data, particularly in certain wells. This study addresses these gaps by employing a comprehensive 3D geological model to evaluate the reservoir's structural and petrophysical properties across five newly drilled wells. Utilizing Petrel software, geological and petrophysical models were developed, with porosity and water saturation values derived from well log data processed in Techlog software. Results reveal significant heterogeneity in reservoir properties, with porosity levels ranging from 12% to 17% in most wells, while well A12 exhibits negligible porosity due to lithological variations. Water saturation levels range from 30% to 45% in the northwest, increasing to 100% in the southern well A12. The structural model highlights the potential for oil trapping in the F3 reservoir, with distinct facies and petrophysical variations observed across the study area. Rock typing analysis further underscores the heterogeneity within the F3 members, with the northern region demonstrating favorable petrophysical characteristics and porosity, contrasting with the less promising southern region. This study provides critical insights into the geological and petrophysical properties of the F3 Sandstone Reservoir, offering valuable guidance for hydrocarbon exploration and production in the Ghadames Basin. The integration of 3D geological modeling and petrophysical analysis underscores the need for high-resolution seismic data to enhance reservoir characterization accuracy, thereby supporting informed decision-making for future exploration and development efforts.
1. Introduction
Energy Information Administration (EIA) Reported Libya is among the globally recognized countries that produce oil and gas
| [1] | M. Milad et al., "Experimental investigation of bypassed-oil recovery in tight reservoir rock using a two-step CO2 soaking strategy: Effects of fracture geometry," Upstream Oil and Gas Technology, vol. 11, p. 100093, 2023/09/01/ 2023. https://doi.org/ 10.1016/j.upstre.2023.100093 |
| [2] | M. Milad, R. Junin, A. Sidek, A. Imqam, and M. Tarhuni, "Huff-n-puff technology for enhanced oil recovery in shale/tight oil reservoirs: Progress, gaps, and perspectives," Energy & Fuels, vol. 35, no. 21, pp. 17279-17333, 2021. https://doi.org/10.1021/acs.energyfuels.1c02561 |
| [3] | Z. Wang, S. Li, Z. Jin, Z. Li, Q. Liu, and K. Zhang, "Oil and gas pathway to net-zero: Review and outlook," Energy Strategy Reviews, vol. 45, p. 101048, 2023/01/01/ 2023. https://doi.org/10.1016/j.esr.2022.101048 |
[1-3]
Wafa oil and gas field, property of the Mellitah Gas Company. It is situated in the Southwestern region of the Ghadames Basin, along the Libyan-Algerian border, approximately 100 kilometers South of Ghadames city. Initially discovered by Shell Libya in 1964 through the drilling of the D1-52 well, subsequent exploration by Sirte Oil Company in 1991 led to the discovery of well A1-NC169a, which tested hydrocarbons in the Middle Devonian sandstones of the Aouinet-Ouenine Formation. Following this discovery, an appraisal campaign was conducted from 1991 to 1999, resulting in the drilling of 11 additional wells in the area. Mellitah further expanded exploration efforts, drilling over 55 wells in the field. Notably, the Wafa Field yields both oil and gas from its primary reservoir, the F3 Sandstone.
Many researchers conducted an examination of the Ghadames Basin to improve well production in the F3 sandstone of the Aouinet-Ouenine Formation of the Middle Devonian
| [4] | T. R. Klett, "Total petroleum systems of the Illizi Province, Algeria and Libya; Tanezzuft-Illizi," in "Bulletin," Report 2202A, 2000. https://doi.org/10.3133/b2202A |
[4]
. This formation is dominant for reservoir production in the Wafa field, boasting a gross thickness of 130 to 187 feet. Applying a reservoir saturation test (RST) and repeat formation test (RFT), petrophysical data from five wells was grouped and analyzed using Techlog software. The findings exposed a mixture of hydrocarbons and water within the reservoir, with fluctuations in fluid contacts impacting fluid levels. Pressure profiles of the F3-sandstone reservoir in wells X5, X10, X37, X38, and X39-NC196 were developed, showcasing the prevalence of gas and oil zones as the primary hydrocarbon phases within the reservoir.
Several studies conducted focused on the Tahara Formation sand located in the Wafa Field of NC169a Block in South Western Libya
| [4] | T. R. Klett, "Total petroleum systems of the Illizi Province, Algeria and Libya; Tanezzuft-Illizi," in "Bulletin," Report 2202A, 2000. https://doi.org/10.3133/b2202A |
| [5] | A. Jabir, A. Cerepi, C. Loisy, and J. L. Rubino, "Evaluation of reservoir systems in Paleozoic sedimentary formations of Ghadames and Jefarah basins," Journal of African Earth Sciences, vol. 183, p. 104324, 2021/11/01/ 2021. https://doi.org/10.1016/j.jafrearsci.2021.104324 |
[4, 5]
. The formation is recognized as a secondary objective for petroleum extraction, with particular attention given to pivotal matters concerning the exploration and enhancement of the region's potential. Five wells situated within the Wafa Field (A2, A3, A34, A36, and A45 NC169a) were purposefully selected for this research endeavor. These wells were originally drilled to target hydrocarbon production from the Aouinet Ouenine F3 Sand Formation but intersected the Tahara Sand Formation of interest, prompting the deployment of wireline logs and plans for sidewall core sampling in the future. The logging data acquired were meticulously analyzed using TechLog software 2015 to discern the petrophysical characteristics of the sand, leading to the estimation of reserves based on the findings. Reserve estimation results revealed an oil-in-place volume of 6,940,711.768 MMSTB and an estimated oil recovery of approximately 2,024,374.266 MMSTB.
Basal et al. investigated the Aouinet Wenin Formation (F3) "B" sandstone in the Wafa field, located in Libya's Ghadames Basin, specifically in the A37-NC169a well
| [6] | A. M. K. Basal, M. A. Sarhan, M. G. Alfarog, and A. El Bahrawy, "Relative permeabilities as dynamic petrophysical parameters, Wafa Field, Ghadamis Basin, North West Libya," Scientific Journal for Damietta Faculty of Science, vol. 13, no. 3, pp. 47-52, 2023. https://doi.org/10.21608/sjdfs.2023.245746.1138 |
[6]
. Well-logging revealed that water saturation levels in the topmost F3B sandstone are less than 30%, indicating a significant reservoir potential. Notably, the relative permeability of water and water cut value was found to be zero, whilst the relative permeability of oil was 100%, confirming the interval's irreducible status. The J function technique validated the improved reservoir performance of the F3B Upper Unit 1, with low computed J values (<3.48) indicating low capillary pressure and mega-pores. Also, the calculated irreducible water saturation of 22% aligns closely with the core data obtained during the study.
Prior research on the well Al Wafa field in Libya's Ghadames Basin lacked a thorough investigation of the reservoir's potential due to limited data availability and insufficient consideration of key geological characteristics
| [6] | A. M. K. Basal, M. A. Sarhan, M. G. Alfarog, and A. El Bahrawy, "Relative permeabilities as dynamic petrophysical parameters, Wafa Field, Ghadamis Basin, North West Libya," Scientific Journal for Damietta Faculty of Science, vol. 13, no. 3, pp. 47-52, 2023. https://doi.org/10.21608/sjdfs.2023.245746.1138 |
| [7] | M. Milad, R. Omran, N. M. A. Omar, and M. Enfis, "Predicting Waterflooding Performance IN A-NC186 Oil FIELD," African Journal of Advanced Pure and Applied Sciences (AJAPAS), pp. 251-258, 2024. https://aaasjournals.com/index.php/ajapas/article/view/931 |
[6, 7]
. These studies did not provide thorough information on the reservoir's structural and stratigraphic features of certain wells, which limits the understanding of its hydrocarbon potential. Furthermore, there was a lack of integration between geology and geophysical data, lowering the accuracy of reservoir modelling and resource estimation. Previous research did not adequately address issues concerning reservoir fluid properties and production strategies, which may have an impact on future exploration and development efforts in the area.
Therefore, the main objective of this research is to develop a 3D geological model and conduct a petrophysical investigation of the new drilled wells to assess the reservoir quality represented by the F3 Sandstone Formation. Using the Petrophysical analysis results from well logging and combining them with geological data will better understand the reservoir quality in the studied area. In this research, geological and petrophysical models are developed using Schlumberger Petrel software to assess reservoir quality. The chosen wells (A12, A13, A41, A50, and A51-NC169a content well) underwent a petrophysical assessment employing Techlog 2015 software. This analysis encompassed evaluations of gamma-ray (GR), neutron, resistivity, sonic, and formation top logs with the aim of determining a range of petrophysical characteristics pertinent to the F3-sand unit, including porosity, permeability, water saturation, and net pay.
2. Research Methodology
2.1. Geology of the Study Area
The Ghadames Basin, a substantial intracratonic basin within the North African Platform, originated during the early Palaeozoic era. Encompassing approximately 350,000 km² across segments of Libya, Algeria, and Tunisia, this basin harbors around 6,000 meters of Palaeozoic and Cenozoic sedimentation
| [8] | A. E. Radwan, "The North African Neoproterozoic, Phanerozoic Sedimentary Basins: Tectonostratigraphic Events, Lithostratigraphy, Petroleum Systems," in The Geology of North Africa, Z. Hamimi et al. Eds. Cham: Springer International Publishing, 2024, pp. 221-249. https://doi.org/10.1007/978-3-031-48299-1_8 |
| [9] | G. Gambacorta et al., "Hot shale in an ice world: Paleoceanographic evolution of the northern Gondwana margin during the early Paleozoic (Tanezzuft Formation, Tunisia)," Marine and Petroleum Geology, vol. 72, pp. 393-411, 2016/04/01/ 2016. https://doi.org/10.1016/j.marpetgeo.2016.02.015 |
| [10] | S. Carruba, C. Perotti, M. Rinaldi, I. Bresciani, and G. Bertozzi, "Intraplate deformation of the Al Qarqaf Arch and the southern sector of the Ghadames Basin (SW Libya)," Journal of African Earth Sciences, vol. 97, pp. 19-39, 2014/09/01/ 2014. https://doi.org/10.1016/j.jafrearsci.2014.05.001 |
[8-10]
. The Palaeozoic sections is separated from the overlying Mesozoic deposits by a major regional unconformity of Hercynian (Permian-Carboniferous) age. During the initial stages of the Paleozoic era, the geological development of the basin was influenced by the Pan-African tectonic trend extending from the northwest to the southeast
. However, this correlation has only recently been revealed as a result of the significant depth of the sedimentary layers above it. The geographical area experiences a narrowing trajectory towards the southern direction, being constrained amid the Tripoli-Tibisti and Tihemboka uplifts, eventually funneling into the Murzuq Basin. Towards the eastern side, the Paleozoic segment makes a close proximity with the Tripoli-Tibisti Uplift, while the western side witnesses the Tihemboka Uplift ceasing its extension beyond the Edjeleh field. As a result, the basin expands into a vast depositional center that stretches towards Algeria and Tunisia to the west of the Tihemboka Uplift. In the majority of the region, the basement is established; however, as one moves further south, notably within the Lllizi Basin in Algeria, it is predominantly characterized by rocks originating from the Pan-African mobilized belt. The Ghadames Basin, a Palaeozoic depression basin, experienced deformation and erosion as a result of the Hercynian Orogeny. It lies beneath the Hamada Basin, a Mesozoic basin that formed after the orogenic event. The Nafusah Uplift, a Hercynian geological structure, was rejuvenated during the late Cenozoic era. The Jifarah Basin initiated its downward movement in the early Mesozoic, with significant subsidence taking place during the Miocene epoch
The Ghadames Basin lies underneath the Western flank of the Sirt Basin. The Tripoli-Tibisti Arch, displaying a pan-African basement trend, is only faintly discernible and significantly less pronounced when compared to the Murzuq Basin. The erosion processes and topographical features formed on this unconformity greatly influence the petroleum systems present within the basin
| [12] | K. Echikh, "Geology and hydrocarbon occurrences in the Ghadames Basin, Algeria, Tunisia, Libya," Geological Society, London, Special Publications, vol. 132, no. 1, pp. 109-129, 1998. https://doi.org/10.1144/GSL.SP.1998.132.01.06 |
[12]
, impacting the preservation of hydrocarbons from the Paleozoic era, the connectivity between the source and upper reservoirs, and the pathways of long-distance migration within the Triassic reservoir. The sedimentary sequence of the basin spans from the Paleozoic to the Cenozoic periods, reaching a maximum thickness of 6000 meters and comprising sandstone, shale, siltstone, and indigenous source rocks found within the Paleozoic sediments of the Ghadames Basin, specifically the lower Silurian Tanezzuft Formation's basal shaly member and the Aouinet Ouenine Formation
| [13] | D. Lučić and W. Bosworth, "Regional Geology and Petroleum Systems of the Main Reservoirs and Source Rocks of North Africa and the Middle East," in The Geology of the Arab World---An Overview, A. Bendaoud, Z. Hamimi, M. Hamoudi, S. Djemai, and B. Zoheir Eds. Cham: Springer International Publishing, 2019, pp. 197-289. https://doi.org/10.1007/978-3-319-96794-3_6 |
[13]
.
The stratigraphic succession displays a peak thickness between 15000 and 17000 feet at the basin's central deposition point. It comprises two sedimentary supercycles, the palaeozoic and meso-Cenozoic, separated by a significant angular unconformity dating back to the Hercynian era. The lowermost Cambrian deposits that overly the Precambrian sequence is the predominantly continental, cross-bedded, fine- to coarse-grained sandstones of the Hasawnah layers. The thickness of this unit can vary from several tens to several hundreds of meters. The Ordovician unconformably overlies the Cambrian and is composed of three formations of marine origin. The lowermost unit is the Hawaz formation, which consists of medium- to fine-grained sandstones with widely varying amounts of grey and green sandy to silty micaceous fissile shale. The thickness varies from 90 to 180 m (295 to 590 ft). The upper Melaz Shuqran geological formation is comprised of alternating layers of shale and sandstone. The shales exhibit a grey-black hue, possess fissile properties, and at times display phyllitic characteristics. Its thickness ranges from 60 meters (197 feet) to exceeding 100 meters (328 feet). The overlying Mamuniyat stratum, positioned as the highest unit in the Ordovician period, is characterized by densely packed beds of quartz sandstones varying in size from fine to coarse grain. These sandstones can range from crumbly to quartzitic in composition, with silica cement, notably concentrated at the uppermost layer. In the basin's northern sector, the formation concludes with a limestone layer, periodically dolomitized, achieving a maximum thickness of 75 meters (246 feet) and containing evidence of shelf deposits such as bryozoans, mollusks, and ostracods. The Mamuniyat formation fluctuates in thickness, measuring less than 60 meters (197 feet) to over 175 meters (575 feet) at its extremes.
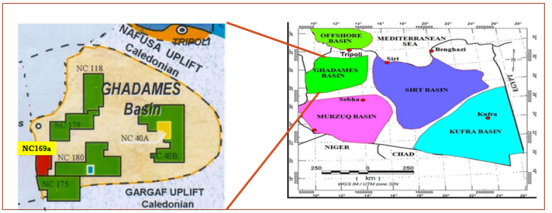
Figure 1 shows the location map of the study area, NC169 a.
Figure 1. Location map of the study area, NC169 a.
2.2. Lithostratigraphy of Study Area
The F3 sandstone reservoir is predominantly revered in the region situated amidst the Alrar-Wafa fields and their vicinities. The F3 sandstone is detected within certain known fields in the Algerian regions bordering the Eastern territory. Contextually, the F3 sandstone and F4 sands constitute a segment of Awaynat Wanin A, dating back to the middle to the upper Devonian period
| [14] | E. J. Stirling, S. Guinn, M. Salam, M. Elbakai, and Y. Abutarruma, "Silurian–Devonian depositional environments in the southern Ghadamis Basin," in The Geology of Southern Libya: Sedimentary Basins of Libya, Fourth Symposium, Earth Science Society of Libya, 2012, pp. 3-22. |
| [15] | L. Davidson et al., "The structure, stratigraphy and petroleum geology of the Murzuq Basin, Southwest Libya," 2000, pp. 295-320. https://doi.org/10.1016/B978-044450611-5/50016-7 |
[14, 15]
. The Awaynat Wanin B functions as a cap overlying the Awaynat Wanin "C," serving as a barrier for the reservoirs below. The F3 sandstone, situated in close proximity to the Alrar/Wafa fields, is recognized as the principal reservoir sandstone in the region. This geological formation houses hydrocarbons within the F4 and F3 reservoirs of the Ghadames Basin
| [5] | A. Jabir, A. Cerepi, C. Loisy, and J. L. Rubino, "Evaluation of reservoir systems in Paleozoic sedimentary formations of Ghadames and Jefarah basins," Journal of African Earth Sciences, vol. 183, p. 104324, 2021/11/01/ 2021. https://doi.org/10.1016/j.jafrearsci.2021.104324 |
[5]
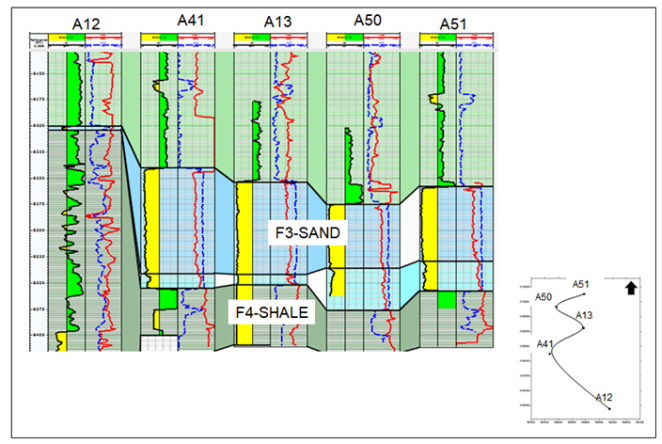
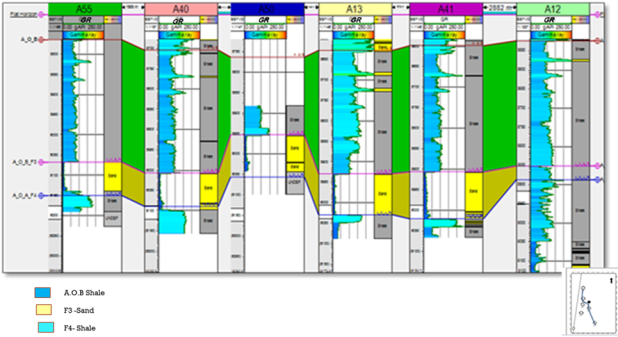
. The lithological composition of F3 sandstone primarily consists of sandstone with a small proportion of shale intermixed within. There is a good correction between wells from South to North to illustrate the F3-sand presented in the study area (
Figure 2), which shows the sandstone increasing toward the North and changing to shale sand toward the South. The lithology of the sand reservoirs is the accumulation of most parts in the North part, as in the GR log, low valves indicate the lithology is clear sandstone, and high GR in the lower part of the log indicates the lithology has become more shaly sandstone. The associations observed between the geophysical response and the depth indicated that the reservoir comprises predominantly unadulterated sandstone, with a minor presence of shale situated in both the upper and lower sections.
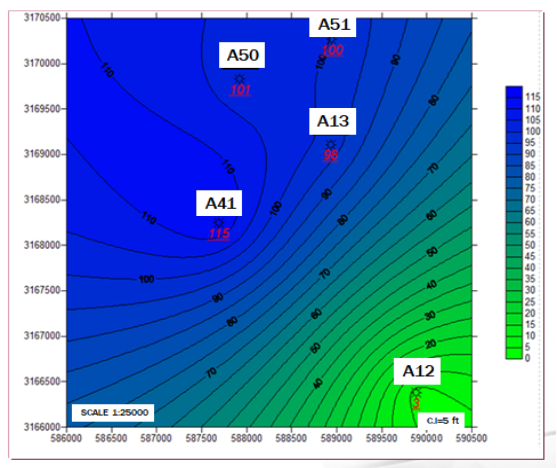
Figure 2 clearly defines the boundaries of sandstone through each well of the F3 sandstone reservoir. The gross stratigraphic of the F3 sandstone interval shown in the thickness map of the study area (
Figure 3) shows that the thickness varies by almost 3 ft in the South part of well A12-NC169a, and more than 100 ft towards the North. This sand consists of very fine to medium-grained sandstone, while the lower 53 ft tends to be shaly facies. The cross-section runs North-South to demonstrate and clarify the F3 sandstone reservoir continuity, which is composed mainly of a high percentage of sandstone with layers of shale increasing towards the bottom of the F3 sandstone, which probably makes a good bottom seal. The top F3 sandstone is composed of thick shale in the entire area of the Wafa field and the study area, which is considered a good top seal of the F3 sandstone reservoir.
Figure 2. Well correction from the South to North part.
Figure 3. Thickness map of F3-sandstone in South Wafa field.
2.3. Petrophysical Analysis and 3D Model
The petrophysical analysis of the F3 sand reservoir within the Wafa field was carried out with the aim of gathering the essential parameters required for volumetric assessments using data from five wells. Various well logs, including GR, density, neutron, sonic, and resistivity logs, were utilized in the analysis. The methods and formulas used in arriving at the petrophysical results are given in steps as follows: The methodology engaged in deriving the petrophysical findings can be delineated in the following procedural steps: The initial stage involves the determination of shale volume within the area of interest or the reservoir using the GR log, indicating shale content ranging from 0% to 100%. The Vsh is delineated as a function of the minimum gamma-ray (GRmin) and maximum gamma-ray (GRmax) readings. The GR index equation employs the GR log data to identify productive intervals and evaluate reservoir quality across each well; thus, aiding in the calculation of shale volume. The overall shale volume within the investigation zone is encapsulated by summarizing the Vsh values derived from the GR log and can be quantified through the corresponding relation, (Equation
1).
(1)
Whereas VGR is the volume of shale (API). The reading of GRlog is the highest recorded value on the log scale, while GRclean represents the lowest recorded reading on the same scale. Meanwhile, GRsh denotes the maximum reading on the log. Total porosity (Ø) may consist of primary and secondary porosity. The effective porosity represents the overall porosity following the correction for shale presence. The porosity of the rock can be derived from various well logs such as the sonic log, density log, or neutron log. Both the neutron and density logs were utilized to calculate the total porosity (ØND) of the F3 sand reservoir in this study. Density porosity or porosity density (ØD) was required because shally sandstone reservoirs usually contain other complex lithologies which also usually consist of particles of shale. The value of parameter ØD was established according to the composition of the reservoir rock as outlined in Equation
2.
(2)
Whereas ρb is bulk density, gm/cc (log). ρfl is fluid density, (equal 1gm/cc). ρb ma is matrix density, equal to 2.64 gm/cc (for limestone). ФD is density porosity. The neutron porosity has been determined directly from the neutron log. Equation 3 calculates the average water saturation (Sw-avg) for each well in the F3-sand reservoir, displaying the distribution of water saturation over the field. To calculate the net pay thickness (h), the gross reservoir thickness (H) of all the wells under consideration was first determined.
(3)
3 Results and Discussion
3.1. Petrophysics Result
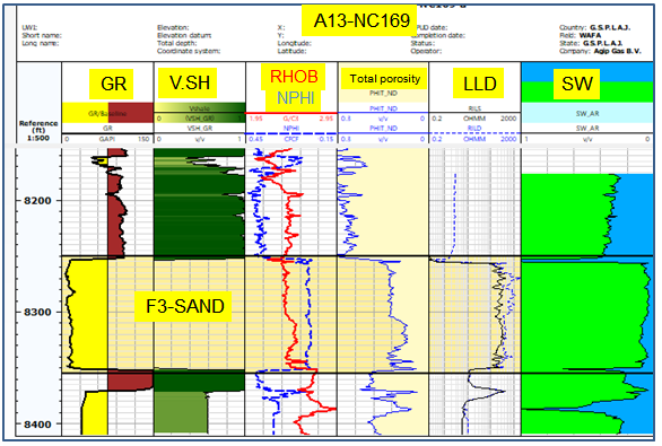
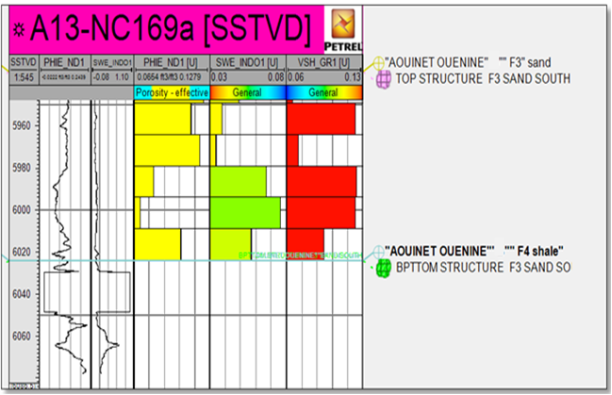
In most wells, there is a good zone as open hole logging is concerned of the F3 massive sandstones and at the base of the upper shale F3 as shown in
Figure 4.
Figure 4. Petrophysics result of wellA13.
In this study, the trap area is defined by the surface included between the Eastern extension of the upper massive reservoir unit. These limits delineate two sub-areas of trapping. A large Northern trap, also with a lobe shape limited to the East by the Wells A-12, the hydrocarbons trapped in the Wafa field correspond to light oil and gas. Due to the absence of visible structural closure in the block, the trapping is inferred from a stratigraphic origin, such as the entrapment described in the Algerian Alrar field. In the area study in the NC 169 block, the trap area is defined by the surface included between the Eastern extension of the upper massive reservoir unit. These limits delineate two sub-areas of trapping. A large northern trap, also with a lobe shape limited to the East by the Wells A-12, The reservoir quality of F3-sand in the study area varies from good reservoir quality to poor quality. The F3-sand in the North part consists of massive sandstone with medium grain size, good porosity, and low water saturation. The present hydrocarbon, as shown in
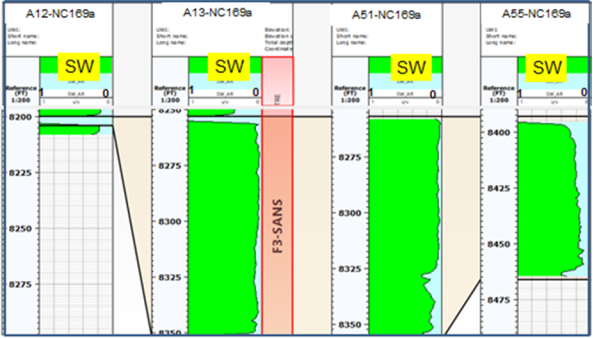
Figure 5, demonstrates F3-sand reservoir units from South to North through wells A12, A13, A50, and A51. This cross-section model built based on petrophysical analysis properties indicates the South part has the worst reservoir quality in well A12, where the F3-sand thickness in the North part is thick sand. The result of the petrophysics study also indicates the Northern part of the study area has good reservoir quality with good porosity and water saturation whereas the southern part has bad reservoir quality. The reservoir quality of F3-sand in the study area varies from good to poor quality. The F3-sand in the north part consists of massive sandstone with medium grain size, good porosity, and low water saturation.
Figure 5. Well correction of F3-sand reservoir using SW.
3.2. 3D Geological Model
In the context of workflow applications concerning subsurface interpretation and modeling, the foundational step lies in data preparation for the geological model. The 3D geological model's data compilation encompasses vital elements such as well heads, well tops, and well logs. Specifically, the data comprises the following: firstly, information on well heads, detailing the spatial placement of each well in three-dimensional space alongside the recorded depth measurements. Secondly, the inclusion of well tops, serving as indicators denoting significant points (well picks) along the well trajectory, usually signaling a stratigraphic shift. Lastly, the incorporation of well logs, encapsulates pertinent data regarding porosity and water saturation values along the wellbore trajectory.
3.3. Well Correlation
Well correlation was applied as a relatively easy method to give an idea and allow simple visualization of the changes in the thickness within Aouinet Ouenine F3 sandstone units and the change in the petrophysical properties (such as changes in porosity and water saturation) of the various units of the Aouinet Ouenine F3 sandstone reservoir. After data were entered into Petrel software, the correlation section of Wafa wells was made.
Figure 6 illustrates the vertical and horizontal variations in the thickness of F3-reservoir units. An essential instrument for interpreting three-dimensional structural features is the construction of a structure contour map, as it accurately depicts the complete 3D shape of the mapped horizon. The mapping methodologies to be examined are equally suitable for interpreting both surface and subsurface data. 3D structural maps were built for the top of the Aouinet Ouenine F3 sandstone reservoir from 3D seismic.
Figure 7 represents 3D structural modelling for the Aouinet Ouenine F3 sandstone reservoir units. This model shows that the Aouinet Ouenine F3 sandstone reservoir structure is composed of a cylindrical anticlinal fold. Structural modelling techniques were implemented to integrate the stratigraphic horizons into the pillar grid while maintaining the grid increment and fault structures. The Make Horizons process in Petrel was employed to establish the vertical layering of the 3D grid, offering a genuine three-dimensional methodology for creating a two-dimensional surface that was gridded simultaneously, with due consideration to the interplay between the surfaces.
Figure 8 signifies the horizons of the main units of the reservoir.
Figure 6. Vertical and horizontal fluctuations in the thickness of F3-reservoir units.
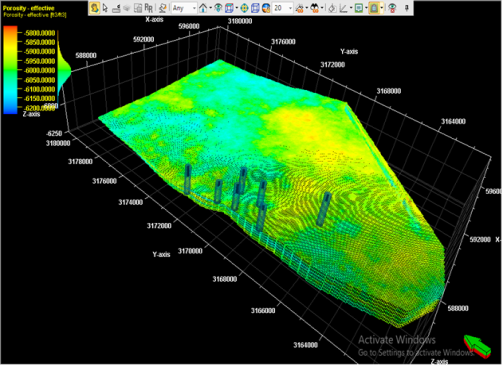
Figure 7. 3D Model of top Aouinet Ouenine F3 sandstone.
In contemporary geological studies, it is imperative to provide a precise depiction of stratified formations. Utilizing 3D geological models has become a prevailing approach to confine geological characteristics at profound levels. The individual Aouinet Ouenine F3 sandstone reservoir unit within the Wafa field has been partitioned into six stratums based on petrophysical attributes. This zone comprises six distinct layers located in the uppermost section of the formation. The process of upscaling well logs involves calculating the mean values of the cells within the 3D grid that are intersected by the wells. In each individual cell, a single value is assigned during the process of upscaling log data. These cells serve as the initial reference points for property modeling, as outlined by Schlumberger in 2017. In the representation of petrophysical properties, a 3D grid cell arrangement is employed to depict the spatial extent of the geological zone. Typically, the thickness of these cells exceeds the density of samples obtained from well logs. Consequently, prior to carrying out any modeling using well log data, it is necessary to adjust the resolution of the logs to match that of the 3D grid.
Figure 8. Scale up of F3-sand.
3.4. Petrophysical Modeling Process
The process of petrophysical property modeling entails assigning values of petrophysical properties, specifically porosity and water saturation, to individual cells within a three-dimensional grid. Petrel provides various algorithms for simulating the spatial distribution of petrophysical properties within a reservoir model. The Petrophysics model was constructed employing geostatistical techniques, with porosity and water saturation models being developed based on the refined and interpreted values obtained from porosity and water saturation assessments in the Techlog software. Sequential Gaussian porosity model of the Aouinet Ouenine F3 sandstone reservoir, as shown in
Figure 9, is characterised by high porosity values in all wells in the upper part, but lower parts of this unit showed porosity decreases of 9%. The porosity values in this zone range from 10 to 12%. The primary reservoir rock in the Dahab oil field is the Facha member, which has undergone extensive dolomitization and is composed of two distinct units - the upper Facha and the lower Facha. The Upper Facha unit is characterized by its relatively low permeability but potential presence of fractures, and is stratified into multiple layers exhibiting significant disparities in both thickness and petrophysical properties. In contrast, the lower Facha unit comprises finely crystalline dolomite showcasing notable vuggy porosity, indicative of a dual-porosity reservoir driven primarily by a network of high-permeability fractures, vugs, and solution channels. Considerable heterogeneity is observed in the thickness and petrophysical attributes of these layers, with permeability values varying from a few to several hundred millidarcies.
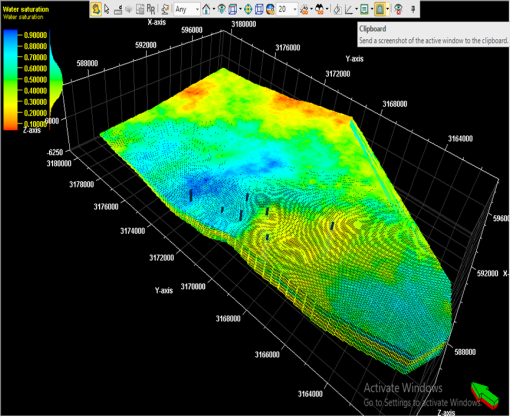
Figure 10) of the water saturation model for zone Aouinet Ouenine F3 sandstone reservoir shows moderate water saturation values that range from 0–10%, but in the South part, water saturation values reached 100%, and the zone is represented as having no reservoir unit in well A12.
Figure 9. PHIE model for top Aouinet Ouenine F3 sand.
Figure 10. SW model for top Aouinet Ouenine F3 sand.
4. Conclusion
This study provides a comprehensive evaluation of the F3 Sandstone Reservoir in the Wafa oil and gas field, Ghadames Basin, Libya, utilizing advanced 3D geological modeling and petrophysical analysis. The findings reveal significant heterogeneity in reservoir properties, with porosity levels ranging from 12% to 17% in most wells, while well A12 exhibits negligible porosity due to lithological changes. Water saturation levels vary from 30% to 45% in the northwest, increasing to 100% in the southern well A12, indicating a less promising reservoir quality in the southern region. The structural model highlights the potential for oil trapping in the F3 reservoir, with distinct facies and petrophysical variations observed across the study area. Rock typing analysis further emphasizes the heterogeneity within the F3 members, with the northern region demonstrating favorable petrophysical characteristics and porosity, making it a promising target for future hydrocarbon exploration. In contrast, the southern region exhibits poor reservoir quality, likely due to higher shale content and water saturation. The integration of 3D geological modeling and petrophysical analysis underscores the need for high-resolution seismic data to enhance reservoir characterization accuracy. This study not only advances the understanding of the F3 Sandstone Reservoir's geological and petrophysical properties but also provides a robust framework for future exploration and production strategies in the Ghadames Basin. Recommendations include acquiring high-resolution 3D seismic data to better delineate reservoir boundaries and improve the accuracy of hydrocarbon estimation, ultimately supporting sustainable resource development in the region.
Author Contributions
Muhend Milad: Conceptualization, Project administration, Visualization, Writing – original draft
Mohamed Targhi: Methodology, Resources, Software
Issa Alosta: Data curation, Formal Analysis, Investigation
Augustine Agi: Funding acquisition, Supervision, Validation, Visualization, Writing – review & editing