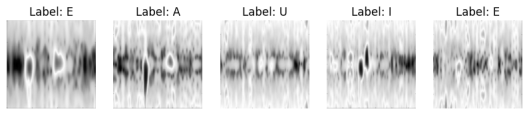
The growing interest in employing radar for human activity recognition is driven by the exponential rise in the incidence and risk of falls associated with aging, compounded by diminished leg strength, prolonged medication side effects, visual impairments, and other variables that contribute to decreasing strength. In comparison to contact devices and other non-contact devices, radar exhibits considerable advantages in terms of non-contact capability, accuracy, resilience, detection range, and privacy security. Radar-based Human Activity Recognition (HAR) works by using a Doppler frequency shift to figure out what people are doing. This shift creates unique Doppler signatures. The Doppler frequency shift is when electromagnetic waves change their frequency and wavelength depending on how fast the observer is moving compared to the source. This paper presents Radar based human activity recognition based on a convolutional neural network. Specifically, this paper utilized public datasets available by University of Glasgow, United Kingdom. The radar utilizes Novelda's X4 system-on-chip (SoC), with an integrated receiver and transmitter antenna, providing very precise distance and motion measurements. The target was located 0.45 meters from the radar at the time of data collection. The investigation makes use of PyTorch to implement classification through CNN architectures. The CNN model demonstrates effective ability to detect human activities within radar-based RF images. Although the model proves resilient it requires a larger collection of labelled data to reach higher performance standards.
| Published in | Journal of Electrical and Electronic Engineering (Volume 13, Issue 4) |
| DOI | 10.11648/j.jeee.20251304.11 |
| Page(s) | 143-153 |
| Creative Commons |
This is an Open Access article, distributed under the terms of the Creative Commons Attribution 4.0 International License (http://creativecommons.org/licenses/by/4.0/), which permits unrestricted use, distribution and reproduction in any medium or format, provided the original work is properly cited. |
| Copyright |
Copyright © The Author(s), 2025. Published by Science Publishing Group |
Human Activity Recognition, Radar, CNN Architectures, Deep Learning Model
Research Description | Methodology | Efficiency | Research Gaps/ Recommendation | Reference |
|---|---|---|---|---|
Radar-Based Human Activity Recognition Combining Range-Time-Doppler Maps and Range-Distributed-Convolutional Neural Networks | Tests were done using the "radar signatures of human activities" dataset from the University of Glasgow | The proposed model did better at identifying things | Recognition errors less frequent compared to CNNs with the same number of parameters. | [12] |
Radar Data Cube Processing for Human Activity Recognition Using Multi subspace Learning | Mult subspace Learning, PCA | Multidimensional PCA method is better than those that use predefined features | For 1D-PCA, pre-defined features, 2D-PCA, CNN, and MPCA, the average classification accuracy is 65.32%, 73.65%, 83.10%, 84.54%, and 91.4%, in that order. | [16] |
RadarSpecAugment: A Simple Data Augmentation Method for Radar-Based Human Activity Recognition | Augmentation method | Exhibits robustness across many contexts. | Their investigations revealed that the augmentation strategy enhances generalization to previously unencountered data, which is crucial for practical applications | [17] |
CMDN: Continuous Human Activity Recognition Based on Multi-domain Radar Data Fusion | short-time fractional Fourier transform (STFrFT) to map radar data into the fractional domain | Utilizing the multi-input multi-task (MIMT) recognition network, the characteristics of each domain are concurrently evaluated, and various input representations are merged to achieve continuous activity categorization results with high accuracy. | This article suggests the CMDN, which effectively gets around the problems with current methods | [18] |
HAROOD: Classifying Human Activity and Detecting Out-of-Distribution using short-range FMCW radar | Suggested a two-stage network for classification that combines triplet loss, contrastive loss, and intermediate reconstruction loss in the first stage, and cross-entropy loss in the second. | For out-of-distribution detection, an average AUROC of 95.04% and an average classification accuracy of 96.51% were obtained. | Future research could examine how this approach performs in more complicated settings and how it can be used to a wider variety of tasks. | [19] |
A metric learning method for activity recognition based on MIMO radar | Used a metric learning technique for categorization after capturing micro-doppler and angular velocity signatures using a MIMO radar. | 88.9% classification accuracy was attained for eight activities; 86.42% accuracy was attained for 10 activities using few-shot learning. | In order to improve model resilience, future research might concentrate on expanding the dataset's size and diversity and investigating how this method might be applied in practical situations. | [20] |
Real-time gesture recognition and detection using radar integrated into an edge computing platform | Created a framework for real-time data processing with a 60 GHz FMCW radar system, extracting detailed hand profiles and utilizing a shallow CNN to recognize gestures. | Displayed the capacity to accurately classify 12 gestures in real time while maintaining a high F1-score. | Future research could examine how this system can be integrated into multiple applications and evaluate how well it performs in various real-world situations. | [21] |
Human Activity Recognition (HAR) using millimeter wave radar for a medical monitoring robot | For real-time monitoring, a lightweight deep neural network system with a light-PointNet backbone and a bidirectional lightweight LSTM model was proposed for a moveable robot-mounted mmWave radar system. | Beat prior research on both continuous and discrete HAR tasks by a significant margin. | Future studies could examine how this approach is implemented in different healthcare environments and evaluate how well it functions in practical situations. | [22] |
Recognizing radar-based activities with CNN-LSTM network architecture | Used convolutional layers to train features and LSTM layers to improve temporal information in a CNN-LSTM architecture for radar micro-doppler signature picture classification. | Accuracy for training and testing data was 96.8% and 93.5%, respectively. | Future research could examine how well this architecture performs with various radar systems and investigate its application to a broader range of activities. | [23] |
Radar HAR with a Deep Learning Network based on attention | Suggested a deep learning network for radar HAR that is based on attention, with an emphasis on improving feature extraction utilizing attention mechanisms. | Showed higher recognition accuracy as compared to conventional methods. | Future studies could examine how attention mechanisms can be applied to different kinds of radar data and how well they work in various HAR tasks. | [24] |
HAR based on DenseNet and frequency-modulated continuous waves | Gathered FMCW radar point clouds, then using a DenseNet neural network to identify human activity from these readings. | For five tasks, 100% recognition accuracy was attained. | In order to evaluate the system's resilience and generalizability, future research might concentrate on testing it in increasingly complicated settings and with a wider range of tasks. | [25] |
mmWave radar-based attention-based vision transformer for classifying human activities | Used a slice segment technique and time-frequency feature representation of the micro-Doppler map to create a modified vision transformer network for radar-based HAR. | Demonstrated improved performance over conventional methods. | Future studies should examine how vision transformers can be applied to other kinds of radar data and how well they work in various HAR tasks. | [26] |
Continuous classification of human activity using Bi-LSTM networks from FMCW radar | Classified continuous human activities from FMCW radar data using Bi-LSTM networks, paying particular attention to temporal dependencies in the data. | High categorization accuracy was attained for a number of activities. | Bi-LSTM networks may be used to additional kinds of radar data in future research, and their performance in various HAR tasks may be examined. | [27] |
Classification of human activity using Deep Convolutional Neural Networks based on micro-Doppler signatures | Used deep convolutional neural networks to categorize human activity using radar-captured micro-Doppler signals. | Showed remarkable classification accuracy across a range of tasks. | Future studies could concentrate on enhancing the model's resistance to data fluctuations and investigating how it might be used in practical situations. | [28] |
Number of Subjects | Folder Name | Technology | Description | Number of Samples per Class |
|---|---|---|---|---|
1 | Subject1(M)_With Mask | Radar | Male subject pronounced the vowel and Empty Data using Mask | 300 |
Subject1(M)_Without Mask | Male subject pronounced the vowel and Empty Data using Without Mask | 300 | ||
2 | Subject2(F1) _With Mask | Radar | Female subject pronounced the vowel and Empty Data using Mask | 300 |
Subject2(F1) _Without Mask | Female subject pronounced the vowel and Empty Data using Without Mask | 300 | ||
3 | Subject2(F2) _With Mask | Radar | Female subject pronounced the vowel and Empty Data using Mask | 300 |
Subject2(F2) _Without Mask | Female subject pronounced the vowel and Empty Data using Without Mask | 300 |
HAR | Human Activity Recognition |
CNN | Convolutional Neural Network |
| [1] | D FAD (2018). Health Quality and Safety Commission, New Zealand. Falls in People Aged 50 and Over. |
| [2] | D Castro, F., Dentamaro, V., Gattulli, V., Impedovo, D. (2023). Fall Detection with LSTM and Attention Mechanism. Workshop on Advances of Mobile and Wearable Biometrics, Athens, Greece pp. 1-14. |
| [3] | D Mehta, J., Czanner, G., Harding, S., Newsham, D., Robinson, J. (2022). Visual Risk Factors for Falls in Older Aadults: a case-control study BMC Geriatr 22(1): 1-9 |
| [4] | D Usmani, S.; Saboor, A.; Haris, M.; Khan, M. A.; Park, H. (2021). Latest Research Trends in Fall Detection and Prevention Using Machine Learning: A systematic review. Sensors 21: 5134. |
| [5] | D Oumaima, G.; Hamd, A. A.; Youness, T.; Rachid, O. H. T.; Omar, B. (2021). Vision-based Fall Detection and Prevention for the Elderly People: A review and ongoing research. In Proceedings of the 2021 Fifth International Conference On Intelligent Computing in Data Sciences (ICDS), Fez, Morocco, pp. 1-6. |
| [6] | D Chaccour, K.; Darazi, R.; El Hassani, A. H.; Andres, E.(2016). From Fall Detection to Fall Prevention: A generic classification of fall-related systems. IEEE Sensor Journal 17: 812-822. |
| [7] | D Xefteris, V. R.; Tsanousa, A.; Meditskos, G.; Vrochidis, S.; Kompatsiaris, I. (2021). Performance, Challenges, and Limitations in Multimodal Fall Detection Systems: A review. IEEE Sensor Journal 21: 18398-18409. |
| [8] | D Paullada, A., Raji, I. D., Bender, E. M., Denton, E., Hanna, A. (2021). Data and its (dis) contents: A survey of dataset development and use in machine learning research. Patterns 2(11): 100336. |
| [9] | D Renggli, C., Rimanic, L., Gürel, N. M., Karlaš, B., Wu, W., Zhang, C. (2021). A Data Quality-Driven View of MLOps. Data Engineering pp. 11. |
| [10] | D Umer, M. et al. (2024) ‘Enhancing fall prediction in the elderly people using LBP features and Transfer learning model’, Image and Vision Computing, 145, p. 104992. |
| [11] | Y. Yao, W. Liu, G. Zhang, and W. Hu, “Radar-based human activity recognition using hyperdimensional computing,” IEEE Transactions on Microwave Theory and Techniques, vol. 70, no. 3, pp. 1605-1619, Mar. 2022. |
| [12] | W.-Y. Kim and D.-H. Seo, “Radar-based human activity recognition combining range-time-doppler maps and range-distributed-convolutional neural networks,” IEEE Transactions on Geoscience and Remote Sensing, vol. 60, pp. 1-11, 2022. |
| [13] | F. Ayaz et al., Radar Signal Processing and its impact on Deep Learning-driven human activity recognition, Dec. 2024. |
| [14] | H. Cui, “Human activity recognition using millimetre-wave radars with machine learning,” University of Bristol. |
| [15] | Hameed, H., Usman, M., Tahir, A., Hussain, A., Abbas, H., Cui, TJ., Imran, M. and Abbasi, Q. (2022), Pushing the Limits of Remote RF Sensing: Reading Lips Under Face Mask, University of Glasgow |
| [16] | B. Erol and M. G. Amin, “Radar Data Cube processing for human activity recognition using Multisubspace learning,” IEEE Transactions on Aerospace and Electronic Systems, vol. 55, no. 6, pp. 3617-3628, Dec. 2019. |
| [17] | D. She, X. Lou, and W. Ye, “Radarspecaugment: A simple data augmentation method for radar-based human activity recognition,” IEEE Sensors Letters, vol. 5, no. 4, pp. 1-4, Apr. 2021. |
| [18] | X. Feng, P. Chen, Y. Weng, and H. Zheng, “CMDN: Continuous human activity recognition based on Multi-domain Radar Data Fusion,” IEEE Sensors Journal, pp. 1-1, 2025. |
| [19] | K. S. Mustafa, M. S. Yavuz, and E. Steinbach, “HAROOD: Human Activity Classification and Out-of-Distribution Detection with Short-Range FMCW Radar,” arXiv (Cornell University), Jan. 2023, |
| [20] | F. Aziz, O. Metwally, P. Weller, U. Schneider, and M. F. Huber, “A MIMO Radar-Based Metric Learning Approach for Activity Recognition,” arXiv (Cornell University), Jan. 2021, |
| [21] | Y. Sun, T. Fei, X. Li, A. Warnecke, Ernst Warsitz, and N. Pohl, “Real-Time Radar-Based Gesture Detection and Recognition Built in an Edge-Computing Platform,” IEEE Sensors Journal, vol. 20, no. 18, pp. 10706-10716, Sep. 2020, |
| [22] |
Z. Gu, X. He, G. Fang, C. Xu, F. Xia, and W. Jia, “Millimeter Wave Radar-based Human Activity Recognition for Healthcare Monitoring Robot,” arXiv.org, 2024.
https://arxiv.org/abs/2405.01882 (accessed Feb. 02, 2025). |
| [23] | Dr. A. H. Victoria, S. V. Manikanthan, Dr. V. H R, M. A. Wildan, and K. H. Kishore, “Radar Based Activity Recognition using CNN-LSTM Network Architecture,” International Journal of Communication Networks and Information Security (IJCNIS), vol. 14, no. 3, pp. 303-312, Jan. 2023, |
| [24] | S. Huan, L. Wu, M. Zhang, Z. Wang, and C. Yang, “Radar Human Activity Recognition with an Attention-Based Deep Learning Network,” Sensors, vol. 23, no. 6, p. 3185, Mar. 2023, |
| [25] | W. Jiang et al., “Human Activity Recognition Based on Frequency-Modulated Continuous Wave and DenseNet,” Journal of Computer and Communications, vol. 11, no. 07, pp. 15-28, Jan. 2023, |
| [26] | Z. Wang, S. Huan, L. Wu, Q. Wang, J. Liu, and Z. Hu, “Attention-based Vision Transformer for Human Activity Classification using mmWave Radar,” pp. 128-134, Nov. 2022, |
| [27] | Z. Li, X. Liu, T. Wang, W. He, and C. Xia, “GHSCN: A Graph Neural Network-Based API Popularity Prediction Method in Service Ecosystem,” IEEE Access, vol. 8, pp. 137032-137051, Jan. 2020, |
| [28] | L. Barbato, A. Formisano, R. Martone, and F. Villone, “Error Field Impact on Plasma Boundary in ITER Scenarios,” IEEE Transactions on Magnetics, vol. 52, no. 3, pp. 1-4, Sep. 2015, |
| [29] | D. Weyer et al., “Design considerations for Integrated Radar Chirp synthesizers,” IEEE Access, vol. 7, pp. 13723-13736, 2019. |
APA Style
Aina, T. S. (2025). Feasibility Study on Radar-based Human Activity Recognition. Journal of Electrical and Electronic Engineering, 13(4), 143-153. https://doi.org/10.11648/j.jeee.20251304.11
ACS Style
Aina, T. S. Feasibility Study on Radar-based Human Activity Recognition. J. Electr. Electron. Eng. 2025, 13(4), 143-153. doi: 10.11648/j.jeee.20251304.11
@article{10.11648/j.jeee.20251304.11,
  author = {Taiwo Samuel Aina},
  title = {Feasibility Study on Radar-based Human Activity Recognition
},
  journal = {Journal of Electrical and Electronic Engineering},
  volume = {13},
  number = {4},
  pages = {143-153},
  doi = {10.11648/j.jeee.20251304.11},
  url = {https://doi.org/10.11648/j.jeee.20251304.11},
  eprint = {https://article.sciencepublishinggroup.com/pdf/10.11648.j.jeee.20251304.11},
  abstract = {The growing interest in employing radar for human activity recognition is driven by the exponential rise in the incidence and risk of falls associated with aging, compounded by diminished leg strength, prolonged medication side effects, visual impairments, and other variables that contribute to decreasing strength. In comparison to contact devices and other non-contact devices, radar exhibits considerable advantages in terms of non-contact capability, accuracy, resilience, detection range, and privacy security. Radar-based Human Activity Recognition (HAR) works by using a Doppler frequency shift to figure out what people are doing. This shift creates unique Doppler signatures. The Doppler frequency shift is when electromagnetic waves change their frequency and wavelength depending on how fast the observer is moving compared to the source. This paper presents Radar based human activity recognition based on a convolutional neural network. Specifically, this paper utilized public datasets available by University of Glasgow, United Kingdom. The radar utilizes Novelda's X4 system-on-chip (SoC), with an integrated receiver and transmitter antenna, providing very precise distance and motion measurements. The target was located 0.45 meters from the radar at the time of data collection. The investigation makes use of PyTorch to implement classification through CNN architectures. The CNN model demonstrates effective ability to detect human activities within radar-based RF images. Although the model proves resilient it requires a larger collection of labelled data to reach higher performance standards.},
 year = {2025}
}
TY  - JOUR
T1  - Feasibility Study on Radar-based Human Activity Recognition

AU  - Taiwo Samuel Aina
Y1  - 2025/07/04
PY  - 2025
N1  - https://doi.org/10.11648/j.jeee.20251304.11
DO  - 10.11648/j.jeee.20251304.11
T2  - Journal of Electrical and Electronic Engineering
JF  - Journal of Electrical and Electronic Engineering
JO  - Journal of Electrical and Electronic Engineering
SP  - 143
EP  - 153
PB  - Science Publishing Group
SN  - 2329-1605
UR  - https://doi.org/10.11648/j.jeee.20251304.11
AB  - The growing interest in employing radar for human activity recognition is driven by the exponential rise in the incidence and risk of falls associated with aging, compounded by diminished leg strength, prolonged medication side effects, visual impairments, and other variables that contribute to decreasing strength. In comparison to contact devices and other non-contact devices, radar exhibits considerable advantages in terms of non-contact capability, accuracy, resilience, detection range, and privacy security. Radar-based Human Activity Recognition (HAR) works by using a Doppler frequency shift to figure out what people are doing. This shift creates unique Doppler signatures. The Doppler frequency shift is when electromagnetic waves change their frequency and wavelength depending on how fast the observer is moving compared to the source. This paper presents Radar based human activity recognition based on a convolutional neural network. Specifically, this paper utilized public datasets available by University of Glasgow, United Kingdom. The radar utilizes Novelda's X4 system-on-chip (SoC), with an integrated receiver and transmitter antenna, providing very precise distance and motion measurements. The target was located 0.45 meters from the radar at the time of data collection. The investigation makes use of PyTorch to implement classification through CNN architectures. The CNN model demonstrates effective ability to detect human activities within radar-based RF images. Although the model proves resilient it requires a larger collection of labelled data to reach higher performance standards.
VL  - 13
IS  - 4
ER  -
School of Computer Science and Technology, University of Bedfordshire, Luton, United Kingdom
Biography: Taiwo Samuel Aina is currently pursuing the Ph.D. degree in electronic engineering with University of Bedfordshire, Luton, United Kingdom. His current research interests include human activity recognition, radar signal processing, deep learning, and fusion of sensing technologies. He received MSc. degrees in electronic engineering with Project Management from University of Bedfordshire, Luton, United Kingdom, in 2023 and the M. Eng. degree from the Department of Electrical and Electronics Engineering, University of Benin, Nigeria, in 2016. Since 2022, He has been working with the Bedford College Group, United Kingdom as Electrical installation, Electronics and mathematics Lecturer.
Information