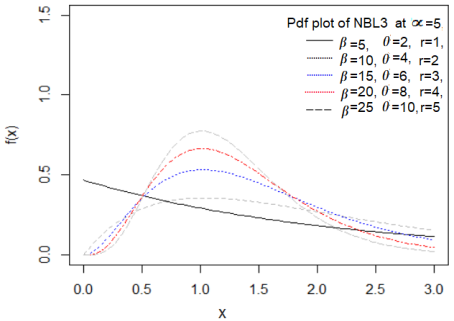
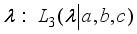
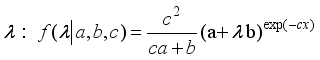
Many researchers have proposed mixed distributions as one of the most important methods for obtaining new probability distributions. Several studies have shown that mixed Negative Binomial distributions fits count data better than Poisson and Negative Binomial distribution itself. In this paper, we introduce a mixed distribution by mixing the distributions of negative binomial and three Parameter Lindley distribution. This new distribution has a thick tail and may be considered as an alternative for fitting count data with over dispersion. The parameters of the new distribution are estimated using MLE method and properties studied. Special cases of the new distribution and also identified. A simulation study carried out shows that the ML estimators give the parameter estimates close to the parameter when the sample is large, that is, the bias and variance of the parameter estimates decrease with increase in sample size showing the consistent nature of the new compound distribution. The study also compares the performance of the new distribution over distributions of Poisson, Negative Binomial, Negative Binomial oneParameter Lindley Distribution, Negative Binomial two Parameter distribution, three parameter Lindley distribution using a real count over dispersed dataset and the results shows that Negative Binomial three parameter Lindley distribution gave the smallest Kolmogorov Smirnov test statistic, AIC and BIC as compared to other distributions, hence the new distribution provided a better fit compared to other distributions under study for fitting over dispersed count data.
| Published in | International Journal of Theoretical and Applied Mathematics (Volume 10, Issue 1) |
| DOI | 10.11648/j.ijtam.20241001.11 |
| Page(s) | 1-5 |
| Creative Commons |
This is an Open Access article, distributed under the terms of the Creative Commons Attribution 4.0 International License (http://creativecommons.org/licenses/by/4.0/), which permits unrestricted use, distribution and reproduction in any medium or format, provided the original work is properly cited. |
| Copyright |
Copyright © The Author(s), 2024. Published by Science Publishing Group |
Overdispersion, Negative Binomial Distribution, Lindley Distribution
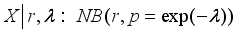
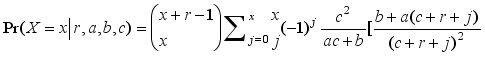


 .
. 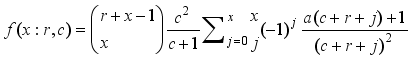 ,x=0,1,2…
 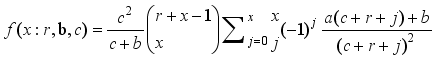 ,x=0,1,2…
 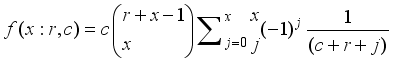 ,x=0,1,2…
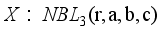
 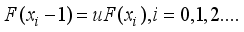 , then X=xi
| c=3 | a=4 | b=2 | r=5 | ||||
|---|---|---|---|---|---|---|---|---|
Bias (c) | Var (c) | Bias (a) | Var (a) | Bias (b) | Var (b) | Bias (r) | Var (r) | |
50 | 0.64619 | 0.51673 | 1.87777 | 3.52602 | 1.20045 | 1.46335 | 1.27721 | 1.56335 |
100 | 0.58956 | 0.37721 | 1.60015 | 2.65715 | 1.19996 | 1.44537 | 1.15996 | 1.44557 |
200 | 0.23850 | 0.06977 | 1.03593 | 1.23732 | 0.69749 | 0.50399 | 0.65745 | 0.50399 |
300 | 0.21259 | 0.05419 | 0.05419 | 0.82120 | 0.49964 | 0.25864 | 0.45964 | 0.25564 |
Number of claims | Observed Values | Poisson | Negative Binomial | Negative Binomial one Parameter Lindley | Negative Binomial two Parameter Lindley | Three parameter Lindley | Negative Binomial three parameter Lindley |
|---|---|---|---|---|---|---|---|
0 | 7,840 | 7,635.27 | 7,846.64 | 7,763.54 | 7,796.23 | 7,811.55 | 7,837.40 |
1 | 1,317 | 1,637.00 | 1,288.58 | 1,356.39 | 1,361.03 | 1,346.35 | 1,326.20 |
2 | 239 | 175.49 | 256.64 | 241.98 | 205.80 | 244.61 | 226.34 |
3 | 42 | 12.54 | 54.10 | 44.29 | 30.25 | 46.67 | 48.74 |
4 | 14 | 0.67 | 11.72 | 8.31 | 4.45 | 9.32 | 14.03 |
5 | 4 | 0.03 | 2.58 | 1.60 | 0.66 | 1.94 | 4.97 |
6 | 4 | 0.00 | 0.57 | 0.31 | 0.10 | 0.42 | 1.95 |
7 | 1 | 0.00 | 0.13 | 0.06 | 0.02 | 0.10 | 0.79 |
Estimated Values of parameters |
| P=0.7659 r=0.7015 | r=30.4775 c=143.966 | r=21.7015 a= 1.4737 c=162.372 | b= 21.7876 a=1.4737 c=162.372 | r=4.8261 a=1.8355 b=12.1718 c=48.1251 | |
-l | 5,590.78 | 5,396.31 | 5,396.29 | 5,431.77 | 5,348.97 | 5,341.93 | |
KS test | 0.0216 | 0.0022 | 0.0081 | 0.0031 | 0.0066 | 0.0007 | |
(p-value) | (0.0003) | (0.9999) | (0.5669) | (0.8039) | (0.9999) | (0.9999) | |
AIC | 857.49 | 857.41 | 857.32 | 857.31 | 857.01 | 855.06 | |
BIC | 865.78 | 865.71 | 864.67 | 864.15 | 864.14 | 859.20 | |
| [1] | Elbatal, I., Merovci, F. & Elgarhy, M. (2013) A new generalized Lindley distribution. Mathematical Theory and Modeling, 3(13), 30-47. |
| [2] | Gencturk, Y. & Yi ¨ giter, A. (2016) Modelling claim number using a new mixture ˘ model: negative binomial gamma distribution. Journal of Statistical Computation and Simulation, 86(10), 1829-1839. |
| [3] | Ghitany, M. E., Atieh, B. & Nadarajah, S. (2008) Lindley distribution and its application. Mathematics and Computers in Simulation, 78(4), 493-506. |
| [4] | Gomez-D ´ eniz, E., Sarabia, J. M. & Calder´ın-Ojeda, E. (2008). Univariate and multivariate versions of the negative binomial-inverse Gaussian distributions with applications. Insurance: Mathematics and Economics, 42(1), 39-49. |
| [5] | Greenwood, M. & Yule, G. U. (1920). An inquiry into the nature of frequency distributions representative of multiple happenings with particular reference to the occurrence of multiple attacks of disease or of repeated accidents. Journal of the Royal Statistical Society, 83(2), 255-279. |
| [6] | Hamid, H. (2014) Integrated Smoothed Location Model and Data Reduction Approaches for Multi Variables Classification (Unpublished doctoral dissertation). Universiti Utara Malaysia, Kedah, Malaysia. |
| [7] | Haight, F. (1967). Handbook of the Poisson distribution. John Wiley and Sons, New York. |
| [8] | Jambunathan M. B. (1954). Some properties of beta and gamma distributions. The annals of mathematical statistics. 25(2), 401-405. |
| [9] | Klugman, S. A., Panjer H. H. & Willmot G. E. (2008). Loss Models: From Data to Decision. 3rd Edn., John Wiley and Sons, USA: 101-159. |
| [10] | Kongrod, S., Bodhisuwan, W., & Payakkapong, P. (2014). The negative binomialErlang distribution with applications. International Journal of Pure and Applied Mathematics, 92(3), 389-401. |
| [11] | Lindley, D. V. (1958). Fiducial distributions and Bayes’ theorem. Journal of the Royal Statistical Society. Series B (Methodological), 20(1), 102-107. |
| [12] | Pudprommarat, C., Bodhisuwan, W., & Zeephongsekul, P. (2012). A new mixed negative binomial distribution. Journal of Applied Sciences (Faisalabad), 12(17), 1853-1858. |
| [13] | Marsaglia, G., Tsang, W. W. & Wang, J. (2003), Evaluating Kolmogorov’s distribution. Journal of Statistical Software, 8(18), 1-4. |
| [14] | Panjer, H. H. & Willmot, G. E. (1981). Finite sum evaluation of the negative binomial-exponential model. ASTIN Bulletin: The Journal of the IAA, 12(2), 133- 137. |
| [15] | Rainer, W. (2000). Econometric Analysis of Count Data, 3rd edn, Springer Verlag, Berlin, Germany. |
| [16] | Sankaran, M. (1970). The discrete Poisson-Lindley distribution, Biometrics, 26(1), 145-149. |
| [17] | Wang, Z. (2011). On mixed negative binomial distribution with application. Journal of Statistical Planning and Inference, 141(3), 1153-1160. |
| [18] | Zamani, H. & Ismail, N. (2010). Negative binomial-Lindley distribution and its application. Journal of Mathematics and Statistics, 6(1), 4-9. |
APA Style
Anjela, W., Muhua, G. (2024). Negative Binomial Three Parameter Lindley Distribution and Its Properties. International Journal of Theoretical and Applied Mathematics, 10(1), 1-5. https://doi.org/10.11648/j.ijtam.20241001.11
ACS Style
Anjela, W.; Muhua, G. Negative Binomial Three Parameter Lindley Distribution and Its Properties. Int. J. Theor. Appl. Math. 2024, 10(1), 1-5. doi: 10.11648/j.ijtam.20241001.11
AMA Style
Anjela W, Muhua G. Negative Binomial Three Parameter Lindley Distribution and Its Properties. Int J Theor Appl Math. 2024;10(1):1-5. doi: 10.11648/j.ijtam.20241001.11
@article{10.11648/j.ijtam.20241001.11,
  author = {Wanjala Anjela and George Muhua},
  title = {Negative Binomial Three Parameter Lindley Distribution and Its Properties
},
  journal = {International Journal of Theoretical and Applied Mathematics},
  volume = {10},
  number = {1},
  pages = {1-5},
  doi = {10.11648/j.ijtam.20241001.11},
  url = {https://doi.org/10.11648/j.ijtam.20241001.11},
  eprint = {https://article.sciencepublishinggroup.com/pdf/10.11648.j.ijtam.20241001.11},
  abstract = {Many researchers have proposed mixed distributions as one of the most important methods for obtaining new probability distributions. Several studies have shown that mixed Negative Binomial distributions fits count data better than Poisson and Negative Binomial distribution itself. In this paper, we introduce a mixed distribution by mixing the distributions of negative binomial and three Parameter Lindley distribution. This new distribution has a thick tail and may be considered as an alternative for fitting count data with over dispersion. The parameters of the new distribution are estimated using MLE method and properties studied. Special cases of the new distribution and also identified. A simulation study carried out shows that the ML estimators give the parameter estimates close to the parameter when the sample is large, that is, the bias and variance of the parameter estimates decrease with increase in sample size showing the consistent nature of the new compound distribution. The study also compares the performance of the new distribution over distributions of Poisson, Negative Binomial, Negative Binomial oneParameter Lindley Distribution, Negative Binomial two Parameter distribution, three parameter Lindley distribution using a real count over dispersed dataset and the results shows that Negative Binomial three parameter Lindley distribution gave the smallest Kolmogorov Smirnov test statistic, AIC and BIC as compared to other distributions, hence the new distribution provided a better fit compared to other distributions under study for fitting over dispersed count data.
},
 year = {2024}
}
TY  - JOUR
T1  - Negative Binomial Three Parameter Lindley Distribution and Its Properties

AU  - Wanjala Anjela
AU  - George Muhua
Y1  - 2024/06/14
PY  - 2024
N1  - https://doi.org/10.11648/j.ijtam.20241001.11
DO  - 10.11648/j.ijtam.20241001.11
T2  - International Journal of Theoretical and Applied Mathematics
JF  - International Journal of Theoretical and Applied Mathematics
JO  - International Journal of Theoretical and Applied Mathematics
SP  - 1
EP  - 5
PB  - Science Publishing Group
SN  - 2575-5080
UR  - https://doi.org/10.11648/j.ijtam.20241001.11
AB  - Many researchers have proposed mixed distributions as one of the most important methods for obtaining new probability distributions. Several studies have shown that mixed Negative Binomial distributions fits count data better than Poisson and Negative Binomial distribution itself. In this paper, we introduce a mixed distribution by mixing the distributions of negative binomial and three Parameter Lindley distribution. This new distribution has a thick tail and may be considered as an alternative for fitting count data with over dispersion. The parameters of the new distribution are estimated using MLE method and properties studied. Special cases of the new distribution and also identified. A simulation study carried out shows that the ML estimators give the parameter estimates close to the parameter when the sample is large, that is, the bias and variance of the parameter estimates decrease with increase in sample size showing the consistent nature of the new compound distribution. The study also compares the performance of the new distribution over distributions of Poisson, Negative Binomial, Negative Binomial oneParameter Lindley Distribution, Negative Binomial two Parameter distribution, three parameter Lindley distribution using a real count over dispersed dataset and the results shows that Negative Binomial three parameter Lindley distribution gave the smallest Kolmogorov Smirnov test statistic, AIC and BIC as compared to other distributions, hence the new distribution provided a better fit compared to other distributions under study for fitting over dispersed count data.

VL  - 10
IS  - 1
ER  -
Department of Mathematics, Faculty of Science and Technology, University Nairobi, Nairobi, Kenya
Department of Mathematics, Faculty of Science and Technology, University Nairobi, Nairobi, Kenya; Department of Mathematics, University Nairobi, Nairobi, Kenya
Information