Abstract
Monitoring vegetation and hydrological dynamics in semi-arid ecosystems is critical for understanding responses to climate variability and anthropogenic pressures. This study employs multi-temporal Landsat satellite imagery (1985–2024) to examine spatiotemporal changes in the Normalized Difference Vegetation Index (NDVI) and Normalized Difference Water Index (NDWI) across three ecologically distinct localities—Al-Kayari, Alidedat, and Elsefia—within the Gadarif State, eastern Sudan. Image processing and spectral index computation were performed using Google Earth Engine (GEE) and ArcGIS Pro v3.4.0. NDVI analysis revealed a progressive increase in healthy vegetation cover (NDVI ≥ 0.3) in Elsefia (approximately 63 km2 by 2024) and Alidedat (approximately 105 km2 by 2024), indicating a positive greening trend over the study period. Conversely, Al-Kayari maintained comparatively drier conditions with persistently sparse vegetation. Parallel NDWI analysis demonstrated enhanced surface moisture and expanded flooded vegetation zones in Elsefia and Alidedat since the mid-1990s, while Al-Kayari continued to exhibit relatively low moisture availability. Pearson correlation analysis between NDVI and NDWI yielded a moderate positive coefficient (r = 0.63, R2 = 0.40, p < 0.001), confirming coupled vegetation–moisture dynamics. These findings suggest a partial ecological recovery consistent with documented Sahel re-greening, potentially driven by rainfall variability, land use shifts, and hydrological feedbacks. The results provide a quantitative baseline for evidence-based land management, drought early warning, and climate adaptation planning in the semi-arid Gadarif region.
Keywords
Semi-arid Sudan, Remote Sensing, NDVI, NDWI, Sahel Re-greening, Gadarif, Drought Monitoring, Land Use Change
1. Introduction
Semi-arid regions occupy approximately 17.7% of the Earth’s land surface and support a disproportionately large share of the world’s rural population engaged in rain-fed agriculture and pastoralism
| [15] | Millennium Ecosystem Assessment (2005). Ecosystems and Human Well-being: Desertification Synthesis. World Resources Institute, Washington, DC. |
[15]
. These regions are inherently vulnerable to climatic variability, episodic drought, and land degradation, making continuous ecological monitoring an imperative for sustainable resource management. In sub-Saharan Africa, the Sahel and adjacent semi-arid zones have experienced dramatic land cover transitions over recent decades, driven by fluctuating rainfall patterns, population growth, agricultural expansion, and changing land use practices
| [2] | Anyamba, A., & Tucker, C. J. (2012). Analysis of Sahelian vegetation dynamics using NOAA-AVHRR NDVI data from 1981–2003. Journal of Arid Environments, 63(3), 596–614. https://doi.org/10.1016/j.jaridenv.2005.03.007 |
| [8] | Herrmann, S. M., Anyamba, A., & Tucker, C. J. (2005). Recent trends in vegetation dynamics in the African Sahel and their relationship to climate. Global Environmental Change, 15(4), 394–404. https://doi.org/10.1016/j.gloenvcha.2005.08.004 |
[2, 8]
.
Remote sensing (RS) and geographic information systems (GIS) have emerged as indispensable tools for the synoptic, cost-effective, and repeatable assessment of landscape dynamics
| [4] | Cova, T. J. (1999). GIS in emergency management. In: P. Longley, M. Goodchild, D. Maguire & D. Rhind (Eds.), Geographical Information Systems: Principles, Techniques, Management and Applications (2nd ed., pp. 845–858). Wiley. |
| [11] | Jensen, J. R. (2016). Introductory Digital Image Processing: A Remote Sensing Perspective (4th ed.). Pearson Prentice Hall. |
[4, 11]
. Among spectral indices derived from satellite imagery, the Normalized Difference Vegetation Index (NDVI) is the most widely applied proxy for vegetation density, biomass, and photosynthetic activity
| [17] | Rouse, J. W., Haas, R. H., Schell, J. A., & Deering, D. W. (1974). Monitoring vegetation systems in the Great Plains with ERTS. Proceedings of the Third ERTS Symposium, NASA SP-351(1), 309–317. |
| [21] | Tucker, C. J. (1979). Red and photographic infrared linear combinations for monitoring vegetation. Remote Sensing of Environment, 8(2), 127–150.
https://doi.org/10.1016/0034-4257(79)90013-0 |
[17, 21]
, while the Normalized Difference Water Index (NDWI) serves as a reliable indicator of vegetation water content and surface moisture
. Jointly, these indices provide complementary information on both the structural and hydrological dimensions of terrestrial ecosystems.
The Gadarif State, located in eastern Sudan, typifies the complex socio-ecological challenges confronting semi-arid Africa. Situated within the Tekeze-Atbara-Setit sub-basin, the region supports a mosaic of rain-fed mechanized agriculture, nomadic pastoralism, and remnant savanna woodland, all operating under a highly variable rainfall regime (400–900 mm yr⁻
1). Despite its ecological and economic importance, systematic long-term analyses of vegetation and hydrological change in Gadarif remain limited in peer-reviewed literature. Previous studies in comparable semi-arid contexts have demonstrated vegetation recovery in the Sahel following the droughts of the 1970s–1980s
| [2] | Anyamba, A., & Tucker, C. J. (2012). Analysis of Sahelian vegetation dynamics using NOAA-AVHRR NDVI data from 1981–2003. Journal of Arid Environments, 63(3), 596–614. https://doi.org/10.1016/j.jaridenv.2005.03.007 |
| [5] | Dardel, C., Kergoat, L., Hiernaux, P., Mougin, E., Grippa, M., & Tucker, C. J. (2014). Re-greening Sahel: 30 years of remote sensing data and field observations (Mali, Niger). Remote Sensing of Environment, 140, 350–364.
https://doi.org/10.1016/j.rse.2013.09.011 |
[2, 5]
and have highlighted the utility of multi-temporal NDVI and NDWI in delineating drought severity and land degradation
| [3] | Bhuiyan, C., Singh, R. P., & Kogan, F. N. (2006). Monitoring drought dynamics in the Aravalli region (India) using different indices based on ground and remote-sensing data. International Journal of Applied Earth Observation and Geoinformation, 8(4), 289–302. https://doi.org/10.1016/j.jag.2006.03.002 |
| [16] | Rismayatika, R., Yati, S., & Hidayat, R. (2020). Land use change analysis using NDVI satellite image classification in Bongaigaon and Goalpara districts, Assam, India. IOP Conference Series: Earth and Environmental Science, 423, 012044. https://doi.org/10.1088/1755-1315/423/1/012044 |
[3, 16]
.
This study addresses this knowledge gap by conducting a four-decade (1985–2024) multi-temporal analysis of NDVI and NDWI across three representative localities within the Gadarif semi-arid zone. The specific objectives are: (i) to quantify spatiotemporal changes in vegetation cover and health using NDVI; (ii) to assess temporal shifts in surface moisture and flooded vegetation extent using NDWI; (iii) to investigate the statistical relationship between NDVI and NDWI as coupled indicators of ecosystem status; and (iv) to interpret the observed trends in relation to regional climatic and anthropogenic drivers.
2. Study Area
Gadarif State (latitudes 13°59′–15°N; longitudes 34°04′–35°02′E) is located in eastern Sudan within the semi-desert grassland and low-rainfall woodland savanna ecological zones. The state falls within the Tekeze-Atbara-Setit sub-basin, covering approximately 230,000 km2, a drainage system originating in the north-central highlands of Ethiopia and comprising the Tekeze/Setit river and its tributaries, the Goang/Atbara and Angereb. The regional climate is characterised by a unimodal rainfall pattern concentrated between June and October, influenced by the northward migration of the Inter-Tropical Convergence Zone (ITCZ).
Three agro-ecological zones are recognised: the northern zone (rainfall < 500 mm yr⁻1), dominated by pastoral sheep production and limited cropping; the central zone (500–600 mm yr⁻1), supporting mixed farming systems; and the southern zone (600–900 mm yr⁻1), characterised by large-scale mechanised rain-fed cultivation of sorghum and sesame.
Site Selection: Three villages were selected to represent the spatial heterogeneity of the Butana landscape:
(1) Al-Kayari (central Butana; UTM: N 1,691,351 / E 701,332 to N 1,686,076 / E 714,718): a geomorphologically homogeneous landscape of mixed tree and shrub savanna.
(2) Alidedat (southern Butana; UTM: N 1,632,707 / E 688,576 to N 1,632,885 / E 633,364): characterised by numerous wadis and seasonal creeks; predominantly rangeland with high pastoral significance.
(3) Elsefia (northern Butana; UTM: N 1,701,878 / E 686,061 to N 1,701,937 / E 686,010): an important dryland grazing area with diverse browsing trees and shrubs distributed along seasonal valley systems.
3. Data and Methods
3.1. Satellite Data Acquisition
Multi-temporal Landsat satellite imagery was acquired for five time steps (1985, 1995, 2005, 2015, and 2024) from the United States Geological Survey (USGS) Earth Resources Observation and Science (EROS) Center
| [14] | Meyer, V., Scheuer, S., & Haase, D. (2009). A multicriteria approach for flood risk mapping exemplified at the Mulde river, Germany. Natural Hazards, 48(1), 17–39.
https://doi.org/10.1007/s11069-008-9244-4 |
[14]
. All images were acquired during the post-rainy season (October) to minimise phenological variability and cloud contamination. Imagery specifications are summarised in
Table 1.
Table 1. Landsat imagery characteristics used in the study.
Year | Satellite | Sensor | Acquisition Date | WRS Path/Row | Bands Used |
1985 | Landsat 5 | TM | 05 Oct 1985 | 172/50, 171/50, 172/49 | Bands 1–7 |
1995 | Landsat 5 | TM+ | 09 Oct 1995 | 172/50, 171/50, 172/49 | Bands 1–7 |
2005 | Landsat 7 | ETM+ | 13 Oct 2005 | 172/50, 171/50, 172/49 | Bands 1–8, Pan, QA |
2015 | Landsat 8 | OLI/TIRS | 05 Oct 2015 | 172/50, 171/50, 172/49 | Bands 1–11 |
2024 | Landsat 9 | OLI-2/TIRS-2 | 02 Oct 2024 | 172/50, 171/50, 172/49 | Bands 1–11 |
3.2. Spectral Index Computation
3.2.1. Normalized Difference Vegetation Index (NDVI)
NDVI is a dimensionless index that exploits the contrasting spectral response of healthy vegetation, which absorbs red radiation through chlorophyll while strongly reflecting near-infrared (NIR) radiation through its cellular structure
| [6] | Deering, D. W. (1978). Rangeland reflectance characteristics measured by aircraft and spacecraft sensors. PhD Dissertation. Texas A&M University, College Station, TX. |
| [12] | Kienberger, S. (2012). Spatial modelling of social and economic vulnerability to floods at the district level in Búzi, Mozambique. Natural Hazards, 64(3), 2001–2019.
https://doi.org/10.1007/s11069-012-0168-6 |
| [21] | Tucker, C. J. (1979). Red and photographic infrared linear combinations for monitoring vegetation. Remote Sensing of Environment, 8(2), 127–150.
https://doi.org/10.1016/0034-4257(79)90013-0 |
[6, 12, 21]
. It is calculated as:
NDVI = (NIR − RED) / (NIR + RED)
For Landsat 8/9 imagery, Band 5 (NIR; 0.85–0.88 μm) and Band 4 (Red; 0.64–0.67 μm) were used. For Landsat 5/7, the equivalent Band 4 (NIR) and Band 3 (Red) were employed. NDVI values range from −1 to +1; values ≤0 indicate non-vegetated surfaces, 0–0.3 indicate sparse or stressed vegetation, and values >0.3 indicate moderate-to-dense healthy vegetation
| [16] | Rismayatika, R., Yati, S., & Hidayat, R. (2020). Land use change analysis using NDVI satellite image classification in Bongaigaon and Goalpara districts, Assam, India. IOP Conference Series: Earth and Environmental Science, 423, 012044. https://doi.org/10.1088/1755-1315/423/1/012044 |
[16]
. For this study, four thematic classes were defined:
Table 2. NDVI classification scheme applied in this study.
NDVI Range | Class | Land Cover Interpretation |
−1.0 to −0.3 | Severe drought / bare land | Exposed soil, rock, built-up surfaces |
−0.3 to 0.0 | Moderate drought / very sparse vegetation | Degraded rangeland, dry soil |
0.0 to 0.3 | Mild drought / sparse vegetation | Open rangeland, shrub savanna |
0.3 to 1.0 | No drought / healthy vegetation | Agriculture, flooded vegetation, woodland |
3.2.2. Normalized Difference Water Index (NDWI)
The NDWI developed by
quantifies the water content of vegetation canopies by combining NIR reflectance, which responds to leaf internal structure, with shortwave infrared (SWIR) reflectance, which is sensitive to liquid water absorption. The index is expressed as:
NDWI = (ρNIR − ρSWIR) / (ρNIR + ρSWIR)
For Landsat 8/9, Band 5 (NIR; 0.85–0.88 μm) and Band 7 (SWIR-2; 2.11–2.29 μm) were employed. Band 7 was preferred over Band 6 (SWIR-1) because of its greater sensitivity to vegetation water content and lower susceptibility to atmospheric scattering at longer wavelengths
| [18] | Roy, D. P., Wulder, M. A., Loveland, T. R., Woodcock, C. E., Allen, R. G., Anderson, M. C., Helder, D., Irons, J. R., Johnson, D. M., Kennedy, R., Scambos, T. A., Schaaf, C. B., Schott, J. R., Sheng, Y., Vermote, E. F., Vogelmann, J. E., Wanner, J. L., Zhu, Z., & Zhu, Z. (2014). Landsat-8: Science and product vision for terrestrial global change research. Remote Sensing of Environment, 145, 154–172.
https://doi.org/10.1016/j.rse.2014.02.001 |
| [22] | Xu, H. (2006). Modification of normalised difference water index (NDWI) to enhance open water features in remotely sensed imagery. International Journal of Remote Sensing, 27(14), 3025–3033. https://doi.org/10.1080/01431160600589179 |
[18, 22]
. NDWI values were classified into five drought severity categories following established thresholds (
Table 3).
Table 3. NDWI drought severity classification applied in this study.
NDWI Range | Drought Severity Class | Landscape Interpretation |
> 0.3 | No drought (high moisture) | Open water, flooded vegetation |
0.0 to 0.3 | Mild drought | Moist soils, irrigated cropland |
−0.3 to 0.0 | Moderate drought | Dry rangeland, sparse cover |
−0.6 to −0.3 | Severe drought | Degraded land, dry soils |
< −0.6 | Extreme drought | Bare rock, sand, built-up areas |
3.3. Image Processing and Analysis
All spectral index computations were carried out in Google Earth Engine (GEE), leveraging its cloud-computing architecture for automated image selection, atmospheric correction validation, and pixel-wise index calculation. Study area boundaries were delineated using vector shapefiles in ArcGIS Pro v3.4.0, and classified NDVI and NDWI rasters were exported for area statistics and cartographic rendering. Linear regression and Pearson correlation analysis were conducted to quantify the statistical relationship between mean annual NDVI and NDWI across the study period. Statistical significance was assessed at the α = 0.05 level.
4. Results
4.1. NDVI Temporal Dynamics (1985–2024)
4.1.1. Baseline Conditions (1985)
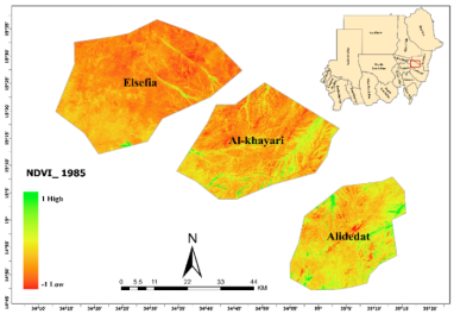
In 1985, the landscape across all three study sites was dominated by sparse vegetation (NDVI 0.0–0.3), corresponding to open rangeland and shrub savanna. Limited pockets of healthy vegetation (NDVI > 0.3) were confined to small patches of flooded vegetation and rain-fed agriculture, principally in Alidedat, which benefits from its wadi-influenced hydrology. Al-Kayari exhibited patches of bare land, reflecting its central dryland position. Human settlement footprints were negligible at this period. (
Figure 1)
4.1.2. Early Recovery Phase (1995)
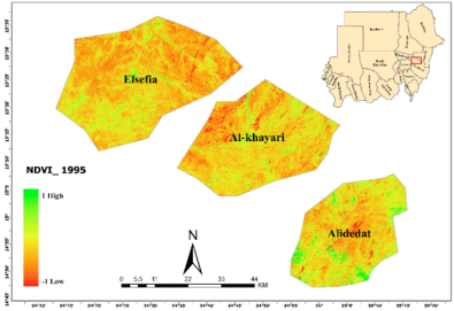
By 1995, a discernible increase in healthy vegetation (NDVI > 0.3) was recorded in both Alidedat and Elsefia, coinciding with improved rainfall conditions following the prolonged Sahelian drought of the 1970s–1980s. Agricultural land and flooded vegetation areas expanded moderately. Bare land cover in Al-Kayari declined slightly, though overall moisture conditions remained constrained. Early settlement growth was observable at all three localities (
Figure 2).
4.1.3. Vegetation Expansion (2015)
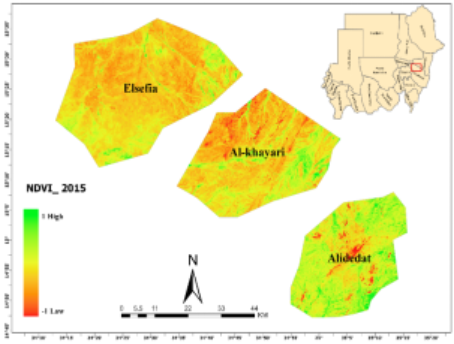
The 2015 imagery revealed significant expansion of healthy vegetation in Elsefia and Alidedat, with agricultural zones and flooded vegetation corridors notably enlarged. Settlement areas grew substantially, particularly in Elsefia and Al-Kayari. Sparse vegetation (rangeland) remained the dominant land cover type but showed a marginal reduction in areal extent relative to 1985 baseline conditions. (
Figure 3)
4.1.4. Peak Greening (2024)
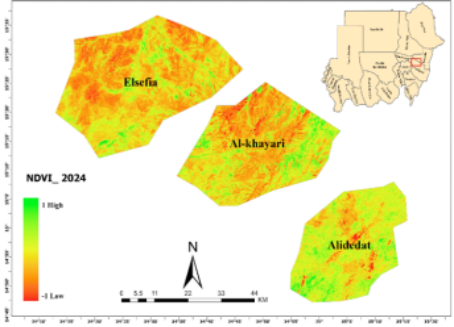
By 2024, healthy vegetation zones had reached their greatest recorded extent: approximately 63 km
2 in Elsefia and approximately 105 km
2 in Alidedat. These areas are associated with intensified rain-fed cultivation and expanded flooded vegetation along seasonal drainage networks. Al-Kayari retained comparatively lower NDVI values, reflecting its inland position and reduced moisture availability. Sparse rangeland cover, while still dominant across the combined study area, registered its smallest recorded extent over the four-decade record. (
Figure 4)
4.2. NDWI Temporal Dynamics (1985–2024)
4.2.1. 1985 Baseline
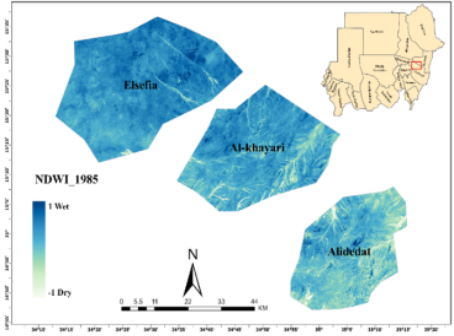
NDWI values in 1985 were predominantly negative across the study area, indicating dry to moderately stressed vegetation and soils. Moist conditions were restricted to small wetland patches and seasonally flooded depressions around Alidedat. Elsefia and Al-Kayari showed largely low-moisture conditions consistent with the regional drought context.
Figure 5)
4.2.2. 1995
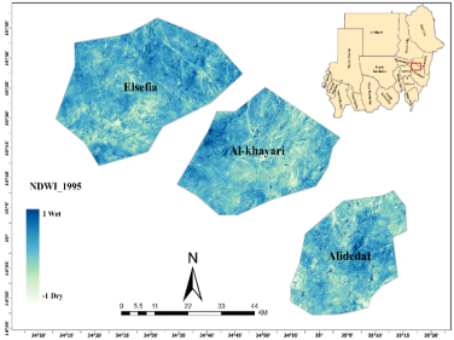
A modest but measurable improvement in NDWI was detected across Alidedat and Elsefia by 1995, with expanded zones of mild-to-moderate moisture. Al-Kayari showed limited change, remaining characterised by moderate-to-severe NDWI drought classes. (
Figure 6)
4.2.3. 2015
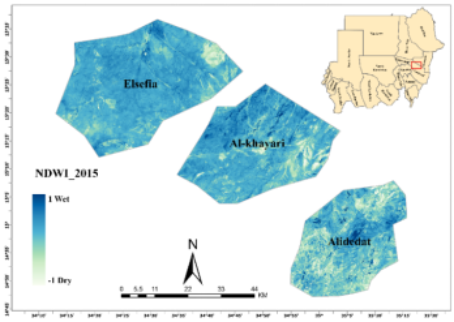
The 2015 image captured a clear expansion of water-associated landscape features, particularly within the wadi and riparian zones of Alidedat and the drainage valleys of Elsefia. Flooded vegetation areas increased markedly, reflecting both improved seasonal rainfall and the possible influence of upstream agricultural water management. (
Figure 7)
4.2.4. 2024
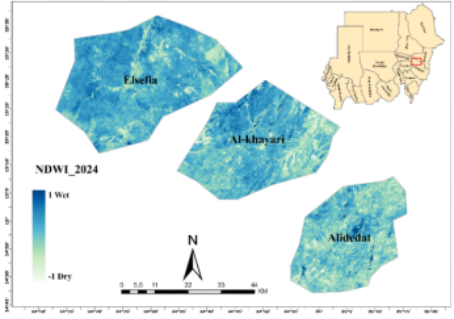
The 2024 NDWI map showed the highest surface moisture and flooded vegetation extent recorded across the study period. Alidedat and Elsefia displayed extensive zones of high NDWI values (> 0.3), while Al-Kayari continued to reflect comparatively drier conditions. This pattern corroborates the NDVI greening signal and supports the interpretation of enhanced hydrological connectivity in the southern and northern sub-sites. (
Figure 8)
4.3. NDVI–NDWI Correlation and Regression Analysis
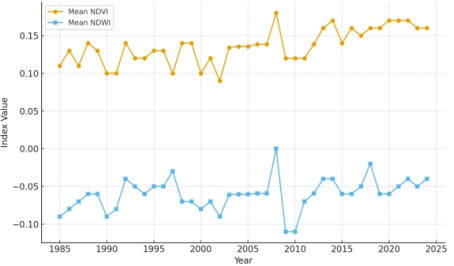
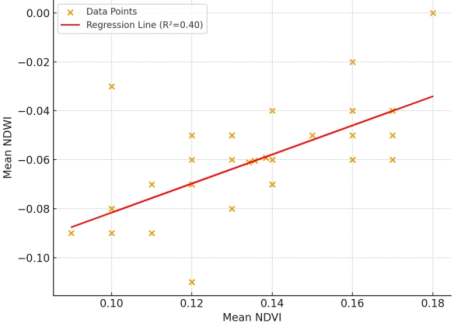
Time series regression analysis of mean annual NDVI and NDWI across the study period yielded a Pearson correlation coefficient of r = 0.63 (R
2 = 0.40; p = 1.09 × 10⁻⁵), indicating a statistically significant moderate positive association between vegetation greenness and surface moisture availability. Approximately 40% of the temporal variance in NDWI is explained by NDVI, with the remaining variance attributed to independent hydrological drivers including seasonal flood pulses, soil infiltration dynamics, and inter-annual rainfall variability. Both indices exhibited an upward trend from the 1985 baseline to 2024, consistent with the observed greening pattern. (
Figure 9;
Figure 10)
Figure 9. Time Series of Mean NDVI and NDWI (1985–2024).
Figure 10. Regression and Correlation between NDVI and NDWI.
5. Discussion
The multi-temporal NDVI analysis reveals a persistent greening trend across the Gadarif semi-arid landscape between 1985 and 2024, most pronounced in Alidedat and Elsefia. This finding aligns with the widely documented Sahel re-greening phenomenon, in which post-1980s vegetation recovery has been attributed to a combination of increased rainfall, community-led land restoration, and the expansion of rain-fed agriculture
| [2] | Anyamba, A., & Tucker, C. J. (2012). Analysis of Sahelian vegetation dynamics using NOAA-AVHRR NDVI data from 1981–2003. Journal of Arid Environments, 63(3), 596–614. https://doi.org/10.1016/j.jaridenv.2005.03.007 |
| [5] | Dardel, C., Kergoat, L., Hiernaux, P., Mougin, E., Grippa, M., & Tucker, C. J. (2014). Re-greening Sahel: 30 years of remote sensing data and field observations (Mali, Niger). Remote Sensing of Environment, 140, 350–364.
https://doi.org/10.1016/j.rse.2013.09.011 |
| [8] | Herrmann, S. M., Anyamba, A., & Tucker, C. J. (2005). Recent trends in vegetation dynamics in the African Sahel and their relationship to climate. Global Environmental Change, 15(4), 394–404. https://doi.org/10.1016/j.gloenvcha.2005.08.004 |
[2, 5, 8]
. The trajectory observed in this study — from sparse, drought-affected rangeland in 1985 to extensive healthy vegetation by 2024 — mirrors patterns reported from comparable semi-arid systems in the West African Sahel, the Ethiopian highlands fringe, and eastern Sudan’s mechanised farming belt.
However, the spatial heterogeneity of this recovery warrants careful interpretation. The contrasting trajectories of Alidedat and Elsefia versus Al-Kayari suggest that local hydrological context, particularly proximity to seasonal wadis and drainage corridors, plays a determinant role in mediating vegetation responses to rainfall. Wadi ecosystems act as preferential zones of moisture retention, groundwater recharge, and alluvial fertility, rendering them more resilient and responsive to rainfall improvements
| [13] | Lillesand, T. M., Kiefer, R. W., & Chipman, J. W. (2015). Remote Sensing and Image Interpretation (7th ed.). Wiley. |
| [20] | Thomas, D. S. G., & Goudie, A. S. (Eds.). (2000). The Dictionary of Physical Geography (3rd ed.). Blackwell. |
[13, 20]
. Al-Kayari’s persistently lower NDVI and NDWI values reflect its inland dryland character, where recharge pathways are more diffuse and interannual moisture variability is amplified.
The moderate NDVI–NDWI correlation (r = 0.63) is consistent with findings from other semi-arid studies and underscores the coupled but not deterministic relationship between photosynthetic activity and vegetation water content. A perfect correlation would not be expected given that NDWI responds to surface and canopy moisture inputs that may exceed or precede vegetation biomass responses, particularly in areas subject to seasonal flooding
| [7] | Gao, B. C. (1996). NDWI — A normalized difference water index for remote sensing of vegetation liquid water from space. Remote Sensing of Environment, 58(3), 257–266.
https://doi.org/10.1016/S0034-4257(96)00067-3 |
| [22] | Xu, H. (2006). Modification of normalised difference water index (NDWI) to enhance open water features in remotely sensed imagery. International Journal of Remote Sensing, 27(14), 3025–3033. https://doi.org/10.1080/01431160600589179 |
[7, 22]
. The 40% variance explained by the regression model suggests that additional explanatory variables — including rainfall seasonality, soil type, terrain, and land management practices — contribute substantially to NDWI dynamics and should be incorporated in future predictive modelling.
From a process perspective, the recovery trajectory documented here has important land–atmosphere feedback implications. Increased vegetation cover in semi-arid regions has been shown to reduce surface albedo, enhance evapotranspiration, and potentially increase local moisture recycling through changes in the boundary layer, thereby creating positive feedbacks that reinforce greening
| [23] | Zeng, N., Neelin, J. D., Lau, K. M., & Tucker, C. J. (1999). Enhancement of interdecadal climate variability in the Sahel by vegetation interaction. Science, 286(5444), 1537–1540.
https://doi.org/10.1126/science.286.5444.1537 |
| [24] | Zhou, L., Tian, Y., Myneni, R. B., Ciais, P., Saatchi, S., Liu, Y. Y., Piao, S., Chen, H., Vermote, E. F., Song, C., & Hwang, T. (2014). Widespread decline of Congo rainforest greenness in the past decade. Nature, 509(7498), 86–90.
https://doi.org/10.1038/nature13265 |
[23, 24]
. These dynamics may partly explain the progressive nature of the improvements observed beyond simple rainfall recovery, as ecosystem rehabilitation itself may amplify hydrological recovery. Simultaneously, the expansion of agricultural land use observed at Alidedat and Elsefia introduces anthropogenic drivers that must be monitored carefully, as rain-fed mechanised agriculture in semi-arid Sudan has historically been associated with soil degradation, loss of native savanna species, and long-term vulnerability to drought when rainfall fails
| [1] | Ahmed, A. G. M. (2003). Sustainable development in the drylands of Sudan: Challenges and prospects. In: H. Shawki (Ed.), Managing the drylands of eastern Africa. Addis Ababa: IGAD. |
| [10] | Ibrahim, F. N. (1978). Anthropogenic causes of desertification in western Sudan. GeoJournal, 2(3), 243–254.
https://doi.org/10.1007/BF00213922 |
[1, 10]
.
This study’s use of Landsat multi-mission imagery spanning nearly four decades offers both strengths and limitations. Inter-sensor radiometric differences between Landsat 5 TM, Landsat 7 ETM+, Landsat 8 OLI, and Landsat 9 OLI-2 introduce potential inconsistencies in NDVI and NDWI values, particularly for the 2005 epoch when Landsat 7’s scan-line corrector failure introduced data striping artefacts. While GEE’s Surface Reflectance products provide atmospheric and BRDF corrections, residual sensor-to-sensor biases may affect trend magnitude estimates
| [19] | Roy, D. P., Kovalskyy, V., Zhang, H. K., Vermote, E. F., Yan, L., Kumar, S. S., & Egorov, A. (2016). Characterization of Landsat-7 to Landsat-8 reflective wavelength and normalized difference vegetation index continuity. Remote Sensing of Environment, 185, 57–70.
https://doi.org/10.1016/j.rse.2015.12.024 |
[19]
. Future research should apply cross-calibration procedures and consider integration with complementary sensors such as MODIS or Sentinel-2 to enhance temporal density and cross-validation robustness
| [9] | Huete, A. R., Didan, K., Miura, T., Rodriguez, E. P., Gao, X., & Ferreira, L. G. (2002). Overview of the radiometric and biophysical performance of the MODIS vegetation indices. Remote Sensing of Environment, 83(1–2), 195–213.
https://doi.org/10.1016/S0034-4257(02)00096-2 |
[9]
.
6. Conclusion
This study presents the first systematic four-decade (1985–2024) assessment of NDVI and NDWI dynamics across three ecologically representative localities in the semi-arid Gadarif State of eastern Sudan. The analysis demonstrates a statistically significant progressive increase in healthy vegetation cover and surface moisture availability in Alidedat and Elsefia, contrasting with persistent dryness in the centrally located Al-Kayari. A moderate positive NDVI–NDWI correlation (r = 0.63; p < 0.001) confirms coupled vegetation–hydrology dynamics, though approximately 60% of NDWI variance remains explained by factors beyond vegetation productivity alone.
The observed greening trend, while encouraging from an ecological recovery perspective, must be contextualised within broader socio-environmental dynamics, including agricultural expansion, rainfall variability, and potential land degradation risk. These findings provide a quantitative baseline for landscape monitoring in the Gadarif region and demonstrate the utility of freely available multi-temporal Landsat archives and cloud-computing platforms such as GEE for long-term environmental assessment in data-sparse regions. The results are directly relevant to evidence-based decision-making in drought early warning systems, rangeland management, and climate adaptation planning for semi-arid Sudan.
7. Recommendations
Based on the findings of this study, the following recommendations are proposed for researchers, practitioners, and policymakers working on semi-arid land management in the Gadarif region and comparable contexts:
1) Integration of rainfall and climatic data: Future studies should incorporate station-based and gridded rainfall datasets (e.g., CHIRPS, ERA5) to disentangle the contributions of rainfall variability versus land use change to observed NDVI and NDWI trends. This will strengthen causal attribution and improve the predictive value of spectral index analyses.
2) High-resolution and multi-sensor monitoring: The integration of Sentinel-2 (10 m spatial resolution) imagery alongside Landsat (30 m) would enhance fine-scale vegetation and moisture mapping, particularly for localised wadi ecosystems and smallholder agricultural plots.
3) Field validation campaigns: Ground-truth data collection, including vegetation transects, soil moisture measurements, and biomass sampling, should be conducted to validate remotely sensed NDVI and NDWI classifications and calibrate thematic classes for the specific ecological context of Gadarif.
4) Expansion of the study area: Extending the analysis to the full extent of Gadarif State and adjacent regions of Kassala and Gedaref would allow regional-scale synthesis and support comparison with established Sahel re-greening studies.
5) Drought early warning integration: NDVI and NDWI time series, maintained on an annual or seasonal basis using GEE automation, should be formally integrated into Sudan’s national drought early warning frameworks and communicated to pastoralist and farming communities through participatory extension services.
6) Sustainable land management policy: The documented expansion of agricultural land at the expense of native savanna should prompt regulatory review of mechanised farming concession boundaries, and policy incentives should be developed to promote agroforestry, soil and water conservation structures (e.g., hafirs, terracing), and native species restoration.
7) Cross-sensor calibration: To ensure the temporal consistency of long-term indices spanning multiple Landsat missions, future analyses should apply established cross-calibration and bidirectional reflectance distribution function (BRDF) correction protocols to minimise inter-sensor artefacts.
Abbreviations
NDVI | Normalized Difference Vegetation Index |
NDWI | Normalized Difference Water Index |
RS | Remote Sensing |
GIS | Geographic Information Systems |
GEE | Google Earth Engine |
ITCZ | Inter-Tropical Convergence Zone |
USGS | United States Geological Survey |
EROS | Earth Resources Observation and Science Center |
NIR | Near-Infrared |
RED | Red Spectral Band |
SWIR | Shortwave Infrared |
BRDF | Bidirectional Reflectance Distribution Function |
Author Contributions
Ensaf Abdalla Ibrahim Ahmed: Conceptualization, Data curation, Formal analysis, Writing – original draft
Muna Mahjoub Mohamed Ahmed: Methodology, Resources, Supervision, Validation, Writing – review & editing
Conflicts of Interest
The authors declare that they have no conflict of interest regarding the publication of this article. The research was conducted independently, and no financial or personal relationships influenced the outcomes presented.
References
| [1] |
Ahmed, A. G. M. (2003). Sustainable development in the drylands of Sudan: Challenges and prospects. In: H. Shawki (Ed.), Managing the drylands of eastern Africa. Addis Ababa: IGAD.
|
| [2] |
Anyamba, A., & Tucker, C. J. (2012). Analysis of Sahelian vegetation dynamics using NOAA-AVHRR NDVI data from 1981–2003. Journal of Arid Environments, 63(3), 596–614.
https://doi.org/10.1016/j.jaridenv.2005.03.007
|
| [3] |
Bhuiyan, C., Singh, R. P., & Kogan, F. N. (2006). Monitoring drought dynamics in the Aravalli region (India) using different indices based on ground and remote-sensing data. International Journal of Applied Earth Observation and Geoinformation, 8(4), 289–302.
https://doi.org/10.1016/j.jag.2006.03.002
|
| [4] |
Cova, T. J. (1999). GIS in emergency management. In: P. Longley, M. Goodchild, D. Maguire & D. Rhind (Eds.), Geographical Information Systems: Principles, Techniques, Management and Applications (2nd ed., pp. 845–858). Wiley.
|
| [5] |
Dardel, C., Kergoat, L., Hiernaux, P., Mougin, E., Grippa, M., & Tucker, C. J. (2014). Re-greening Sahel: 30 years of remote sensing data and field observations (Mali, Niger). Remote Sensing of Environment, 140, 350–364.
https://doi.org/10.1016/j.rse.2013.09.011
|
| [6] |
Deering, D. W. (1978). Rangeland reflectance characteristics measured by aircraft and spacecraft sensors. PhD Dissertation. Texas A&M University, College Station, TX.
|
| [7] |
Gao, B. C. (1996). NDWI — A normalized difference water index for remote sensing of vegetation liquid water from space. Remote Sensing of Environment, 58(3), 257–266.
https://doi.org/10.1016/S0034-4257(96)00067-3
|
| [8] |
Herrmann, S. M., Anyamba, A., & Tucker, C. J. (2005). Recent trends in vegetation dynamics in the African Sahel and their relationship to climate. Global Environmental Change, 15(4), 394–404.
https://doi.org/10.1016/j.gloenvcha.2005.08.004
|
| [9] |
Huete, A. R., Didan, K., Miura, T., Rodriguez, E. P., Gao, X., & Ferreira, L. G. (2002). Overview of the radiometric and biophysical performance of the MODIS vegetation indices. Remote Sensing of Environment, 83(1–2), 195–213.
https://doi.org/10.1016/S0034-4257(02)00096-2
|
| [10] |
Ibrahim, F. N. (1978). Anthropogenic causes of desertification in western Sudan. GeoJournal, 2(3), 243–254.
https://doi.org/10.1007/BF00213922
|
| [11] |
Jensen, J. R. (2016). Introductory Digital Image Processing: A Remote Sensing Perspective (4th ed.). Pearson Prentice Hall.
|
| [12] |
Kienberger, S. (2012). Spatial modelling of social and economic vulnerability to floods at the district level in Búzi, Mozambique. Natural Hazards, 64(3), 2001–2019.
https://doi.org/10.1007/s11069-012-0168-6
|
| [13] |
Lillesand, T. M., Kiefer, R. W., & Chipman, J. W. (2015). Remote Sensing and Image Interpretation (7th ed.). Wiley.
|
| [14] |
Meyer, V., Scheuer, S., & Haase, D. (2009). A multicriteria approach for flood risk mapping exemplified at the Mulde river, Germany. Natural Hazards, 48(1), 17–39.
https://doi.org/10.1007/s11069-008-9244-4
|
| [15] |
Millennium Ecosystem Assessment (2005). Ecosystems and Human Well-being: Desertification Synthesis. World Resources Institute, Washington, DC.
|
| [16] |
Rismayatika, R., Yati, S., & Hidayat, R. (2020). Land use change analysis using NDVI satellite image classification in Bongaigaon and Goalpara districts, Assam, India. IOP Conference Series: Earth and Environmental Science, 423, 012044.
https://doi.org/10.1088/1755-1315/423/1/012044
|
| [17] |
Rouse, J. W., Haas, R. H., Schell, J. A., & Deering, D. W. (1974). Monitoring vegetation systems in the Great Plains with ERTS. Proceedings of the Third ERTS Symposium, NASA SP-351(1), 309–317.
|
| [18] |
Roy, D. P., Wulder, M. A., Loveland, T. R., Woodcock, C. E., Allen, R. G., Anderson, M. C., Helder, D., Irons, J. R., Johnson, D. M., Kennedy, R., Scambos, T. A., Schaaf, C. B., Schott, J. R., Sheng, Y., Vermote, E. F., Vogelmann, J. E., Wanner, J. L., Zhu, Z., & Zhu, Z. (2014). Landsat-8: Science and product vision for terrestrial global change research. Remote Sensing of Environment, 145, 154–172.
https://doi.org/10.1016/j.rse.2014.02.001
|
| [19] |
Roy, D. P., Kovalskyy, V., Zhang, H. K., Vermote, E. F., Yan, L., Kumar, S. S., & Egorov, A. (2016). Characterization of Landsat-7 to Landsat-8 reflective wavelength and normalized difference vegetation index continuity. Remote Sensing of Environment, 185, 57–70.
https://doi.org/10.1016/j.rse.2015.12.024
|
| [20] |
Thomas, D. S. G., & Goudie, A. S. (Eds.). (2000). The Dictionary of Physical Geography (3rd ed.). Blackwell.
|
| [21] |
Tucker, C. J. (1979). Red and photographic infrared linear combinations for monitoring vegetation. Remote Sensing of Environment, 8(2), 127–150.
https://doi.org/10.1016/0034-4257(79)90013-0
|
| [22] |
Xu, H. (2006). Modification of normalised difference water index (NDWI) to enhance open water features in remotely sensed imagery. International Journal of Remote Sensing, 27(14), 3025–3033.
https://doi.org/10.1080/01431160600589179
|
| [23] |
Zeng, N., Neelin, J. D., Lau, K. M., & Tucker, C. J. (1999). Enhancement of interdecadal climate variability in the Sahel by vegetation interaction. Science, 286(5444), 1537–1540.
https://doi.org/10.1126/science.286.5444.1537
|
| [24] |
Zhou, L., Tian, Y., Myneni, R. B., Ciais, P., Saatchi, S., Liu, Y. Y., Piao, S., Chen, H., Vermote, E. F., Song, C., & Hwang, T. (2014). Widespread decline of Congo rainforest greenness in the past decade. Nature, 509(7498), 86–90.
https://doi.org/10.1038/nature13265
|
Cite This Article
-
APA Style
Ahmed, E. A. I., Ahmed, M. M. M. (2026). Temporal Dynamics of Normalized Difference Vegetation Index (NDVI) and Normalized Difference Water Index (NDWI) in Semi-Arid Gadarif Region, Sudan (1985–2024). International Journal of Sustainable and Green Energy, 15(3), 93-103. https://doi.org/10.11648/j.ijsge.20261503.11
 Copy
|
Copy
|
 Download
ACS Style
Ahmed, E. A. I.; Ahmed, M. M. M. Temporal Dynamics of Normalized Difference Vegetation Index (NDVI) and Normalized Difference Water Index (NDWI) in Semi-Arid Gadarif Region, Sudan (1985–2024). Int. J. Sustain. Green Energy 2026, 15(3), 93-103. doi: 10.11648/j.ijsge.20261503.11
Copy
|
Download
AMA Style
Ahmed EAI, Ahmed MMM. Temporal Dynamics of Normalized Difference Vegetation Index (NDVI) and Normalized Difference Water Index (NDWI) in Semi-Arid Gadarif Region, Sudan (1985–2024). Int J Sustain Green Energy. 2026;15(3):93-103. doi: 10.11648/j.ijsge.20261503.11
Copy
|
Download
-
@article{10.11648/j.ijsge.20261503.11,
  author = {Ensaf Abdalla Ibrahim Ahmed and Muna Mahjoub Mohamed Ahmed},
  title = {Temporal Dynamics of Normalized Difference Vegetation Index (NDVI) and Normalized Difference Water Index (NDWI) in Semi-Arid Gadarif Region, Sudan (1985–2024)},
  journal = {International Journal of Sustainable and Green Energy},
  volume = {15},
  number = {3},
  pages = {93-103},
  doi = {10.11648/j.ijsge.20261503.11},
  url = {https://doi.org/10.11648/j.ijsge.20261503.11},
  eprint = {https://article.sciencepublishinggroup.com/pdf/10.11648.j.ijsge.20261503.11},
  abstract = {Monitoring vegetation and hydrological dynamics in semi-arid ecosystems is critical for understanding responses to climate variability and anthropogenic pressures. This study employs multi-temporal Landsat satellite imagery (1985–2024) to examine spatiotemporal changes in the Normalized Difference Vegetation Index (NDVI) and Normalized Difference Water Index (NDWI) across three ecologically distinct localities—Al-Kayari, Alidedat, and Elsefia—within the Gadarif State, eastern Sudan. Image processing and spectral index computation were performed using Google Earth Engine (GEE) and ArcGIS Pro v3.4.0. NDVI analysis revealed a progressive increase in healthy vegetation cover (NDVI ≥ 0.3) in Elsefia (approximately 63 km2 by 2024) and Alidedat (approximately 105 km2 by 2024), indicating a positive greening trend over the study period. Conversely, Al-Kayari maintained comparatively drier conditions with persistently sparse vegetation. Parallel NDWI analysis demonstrated enhanced surface moisture and expanded flooded vegetation zones in Elsefia and Alidedat since the mid-1990s, while Al-Kayari continued to exhibit relatively low moisture availability. Pearson correlation analysis between NDVI and NDWI yielded a moderate positive coefficient (r = 0.63, R2 = 0.40, p < 0.001), confirming coupled vegetation–moisture dynamics. These findings suggest a partial ecological recovery consistent with documented Sahel re-greening, potentially driven by rainfall variability, land use shifts, and hydrological feedbacks. The results provide a quantitative baseline for evidence-based land management, drought early warning, and climate adaptation planning in the semi-arid Gadarif region.},
 year = {2026}
}
Copy
|
Download
-
TY  - JOUR
T1  - Temporal Dynamics of Normalized Difference Vegetation Index (NDVI) and Normalized Difference Water Index (NDWI) in Semi-Arid Gadarif Region, Sudan (1985–2024)
AU  - Ensaf Abdalla Ibrahim Ahmed
AU  - Muna Mahjoub Mohamed Ahmed
Y1  - 2026/08/10
PY  - 2026
N1  - https://doi.org/10.11648/j.ijsge.20261503.11
DO  - 10.11648/j.ijsge.20261503.11
T2  - International Journal of Sustainable and Green Energy
JF  - International Journal of Sustainable and Green Energy
JO  - International Journal of Sustainable and Green Energy
SP  - 93
EP  - 103
PB  - Science Publishing Group
SN  - 2575-1549
UR  - https://doi.org/10.11648/j.ijsge.20261503.11
AB  - Monitoring vegetation and hydrological dynamics in semi-arid ecosystems is critical for understanding responses to climate variability and anthropogenic pressures. This study employs multi-temporal Landsat satellite imagery (1985–2024) to examine spatiotemporal changes in the Normalized Difference Vegetation Index (NDVI) and Normalized Difference Water Index (NDWI) across three ecologically distinct localities—Al-Kayari, Alidedat, and Elsefia—within the Gadarif State, eastern Sudan. Image processing and spectral index computation were performed using Google Earth Engine (GEE) and ArcGIS Pro v3.4.0. NDVI analysis revealed a progressive increase in healthy vegetation cover (NDVI ≥ 0.3) in Elsefia (approximately 63 km2 by 2024) and Alidedat (approximately 105 km2 by 2024), indicating a positive greening trend over the study period. Conversely, Al-Kayari maintained comparatively drier conditions with persistently sparse vegetation. Parallel NDWI analysis demonstrated enhanced surface moisture and expanded flooded vegetation zones in Elsefia and Alidedat since the mid-1990s, while Al-Kayari continued to exhibit relatively low moisture availability. Pearson correlation analysis between NDVI and NDWI yielded a moderate positive coefficient (r = 0.63, R2 = 0.40, p < 0.001), confirming coupled vegetation–moisture dynamics. These findings suggest a partial ecological recovery consistent with documented Sahel re-greening, potentially driven by rainfall variability, land use shifts, and hydrological feedbacks. The results provide a quantitative baseline for evidence-based land management, drought early warning, and climate adaptation planning in the semi-arid Gadarif region.
VL  - 15
IS  - 3
ER  -
Copy
|
Download





 Share This Article
 Twitter
 Linked In
 Facebook