Abstract
To measure the average lifespan of systems and components, and to analyze lifetime data with a monotonic failure rate, distributions such as Weibull, Exponential, and Gamma are commonly used in reliability and survival studies. However, these distributions are not suitable for datasets with non-monotonic patterns like the bathtub curve. To address this, the Chen distribution, which accommodates increasing or bathtub-shaped failure rates, has been proposed. Yet, this model lacks a scale parameter. This article presents a new four parameter lifetime distribution with bathtub-shaped failure rate called Additive Dhillon-Chen (ADC) distribution. We applied the additive methodology to establish the model, for which the Dhillon distribution was considered as baseline distribution. Some statistical properties such as quartile function, mode, moment and moment generating function, order statistics and asymptotic behavior of the distribution are studied. Parameters of the distribution are estimated using the maximum likelihood estimation method. The ADC distribution is applied to two lifetime dataset and compared with an existing distribution in the literature. Model selection was carried out based on Log-likelihood, Akaike Information Criterion (AIC), Bayesian Information Criterion (BIC), and Corrected Akaike Information Criterion (AICc). The results, based on parameter estimation from real-life data, demonstrate that the ADC distribution fits the data well and offers a valuable alternative for modeling datasets with non-monotonic behavior.
Keywords
Reliability, Survival, Bathtub-curve, Additive, Dhillon-Chen Distribution
1. Introduction
In reliability and survival studies, lifetime distributions like Weibull, Exponential, and Gamma are commonly used to gauge the average lifespan of system and device components and analyse data with a monotonic failure rate. However, these models fall short when dealing with data exhibiting non-monotonic patterns, such as the bathtub curve. To address this issue, several alternative approaches have been proposed
| [17] | Méndez-González, L. C.; Rodríguez-Picón, L. A.; Pérez-Olguin, I. J. C.; Vidal Portilla, L. R. An Additive Chen Distribution with Applications to Lifetime Data. Axioms 2023, 12, 118. https://doi.org/10.3390/ axioms12020118 |
| [23] | Thach, T. T., & Briš, R. (2021). An additive Chen-Weibull distribution and its applications in reliability modeling. Quality and Reliability Engineering International, 37(1), 352–373. https://doi.org/10.1002/qre.2740 |
[17, 23]
.
The work of introduced a new two-parameter probability distribution with increasing or bathtub-shaped Failure Rate (FR) function. The c.d.f. of the Chen distribution is given by
(1)
It has an increasing FR when
and a bathtub-shaped when
But, the distribution is not flexible because it lacks scale parameter. In view of the above, extended works on Chen distribution have been considered by many researchers to provide more flexibility for describing different form of data sets using different methodologies. For example: A new extension of Chen distribution was proposed by
| [6] | Chaubey, Y. P., & Zhang, R. (2015). An extension of Chen’s family of survival distributions with bathtub shape or increasing hazard rate function. Computational Statistics - Theory and Methods, 44(19), 4049–4064. https://doi.org/10.1080/03610926.2014.997357 |
[6]
. The shape of the density of the model is decreasing or unimodal according to the value of the parameters, while the shape of the hazard rate is increasing or bathtub-shaped. The authors adopted the method of generalizing a cumulative distribution function of a given distribution introduced by
| [10] | Gupta R and D. Kundu, “Generalized exponential distribution,” Aust NZJ Stat, vol. 41, pp. 173–188, 1999. |
[10]
through introduction of additional parameter α > 0 given by
.
| [21] | Shuaib, M. K., Robert K., & Irene L. H (2018). Kumaraswamy Exponentiated Chen distribution for modeling lifetime data. An international journal of applied mathematics and information sciences, 12(3) 1-7. https://doi.org/10.18576/amis/paper*25-4-2018 |
[21]
consider an extension of the exponentiated Chen distribution based on the quadratic rank transmutation map technique named Transmuted Exponentiated Chen distribution with application to survival data. They estimated the parameters using the method of maximum likelihood and finally, the flexibility of the new distribution was illustrated using strengths of glass fibers data and nicotine in cigarette data
. A new continuous probability distribution called Exponentiated Chen distribution was introduced by
. Their main focus was on estimation from frequentist point of view and they derived some statistical and reliability characteristics for the model.
| [12] | Khan, M. S., King, R., & Hudso, I. (2018). Kumaraswamy exponentiated Chen distribution for modelling lifetime data. Applied Mathematics and Information Sciences 12(3). http://dx.doi.org/10.18576/amis/120317 |
[12]
introduced the Kumaraswamy Exponentiated Chen distribution for modelling a bathtub-shaped hazard rate function.
| [4] | Bai, X., Shi, Y., Liu, Y., Ng, H. K. T. (2018). Statistical analysis of competing risks model from Marshal-Olkin extended Chen distribution under adaptive progressively interval censoring with random removals. Communication in Statistics-Theory and Method. 48(3) 1-20. https://doi.org/10.1080/03610926.2018.1481973 |
[4]
introduced a new censoring scheme named statistical analysis of competing risks model from Marshall-Olkin extended Chen distribution under adaptive progressively interval censoring with random removals.
| [23] | Thach, T. T., & Briš, R. (2021). An additive Chen-Weibull distribution and its applications in reliability modeling. Quality and Reliability Engineering International, 37(1), 352–373. https://doi.org/10.1002/qre.2740 |
[23]
introduced a new lifetime distribution called addictive Chen-Weibull (ACW) distribution and describe its application in reliability modelling. The distribution has an increasing and bathtub-shape failure rates.
| [22] | Spakota L. P., & Kumar V. (2023). Chen exponential distribution with application to engineering data. International journal of statistics and reliability engineering, 10(1), 33-47. |
[22]
introduced a three-parameter probability distribution named Chen Exponential distribution with applications to engineering data. The model was developed by introducing additional parameter to Chen distribution.
| [17] | Méndez-González, L. C.; Rodríguez-Picón, L. A.; Pérez-Olguin, I. J. C.; Vidal Portilla, L. R. An Additive Chen Distribution with Applications to Lifetime Data. Axioms 2023, 12, 118. https://doi.org/10.3390/ axioms12020118 |
[17]
introduced an additive Chen distribution with applications to lifetime data. The model has an increasing, decreasing, and bathtub shape failure rate. The author deployed additive methodology and consider Chen distribution as the baseline distribution and so also, the distribution has excellent flexibility in describing failure rates with non-monotone behavior or with the shape of bathtub curve.
In practice, a considerable number of generalized models have been proposed for modelling lifetime data with non-monotone failure rates (FRs) from various lookouts, particularly reliability engineering
| [2] | Abba, B. Hong W., Mustapha M., & Hassan S. B. (2023). A robust bathtub-shaped failure time model for a two-component system with application to complete and censored reliability data. Taylor and Francis group, quality technology and quantitative management. https://doi.org/10.1016/j.ress.2022.108460 |
[2]
. Some of these generalized models includes; Exponentiated additive Weibull distribution by
, A new weighted Gompertz distribution with applications to reliability data by
| [5] | Bakouch, H. S., & Abd El-Bar, A. M. T. (2017). A new weighted Gompertz distribution with applications to reliability data. Applications of Mathematics, 62(3), 269–296. https://doi.org/10.21136/AM.2017.0277-16 |
[5]
, An extension of Chen’s family of survival distribution with bathtub-shape or increasing hazard rate by
| [6] | Chaubey, Y. P., & Zhang, R. (2015). An extension of Chen’s family of survival distributions with bathtub shape or increasing hazard rate function. Computational Statistics - Theory and Methods, 44(19), 4049–4064. https://doi.org/10.1080/03610926.2014.997357 |
[6]
, Chen-Burr XII model as a competing risks model with applications to real-life datasets by
| [11] | Kalantan, Z. I.; Binhimd, S. M. S.; Salem, H. N.; AL-Dayian, G. R.; EL-Helbawy, A. A.; Elaal, M. K. A. Chen-Burr XII Model as a Competing Risks Model with Applications to Real-Life Data Sets. Axioms 2024, 13, 531. https://doi.org/10.3390/axioms13080531 |
[11]
, on some lifetime distribution with flexible failure rate by
, A new extension of the Topp-Leone family of models with applications in repairable systems by
| [15] | Muhammad, M., Liu, L., Abba, B., Muhammad, I., Bouchane, M., Zhang, H., & Musa, S. (2022). A new extension of the topp–Leone-family of models with applications to real data. Annals of Data Science, 10(1), 225–250. https://doi.org/10.1007/s40745-022-00456-y |
[15]
, The alpha power Weibull transformation distribution applied to describe the behavior of electronic devices under voltage stress profile by
| [18] | Mendez-Gonzalez, L. C., Rodriguez-Picon, L. A., Perez-Olguin, I. J. C., Perez-Dominguez, L. A., & Cruz, D. L. (2022). The alpha power Weibull transformation distribution applied to describe the behavior of electronic devices under voltage stress profile. Quality Technology & Quantitative Management, 1–29. https://doi.org/10.1080/16843703.2022.2148884 |
[18]
, Beta Sarhan-Zaindin modified Weibull distribution by
, A new extension of the exponential power distribution with application to lifetime data by
| [20] | Shakil, M., Kibria, B. M. G., & Elgarhy, M. (2018). A new extension of the exponential power distribution with application to lifetime data. International Journal of Computational Intelligence Systems, 05(02), 72–84. https://doi.org/10.12785/ijcts/050202 |
[20]
, Classical and Bayesian estimations of improved Weibull-Weibull distribution for complete and censored failure times data by
| [25] | Wang, H., Abba, B., & Jianxin, P. (2022). Classical and Bayesian estimations of improved Weibull–Weibull distribution for complete and censored failure times data. Applied Stochastic Models in Business and Industry, 38(6), 997–1018. https://doi.org/10.1002/asmb.2698 |
[25]
, and On the upper truncated Weibull distribution by
| [26] | Zhang, T., & Xie, M. (2011). On the upper truncated Weibull distribution and its reliability implications. Reliability Engineering and System Safety, 96(1), 194–200. https://doi.org/10.1016/j.ress.2010.09.004 |
[26]
,. Despite the usefulness of these distributions in reliability engineering, research has shown that a substantial part of these distributions has bathtub failure rate (FR) shapes but lack the FR’s relatively constant
| [2] | Abba, B. Hong W., Mustapha M., & Hassan S. B. (2023). A robust bathtub-shaped failure time model for a two-component system with application to complete and censored reliability data. Taylor and Francis group, quality technology and quantitative management. https://doi.org/10.1016/j.ress.2022.108460 |
[2]
. According to
, this phase (useful life) is very vital or may be the most critical phase for reliability modelling, this is because it describes the useful life span of the component or system. Hence, it is paramount important to construct a model(s) that can accurately represent this constant failure rate (CRF) phase.
Combining the FR of two distributions is considered as a very useful technique in obtaining more flexible models with simple FR. In view of this,
| [24] | Xie, M. & Lai C. D. (1996). Reliability analysis using an additive Weibull model with bathtub-shaped failure rate function. Reliability Engineering & System Safety, 52(1), 87-93. https://doi.org/10.1016/0951-8320(95)00149-2 |
[24]
established the additive Weibull model using the idea of combing the hazard rates of two Weibull distribution. In this paper, we propose a four-parameter lifetime distribution by using additive methodology to combine the failure rates of the Dhillon distribution which was introduced by
| [9] | Dhillon, B. S. (1980). Statistical function to represent various types of hazard rates. Microelectron Reliab. 20(0) 581-584. |
[9]
and the Chen distributions in a serial system, which will be called as the Additive Dhillon-Chen (ADC) distribution. The propose distribution is considered to be very flexible to model data with monotonic and non-monotonic behavior.
The rest of this research paper is organized as follows. In section 2, we define and introduce the new ADC distribution and present its important functional forms. In section 3, we consider some properties of the new distribution such as moment generating function, moments. We also consider the method of maximum likelihood estimator (MLE) for the estimate of the model parameters in section 4. In section 5, we present the flexibility of the ADC distribution using two lifetime datasets and the results are compared with some competitor distributions. Finally, the conclusion of this paper was presented in section 6.
2. The Additive Dhillon-Chen (ADC) Distribution
Let us consider a system with two components arranged and functioning in a series, each component is operating independently at a given time t. The system fails when the first component fails. In view of this, our new model signifies the lifetime of the entire serial system with two components. The first component’s lifetime follows a Dhillon distribution with parameters λ and θ, while the second component’s lifetime follows a Chen distribution with parameters α and β. The complete system’s lifetime is determined by the minimum lifetime of the two components. In other word, let represent the lifetime of the first component, which follows Dhillon distribution with parameter λ and θ, and let represent the lifetime of the second component which follows Chen with parameter α and β. If the system lifetime is T, then
T = min () has the distribution given by
(2)
for and .
The probability density function (pdf) of this distribution is given by
(3)
For random variable
with pdf in (
3), we write
.
Figure 1. Plot of the ADC density function for some values of parameter.
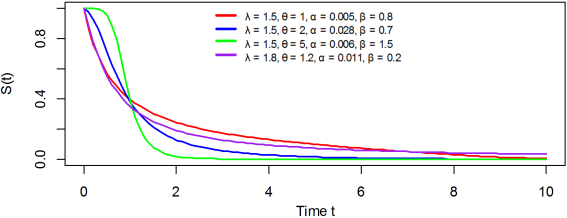
Finally, the failure rate function as well as the survival function of the proposed ADC distribution is given as
(4)
(5)
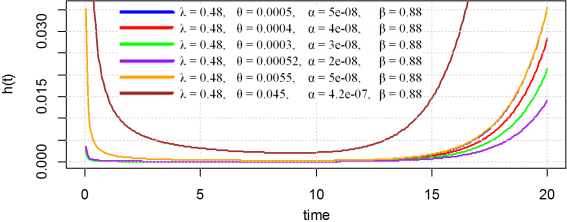
Figure 2. Plot of the ADC failure rate for some values of parameter.
Figure 3. Plot of the ADC failure rate for some values of parameter.
3. Properties of ADC Distribution
3.1. Measure of Central Tendency
We shall provide some measures of central tendency of the ADC distribution in this section.
Quartile Function
The quantile function or quantile function is used to obtain random data with which it is possible to carryout pdf simulations. The
quartile
presented by t of ADC based on equation (
1) can be calculated as
(6)
The above equation does not have a close form solution, as such, it is necessary to make approximations through the use of numerical methods provided in specialized software’s like R-package. We obtained the median of the ADC distribution by setting
in equation (
6).
Mode
The mode of the ADC distribution is the value(s) of the random variable at which the probability density function (pdf) reaches its maximum. To obtain the mode of the ADC model, we take the first derivative of term in equation (
3) and equate to zero.
(7)
The mode is obtained in equation (
8)
(8)
3.2. Moment Generating Function and Moment
If is a random variable that follows the ADC distribution with parameters , , , and . Then the moment generating function of defined by is obtained as:
Since by series expansion,
Then,
(10)
(11)
where
(12)
(13)
Since . Then,
(14)
Rearranging the exponential terms, we have
(15)
Hence, the th moment of , is given as
.(16)
Consequently, the MGF of from (16) is therefore derived as
(17)
3.3. Order Statistics
The order statistics and their moments have great importance in many statistical problems and applications in reliability analysis and life testing. Let be a random sample from the ADC distribution and is the order statistic of the sample, then the PDF of is given by
(18)
where
The kth order statistics is given by
(19)
3.4 Asymptotic Behavior
We consider the asymptotic behavior to investigate the behavior of the pdf of the ADC model as and as .
(20)
This implies that,
(21)
(22)
Similarly,
(23)
(24)
Hence, the ADC distribution has a unimodal.
4. Parameter Estimation
Maximum Likelihood Estimator
The Maximum Likelihood Estimation (MLE) is a statistical technique used to estimate the parameters of a given probability distribution or statistical model. It classifies the parameter values that maximize the likelihood function, which measures how fit the model describes the observed data. Let
be observed values of a random sample drawn from the ADC distribution with parameters vector
. Then, the log-likelihood function of
is developed from the pdf
in equation (
3) as
(26)
The associated score function for each ADC parameter from (
36) are
(27)
(28)
,(29)
(30)
Considering the nature of the score function , we recommend computing the estimates numerically using statistical software. For this study, we utilized the maxLik package (Henningsen and Toomet, 2011) in R to maximize the likelihood function.
5. Application
Table 1. Failure functions of some Bathtub Shape Distributions.
Model | h(t) |
ADC | |
AddC | |
ACW | |
APW | |
This section evaluates the ADC distribution by applying it to real-life data with non-monotonic characteristics and contrasts its performance with other distributions that use an additive approach. The distributions compared are Additive Chen distribution (AddC), Additive Chen Weibull distribution (ACW) and Additive Perks Weibull (APW) distribution.
Table 1 present the FR functions for each distribution.
The parameters were estimated through MLE in Rstudio using Maxlik Library, the gradient and Hessian of each of the distributions are considered.
5.1. Reliability Analysis for Lifetime Data of 50 Devices
In this study, we determining the behavior of the failure times of 50 devices. The data was reported by
| [1] | Aarset, M. V. (1978). How to identify a bathtub hazard rate. IEEE Transaction reliability 36(1). |
[1]
and was used by
| [16] | Meeker WQ, Escobar LA. Statistical Methods for Reliability Data. New York: Wiley; 1998. |
| [17] | Méndez-González, L. C.; Rodríguez-Picón, L. A.; Pérez-Olguin, I. J. C.; Vidal Portilla, L. R. An Additive Chen Distribution with Applications to Lifetime Data. Axioms 2023, 12, 118. https://doi.org/10.3390/ axioms12020118 |
| [23] | Thach, T. T., & Briš, R. (2021). An additive Chen-Weibull distribution and its applications in reliability modeling. Quality and Reliability Engineering International, 37(1), 352–373. https://doi.org/10.1002/qre.2740 |
[16, 17, 23]
. The data is known to have a bathtub-shaped FR function.
Table 2. Aarset Data of 50 Devices.
0.1 | 0.2 | 1 | 1 | 1 | 1 | 1 | 2 | 3 | 6 |
7 | 11 | 12 | 18 | 18 | 18 | 18 | 18 | 21 | 32 |
36 | 40 | 45 | 46 | 47 | 50 | 55 | 60 | 63 | 63 |
67 | 67 | 67 | 67 | 72 | 75 | 89 | 82 | 82 | 83 |
84 | 84 | 84 | 85 | 85 | 85 | 85 | 85 | 86 | 86 |
Table 3. Descriptive statistics for the Aarset data.
N | Min. | 1st Qu. | Median | Mean | Sd. | 3rd Qu. | Max. |
50 | 0.10 | 13.5 | 48.5 | 45.69 | 32.84 | 81.25 | 86.0 |
We consider the Akaike Information Criterion (AIC), Bayesian Information Criterion (BIC) and Corrected Akaike Information Criterion (AICc) for model selection. The model with smaller values is considered to be the best model.
Table 4. Estimated values, standard errors in bracket and summary values of the fitted models fitted.
Model | Lambda | Theta | Alpha | Beta | Loglik | AIC | BIC | AICc |
ADC | -0.55640 (0.01701) | -0.25385 (0.01327) | 0.07325 (0.05181) | 0.24405 (0.05319) | -188.54 | 385.08 | 383.88 | 377.96 |
AddC | 2.08×10⁻¹⁷ (1.1×10⁻²²) | 0.822 (0.0165) | 0.05977 (0.00059) | 0.249 (0.00711) | -203.05 | 414.12 | 421.76 | 406.88 |
ACW | 0.01118 (0.00039) | 86.231 (2.414) | 0.04215 (1.0×10⁻⁵) | 0.278 (0.0224) | -205.35 | 418.71 | 426.36 | 411.58 |
APW | 0.443 (0.01921) | 0.05320 (0.04221) | 7.16×10⁻¹⁷ (1.1×10⁻¹⁹) | 0.688 (0.01025) | -212.87 | 433.75 | 441.44 | 426.62 |
Table 4 above displays the MLEs of the models’ parameters as well as the value of log-likelihood, AIC, BIC, and AICc statistic. It is observed that the values of AIC, BIC, AICc of the ADC model appear to be the smallest among the competitive models, hence the ADC distribution appears to be a very competitive for the dataset.
5.2. Analysis on Failure and Running Times of 30 Devices
Table 5 present data of failure and running times of 30 devices reported by
| [16] | Meeker WQ, Escobar LA. Statistical Methods for Reliability Data. New York: Wiley; 1998. |
[16]
and was studied extensively by several authors among which include
| [17] | Méndez-González, L. C.; Rodríguez-Picón, L. A.; Pérez-Olguin, I. J. C.; Vidal Portilla, L. R. An Additive Chen Distribution with Applications to Lifetime Data. Axioms 2023, 12, 118. https://doi.org/10.3390/ axioms12020118 |
| [23] | Thach, T. T., & Briš, R. (2021). An additive Chen-Weibull distribution and its applications in reliability modeling. Quality and Reliability Engineering International, 37(1), 352–373. https://doi.org/10.1002/qre.2740 |
[17, 23]
.
Table 5. Meeker and Escober Data of 30 devices.
2 | 10 | 13 | 23 | 23 | 28 | 30 | 65 | 80 | 88 |
106 | 143 | 147 | 173 | 181 | 212 | 245 | 247 | 261 | 266 |
275 | 293 | 300 | 300 | 300 | 300 | 300 | 300 | 300 | 300 |
Table 6. Descriptive statistics for the Meeker and Escober data of 30 devices
N | Min. | 1st Qu. | Median | Mean | Sd. | 3rd Qu. | Max. |
30 | 2.00 | 68.75 | 196.50 | 177.03 | 114.99 | 298.25 | 300.00 |
Table 7. Estimated values, standard errors in bracket and summary values of the fitted models.
Estimated Parameters |
Model | Lambda | Theta | Alpha | Beta | Loglik | AIC | BIC | AICc |
ADC | -1.1078 (0.0146) | -0.1481 (0.0189) | 0.0004 (2.22×10⁻⁴) | 0.3615 (0.0141) | -114.73 | 237.47 | 235.37 | 238.60 |
AddC | 0.407 (0.01146) | 8.419×10⁻² (0.001654) | 3.042×10⁻¹¹ (5.958×10⁻¹³) | 0.561 (0.00711) | -147.89 | 303.77 | 311.42 | 301.68 |
ACW | 0.0033 (0.000017) | 259.427 (14.558) | 0.01518 (0.00210) | 0.260 (0.00301) | -151.34 | 310.67 | 316.28 | 308.58 |
APW | 0.08802 (0.002114) | 0.00111 (0.00933) | 5.14×10⁻¹² (8.06×10⁻⁸) | 0.807 (0.172) | -167.91 | 343.82 | 349.42 | 341.73 |
Table 7 above displays the MLEs of the models’ parameters as well as the value of log-likelihood, AIC, BIC, and AICc statistic. It is observed that the ADC distribution has the least values of AIC, BIC, AICc and hence considered to be the best model.
6. Conclusions
In this article, we developed a new four-parameter lifetime distribution with application to two real reliability data sets which are well known from existing literature. This distribution combines the failure rates of the Dhillon and Chen distributions using an additive methodology, accommodating both monotonic and non-monotonic behavior. The study explores the distribution’s properties and applies it to real-life datasets, evaluating its goodness-of-fit through various information criteria. The results, based on parameter estimation from the real-life data, indicate that the ADC distribution fits the data well. Consequently, it is concluded that the ADC distribution offers a valuable alternative for modeling datasets with both monotonic and non-monotonic behavior.
Abbreviations
AddC | Additive Chen |
ADC | Additive Dhillon-Chen |
AIC | Akaike Information Criterion |
AICc | Corrected Akaike Information Criterion |
ACW | Additive Chen Weibull |
APW | Additive Perks Weibull |
BIC | Bayesian Information Criterion |
CDF | Cumulative Distribution Function |
CFR | Constant Failure Rate |
FR | Failure Rate |
MGF | Moment Generating Function |
MLE | Maximum Likelihood Estimation |
PDF | Probability Density Function |
Author Contributions
Faisal Muhammad Amiru: Conceptualization, Data curation, Formal Analysis, Methodology, Resources, Software, Writing – original draft
Umar Usman: Supervision, Validation, Visualization, Writing – review & editing
Suleiman Shamsuddeen: Supervision, Validation, Visualization, Writing – review & editing
Umar Muhammad Adamu: Data curation, Methodology, Resources, Software
Badamasi Abba: Validation, Visualization, Writing – review & editing
Conflicts of Interest
The authors declare no conflicts of interest.
Appendix
Let and
This implies that, and
By apply quotient rule, we have
Also,
Now, let , implies and , then
(A-1)
(A-2)
Where the integral is intricated and can thus be evaluated numerically.
Where
are given in equations (
2) and (
3) respectively
Similarly,
References
| [1] |
Aarset, M. V. (1978). How to identify a bathtub hazard rate. IEEE Transaction reliability 36(1).
|
| [2] |
Abba, B. Hong W., Mustapha M., & Hassan S. B. (2023). A robust bathtub-shaped failure time model for a two-component system with application to complete and censored reliability data. Taylor and Francis group, quality technology and quantitative management.
https://doi.org/10.1016/j.ress.2022.108460
|
| [3] |
Ahmad, A. E. B. A., & Ghazal, M. G. M. (2020). Exponentiated additive Weibull distribution. Reliability Engineering and System Safety, 193, 106663.
https://doi.org/10.1016/j.ress.2019.106663
|
| [4] |
Bai, X., Shi, Y., Liu, Y., Ng, H. K. T. (2018). Statistical analysis of competing risks model from Marshal-Olkin extended Chen distribution under adaptive progressively interval censoring with random removals. Communication in Statistics-Theory and Method. 48(3) 1-20.
https://doi.org/10.1080/03610926.2018.1481973
|
| [5] |
Bakouch, H. S., & Abd El-Bar, A. M. T. (2017). A new weighted Gompertz distribution with applications to reliability data. Applications of Mathematics, 62(3), 269–296.
https://doi.org/10.21136/AM.2017.0277-16
|
| [6] |
Chaubey, Y. P., & Zhang, R. (2015). An extension of Chen’s family of survival distributions with bathtub shape or increasing hazard rate function. Computational Statistics - Theory and Methods, 44(19), 4049–4064.
https://doi.org/10.1080/03610926.2014.997357
|
| [7] |
Chen, Z. (2000). A new two-parameter lifetime distribution with bathtub shape or increasing failure rate function. Statistics & Probability Letters, 49(2), 155–161.
https://doi.org/10.1016/S0167-7152(00)00044-4
|
| [8] |
Dey, S., Kumar D., Pedro L. R., & Francisco, L. (2016). Exponentiated Chen distribution: properties and estimations. Communication in Statistics-Simulation and Computation.
https://doi.org/10.1080/03610918.2016.1267752
|
| [9] |
Dhillon, B. S. (1980). Statistical function to represent various types of hazard rates. Microelectron Reliab. 20(0) 581-584.
|
| [10] |
Gupta R and D. Kundu, “Generalized exponential distribution,” Aust NZJ Stat, vol. 41, pp. 173–188, 1999.
|
| [11] |
Kalantan, Z. I.; Binhimd, S. M. S.; Salem, H. N.; AL-Dayian, G. R.; EL-Helbawy, A. A.; Elaal, M. K. A. Chen-Burr XII Model as a Competing Risks Model with Applications to Real-Life Data Sets. Axioms 2024, 13, 531.
https://doi.org/10.3390/axioms13080531
|
| [12] |
Khan, M. S., King, R., & Hudso, I. (2018). Kumaraswamy exponentiated Chen distribution for modelling lifetime data. Applied Mathematics and Information Sciences 12(3).
http://dx.doi.org/10.18576/amis/120317
|
| [13] |
Kosky, P., Balmer, R., Keat, W., & Wise, G. (2021). Industrial engineering. In Explor. Eng (pp. 229–257). Elsevier.
https://doi.org/10.1016/B978-0-12-815073-3.00011-9
|
| [14] |
Lu, W., & Chiang, J. (2018). On some life distributions with flexible failure rate. Quality Technology & Quantitative Management, 15(3), 413–433.
https://doi.org/10.1080/16843703.2016.1226596
|
| [15] |
Muhammad, M., Liu, L., Abba, B., Muhammad, I., Bouchane, M., Zhang, H., & Musa, S. (2022). A new extension of the topp–Leone-family of models with applications to real data. Annals of Data Science, 10(1), 225–250.
https://doi.org/10.1007/s40745-022-00456-y
|
| [16] |
Meeker WQ, Escobar LA. Statistical Methods for Reliability Data. New York: Wiley; 1998.
|
| [17] |
Méndez-González, L. C.; Rodríguez-Picón, L. A.; Pérez-Olguin, I. J. C.; Vidal Portilla, L. R. An Additive Chen Distribution with Applications to Lifetime Data. Axioms 2023, 12, 118.
https://doi.org/10.3390/ axioms12020118
|
| [18] |
Mendez-Gonzalez, L. C., Rodriguez-Picon, L. A., Perez-Olguin, I. J. C., Perez-Dominguez, L. A., & Cruz, D. L. (2022). The alpha power Weibull transformation distribution applied to describe the behavior of electronic devices under voltage stress profile. Quality Technology & Quantitative Management, 1–29.
https://doi.org/10.1080/16843703.2022.2148884
|
| [19] |
Saboor, A., Bakouch, H. S., & Nauman Khan, M. (2016). Beta Sarhan–Zaindin modified Weibull distribution. Applied Mathematical Modelling, 40(13–14), 6604–6621.
https://doi.org/10.1016/j.apm.2016.01.033
|
| [20] |
Shakil, M., Kibria, B. M. G., & Elgarhy, M. (2018). A new extension of the exponential power distribution with application to lifetime data. International Journal of Computational Intelligence Systems, 05(02), 72–84.
https://doi.org/10.12785/ijcts/050202
|
| [21] |
Shuaib, M. K., Robert K., & Irene L. H (2018). Kumaraswamy Exponentiated Chen distribution for modeling lifetime data. An international journal of applied mathematics and information sciences, 12(3) 1-7.
https://doi.org/10.18576/amis/paper*25-4-2018
|
| [22] |
Spakota L. P., & Kumar V. (2023). Chen exponential distribution with application to engineering data. International journal of statistics and reliability engineering, 10(1), 33-47.
|
| [23] |
Thach, T. T., & Briš, R. (2021). An additive Chen-Weibull distribution and its applications in reliability modeling. Quality and Reliability Engineering International, 37(1), 352–373.
https://doi.org/10.1002/qre.2740
|
| [24] |
Xie, M. & Lai C. D. (1996). Reliability analysis using an additive Weibull model with bathtub-shaped failure rate function. Reliability Engineering & System Safety, 52(1), 87-93.
https://doi.org/10.1016/0951-8320(95)00149-2
|
| [25] |
Wang, H., Abba, B., & Jianxin, P. (2022). Classical and Bayesian estimations of improved Weibull–Weibull distribution for complete and censored failure times data. Applied Stochastic Models in Business and Industry, 38(6), 997–1018.
https://doi.org/10.1002/asmb.2698
|
| [26] |
Zhang, T., & Xie, M. (2011). On the upper truncated Weibull distribution and its reliability implications. Reliability Engineering and System Safety, 96(1), 194–200.
https://doi.org/10.1016/j.ress.2010.09.004
|
Cite This Article
-
APA Style
Amiru, F. M., Usman, U., Shamsuddeen, S., Adamu, U. M., Abba, B. (2025). The Additive Dhillon-Chen Distribution: Properties and Applications to Failure Time Data. International Journal of Statistical Distributions and Applications, 11(1), 1-10. https://doi.org/10.11648/j.ijsda.20251101.11
 Copy
|
Copy
|
 Download
ACS Style
Amiru, F. M.; Usman, U.; Shamsuddeen, S.; Adamu, U. M.; Abba, B. The Additive Dhillon-Chen Distribution: Properties and Applications to Failure Time Data. Int. J. Stat. Distrib. Appl. 2025, 11(1), 1-10. doi: 10.11648/j.ijsda.20251101.11
Copy
|
Download
AMA Style
Amiru FM, Usman U, Shamsuddeen S, Adamu UM, Abba B. The Additive Dhillon-Chen Distribution: Properties and Applications to Failure Time Data. Int J Stat Distrib Appl. 2025;11(1):1-10. doi: 10.11648/j.ijsda.20251101.11
Copy
|
Download
-
@article{10.11648/j.ijsda.20251101.11,
  author = {Faisal Muhammad Amiru and Umar Usman and Suleiman Shamsuddeen and Umar Muhammad Adamu and Badamasi Abba},
  title = {The Additive Dhillon-Chen Distribution: Properties and Applications to Failure Time Data},
  journal = {International Journal of Statistical Distributions and Applications},
  volume = {11},
  number = {1},
  pages = {1-10},
  doi = {10.11648/j.ijsda.20251101.11},
  url = {https://doi.org/10.11648/j.ijsda.20251101.11},
  eprint = {https://article.sciencepublishinggroup.com/pdf/10.11648.j.ijsda.20251101.11},
  abstract = {To measure the average lifespan of systems and components, and to analyze lifetime data with a monotonic failure rate, distributions such as Weibull, Exponential, and Gamma are commonly used in reliability and survival studies. However, these distributions are not suitable for datasets with non-monotonic patterns like the bathtub curve. To address this, the Chen distribution, which accommodates increasing or bathtub-shaped failure rates, has been proposed. Yet, this model lacks a scale parameter. This article presents a new four parameter lifetime distribution with bathtub-shaped failure rate called Additive Dhillon-Chen (ADC) distribution. We applied the additive methodology to establish the model, for which the Dhillon distribution was considered as baseline distribution. Some statistical properties such as quartile function, mode, moment and moment generating function, order statistics and asymptotic behavior of the distribution are studied. Parameters of the distribution are estimated using the maximum likelihood estimation method. The ADC distribution is applied to two lifetime dataset and compared with an existing distribution in the literature. Model selection was carried out based on Log-likelihood, Akaike Information Criterion (AIC), Bayesian Information Criterion (BIC), and Corrected Akaike Information Criterion (AICc). The results, based on parameter estimation from real-life data, demonstrate that the ADC distribution fits the data well and offers a valuable alternative for modeling datasets with non-monotonic behavior.},
 year = {2025}
}
Copy
|
Download
-
TY  - JOUR
T1  - The Additive Dhillon-Chen Distribution: Properties and Applications to Failure Time Data
AU  - Faisal Muhammad Amiru
AU  - Umar Usman
AU  - Suleiman Shamsuddeen
AU  - Umar Muhammad Adamu
AU  - Badamasi Abba
Y1  - 2025/02/11
PY  - 2025
N1  - https://doi.org/10.11648/j.ijsda.20251101.11
DO  - 10.11648/j.ijsda.20251101.11
T2  - International Journal of Statistical Distributions and Applications
JF  - International Journal of Statistical Distributions and Applications
JO  - International Journal of Statistical Distributions and Applications
SP  - 1
EP  - 10
PB  - Science Publishing Group
SN  - 2472-3509
UR  - https://doi.org/10.11648/j.ijsda.20251101.11
AB  - To measure the average lifespan of systems and components, and to analyze lifetime data with a monotonic failure rate, distributions such as Weibull, Exponential, and Gamma are commonly used in reliability and survival studies. However, these distributions are not suitable for datasets with non-monotonic patterns like the bathtub curve. To address this, the Chen distribution, which accommodates increasing or bathtub-shaped failure rates, has been proposed. Yet, this model lacks a scale parameter. This article presents a new four parameter lifetime distribution with bathtub-shaped failure rate called Additive Dhillon-Chen (ADC) distribution. We applied the additive methodology to establish the model, for which the Dhillon distribution was considered as baseline distribution. Some statistical properties such as quartile function, mode, moment and moment generating function, order statistics and asymptotic behavior of the distribution are studied. Parameters of the distribution are estimated using the maximum likelihood estimation method. The ADC distribution is applied to two lifetime dataset and compared with an existing distribution in the literature. Model selection was carried out based on Log-likelihood, Akaike Information Criterion (AIC), Bayesian Information Criterion (BIC), and Corrected Akaike Information Criterion (AICc). The results, based on parameter estimation from real-life data, demonstrate that the ADC distribution fits the data well and offers a valuable alternative for modeling datasets with non-monotonic behavior.
VL  - 11
IS  - 1
ER  -
Copy
|
Download