Abstract
Food insecurity is the main challenge in Africa, particularly, in Ethiopia. The government of Ethiopia tacked such problems with an agricultural-led Industrialization policy and a strategy of innovation, and dissemination of new agricultural technologies. Rice is among the emphasis of food security crops to improve its genetics, and to be used by smallholder farmers to boost their agricultural productivity and ensure their food security. The research used a simple and systematic sampling technique to take 180 smallholder rice producers to examine the impact of improved rice variety adoption on smallholders' food security in Northwestern Ethiopia. The research used descriptive statistics, the Probit model, and the Propensity Score Matching models. The probit regression identified that Rice farm experience, soil fertility, Access to credit, access to extension service, Mobile phone, and owning more livestock are the factors that positively influence the adoption of improved rice variety and statistical significance at 10%, 5%, 10%, 5%, 1% respectively whereas Distance to cooperatives, distance to main road, and distance to markets are factors that influenced the improved rice variety adoption negatively and statistically significance at 1%, 1%, 1% respectively. The propensity Score Matching Model revealed that the adopters of improved rice variety produced more rice output and consumed more rice output in terms of calorie intake as well as food and non-food consumption. This directly improved the food security status of smallholder Adopters compared to the non-adopters. Therefore, governmental and non-governmental organizations should focus on outreach of improved agricultural technologies to ensure food security at household levels.
Keywords
Food Security, PSM, Adoption, Impact, Improved Rice Variety, Adopters and Non-adopter
1. Introduction
Nowadays, food insecurity is the main challenge for many country leaders in the world in developed and developing countries. Food insecurity is more severe, expanded, and rooted due to high population growth, expansion of urbanization, a decrease in farmlands, and climate changes that caused more people to be food insecure and malnutrition in the world
| [1] | Godfray, H. C. J., Beddington, J. R., Crute, I. R., Haddad, L., Lawrence, D., Muir, J. F., Pretty, J., Robinson, S., Thomas, S. M., Toulmin, C, "Food Security: The Challenge of feeding 9 Billion People," Science, pp. 812-818, 2010. |
[1]
.
| [2] | FAOSTAT, "The state of food security in the World," Food and Agriculture Organization of the Rome, 2020. |
[2]
data showed that about 1 billion people are food insecure in the world and 30% of them live in Sub-Saharan African Countries and more than half of these are living in East African countries.
Ethiopia, as part of East Africa, is entrenched with food insecurity problems, and many of its population suffer from the causes of food insecurity. One implication of the food insecurity problem is the country's poverty rate, which reached up to 52% during the Derig regime and later decreased to 38.9% in 2004 and 29.6% in 2012. To tackle such a problem, the Ethiopian Government (EG) has implemented different policies and strategies. Agricultural development-led industrialization is one of the EG policies implemented since the 1990s. it also follows many strategic options like rural development policy and strategy, sustainable development and poverty reduction, innovation, releasing, dissemination of new agricultural technologies, demonstration and experience sharing of these technologies among researchers, experts, and smallholder farmers, and productive safety net programs that emphasis on rehabilitation of eroded farmland and natural resources. It emphasizes the enhancement of production and productivity of the Agricultural sector particularly the staple food and cash crops to lift millions of people from the food insecurity trap. Boosting staple food crop production and productivity through the adoption of improved agricultural technologies such as farm tools, improved seed, inorganic fertilizer, agrochemicals and agronomic practices like row planting with the backstopping of researchers and Development Agents helped smallholder farmers to food secure themselves as well as supply surplus of product to market.
Rice is the recently introduced crop to Ethiopia and is widely cultivated and consumed by smallholder farmers, especially in North Western Ethiopia, particularly in the Benshagul Gumuz and Amhara regions. It is the promising food security crop called a millennium crop and It is the main livelihood of smallholder farmers in North Western Ethiopia at smallholder farmers that stands second in terms of productivity next to maize and it covers 0.81% in area and 0.89% in production out of all cereal crop
| [3] | ESS, "AREA AND PRODUCTION OF MAJOR CROPS PRIVATE PEASANT HOLDINGS, MEHER SEASON," Ethiopia Statistical Service, Addis Ababa, 2020. |
[3]
.
As a result, it has become a strategic food security crop in the Ministry of Agriculture (MoA) and Ethiopia Institute of Agricultural Research (EIAR) since the 1990s devoted to innovating new and improved rice varieties, agronomic practices, and its adaptability to different agroecology to enhance the production and productivity of rice. 43 new improved rice varieties have been released to support and accelerate the food security of the country during the last decade and a half. They are suitable for lowland, upland, and irrigated rice varieties. Adopting the new rice varieties has a massive role in rice production and productivity, enhancing the income of smallholder farmers and lifting them from food insecure status.
| [4] | J. Moti, K. Menale and M. Paswel, "Impact of Improved Maize Variety Adoption on Household Food Security in Ethiopia," International Association of Agricultural Economists, pp. 1-26, 2015. |
[4]
stated that adopters of improved maize varieties were more food secure than their counterparts. Even though many improved rice varieties have been released, conducted biological research, and entered into the production system at the smallholder farmers' level the adoption rate of improved rice varieties is still low
| [5] | Getaye Gizaw, Muhdin Muhamedhussen, Sisay Tolla, "TECHNOLOGICAL ADOPTION AND ITS IMPACT ON RICE PRODUCTION: CASE STUDIES OF FOGERA WEREDA–SOUTH GONDAR ZONE, AMHARA NATIONAL REGIONAL STATE, ETHIOPIA," Jimma University, pp. 1-90, 2017. |
[5]
. There is limited research conducted on the socioeconomic part of rice research. Moreover, the adoption status of rice varieties and their impact on food security at the household level has not yet been studied. Hence this research is intended to investigate the adoption rate of improved rice variety in northwestern Ethiopia and its impact on food security status at the household level.
2. Research Methodology
2.1. Description of the Study Area
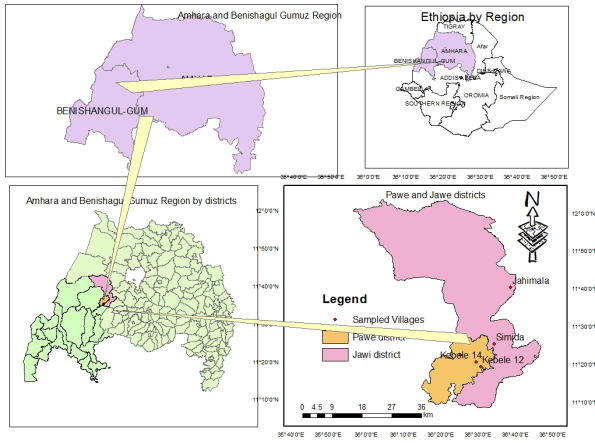
The research was conducted in the Pawe and Jawi districts located in the Metekel and Awi zones, respectively, within the Benishangul Gumuz and Amhara regions of Northwestern Ethiopia. Pawe and Jawi are geographically located at 36°27’21.88’’- 36°28’22.95’’ longitude and latitude of 11°20’04.93’’-11°17’50.43’’and latitude of 11°20’04.93’’-11°17’50.43’ and 36°29’17.58’’ longitude and latitude of 11°33’22.68’’Respectively. Pawe lies approximately 567 kilometers northwest of Addis Ababa and spans an area of 63,400 hectares, with an estimated population of 59,127, of which 50.76% are male. The area is characterized by a mixed crop-livestock farming system, with rice ranking second in productivity among cereal crops. It experiences a warm, humid climate with high rainfall, receiving an annual average of 1,586.32 mm. The altitude of the district is about 1,120 meters, and its annual mean temperature ranges from 16°C to 32°C.
Jawi, located 602 kilometers northwest of Addis Ababa, covers a larger area of 515,400 hectares and has an estimated population of 122,259, with 53.08% male. Similar to Pawe, the district follows a mixed crop-livestock farming system, with rice also ranking second among cereal crops in productivity. Jawi features a warm, humid climate with unimodal rainfall patterns, averaging 1,250 mm annually. The altitude ranges between 700 and 1,500 meters, with annual mean temperatures varying from 16°C to 32°C.
Both districts are situated in lowland areas with favorable climatic conditions for rice cultivation, making them ideal locations for this study.
Figure 1. Map of the Study Area.
2.2. Sampling Method and Sample Size Determination
The study adopted multi-stage probability sampling methods from Awi and Metekel zones. In the first and second stages Districts and kebles were selected randomly and Finally, Rice producers were selected using a systematic sampling method and probability proportion to sample size.
The total sample size was determined based on the following formula
| [6] | W. Cochran, Sampling techniques. John Wiley & Sons, 2007. |
[6]
.
Where
n - Is the number of sample size, Z - Is 95% confidence
p - Is 0.4 (proportion of the population to be included in the sample i.e 40%)
q – Is 0.6 proportion of the population not to be included in the sample i.e 60%)
e - Is the margin of error or degree of accuracy desired (0.05)
According to this formula, 180 sample households were taken from the two districts.
Table 1. Smallholder farmers’ rice producers by district and Keble.
District | Keble | # of sample units selected | Share of sample in % |
Pawe | Keble 12 | 45 | 25 |
Keble 14 | 50 | 27.78 |
Jawe | Smida | 35 | 19.44 |
Jahimala | 50 | 27.78 |
| Total | 180 | 100 |
Source: (Survey data, 2019)
2.3. Types and Methods of Data Collection
The study utilized both primary and secondary data sources. Primary data were gathered through structured questionnaires administered via face-to-face interviews with selected rice-producing households. Trained enumerators conducted these interviews to ensure accuracy and consistency in data collection. Secondary data were obtained from various published and unpublished sources, including reports and records from district and zonal administrative offices.
2.4. Methods of Data Analysis
2.4.1. Descriptive Data Analysis
The research used descriptive statistics, such as mean, standard deviation, percentage frequency, T-test, and graphs, to describe the socio-economic and demographic characteristics of the sample households.
2.4.2. Econometric Model Analysis
This study used a probit regression model to determine the factors influencing improved rice variety adoption in Northwestern Ethiopia. Some authors also used this model to investigate the determinants of improved crop variety adoption in sorghum, sesame, and rice
| [7] | Abdulkarim Ahmed Mumed, Abdi Hassen Habib, "Adoption of Improved Sorghum Variety (Melkam) and Its Impact on Household Food Security in Babile District, Eastern Ethiopia," Journal of Advances in Humanities Research, pp. 13-28, 2023. |
| [8] | Walelgn Yalew, Sisay Yehuala, Tigist Petros, "Determinants of the Adoption of Improved Sorghum and Sesame Seeds; the Case of West Gondar Zone, Ethiopia," International Journal of Energy and Environmental Science, pp. 82-89, 2020. |
| [9] | Abebaw Assaye, Endeshaw Habte, and Seiichi Sakurai, "Adoption of improved rice technologies in major rice producing areas of Ethiopia: a multivariate probit approach," Agriculture & Food Security, pp. 1-19, 2023. |
[7-9]
respectively.
This research also used the propensity Score Matching model (PSM) to investigate the impact of improved rice variety adoption on smallholder farmers' food security in northwestern Ethiopia.
| [7] | Abdulkarim Ahmed Mumed, Abdi Hassen Habib, "Adoption of Improved Sorghum Variety (Melkam) and Its Impact on Household Food Security in Babile District, Eastern Ethiopia," Journal of Advances in Humanities Research, pp. 13-28, 2023. |
| [10] | Welay Tesfay, Belete Woundiferaw, "Impact of Improved Rice Variety Adoption on Smallholder Farmers Rice Productivity and Gross Farm Income Enhancement in North Western Ethiopia," International Journal of Agricultural Economics, pp. 110-119, 2024. |
| [11] | Abel Kwaku K. Bruce, Samuel A. Donkoh* and Michael Ayamga, "Improved rice variety adoption and its effects on farmers’ output in Ghana," Journal of Development and Agricultural Economics, pp. 342-348, 2014. |
[7, 10, 11]
used propensity score matching to estimate the impact of improved crop variety adoption, while
| [4] | J. Moti, K. Menale and M. Paswel, "Impact of Improved Maize Variety Adoption on Household Food Security in Ethiopia," International Association of Agricultural Economists, pp. 1-26, 2015. |
| [12] | Bobah Brillant Sisang, Jong In Lee, "Impact of Improved Variety Adoption on Rice Productivity and Farmers’ Income in Cameroon: Application of Propensity Score Matching and Endogenous Switching Regression," Journal of Agricultural, Life and Environmental Sciences, pp. 26-46, 2023. |
| [13] | Md. Shahin Mia, Md. Taj Uddin, Humayun Kabir, Md. Abdul Monayem Miah, Md. Abdus Salam, "Adoption Analysis of BADC Produced Boro Rice Seed and Its Impact on Farm Household Food Security in Bangladesh," International Journal of Agricultural Economics, pp. 76-88, 2024. |
[4, 12, 13]
were used to combine the propensity score matching and endogenous switching regression model. ESR is unable to estimate the counterfactual effects. Therefore, the research used PSM The only limitation is the inability to control unobservable factors. This can be treated by taking sensitivity analysis.
Proper scoring Matching
Rosenbaum and Rubin defined the propensity score as the conditional probability of receiving treatment given a vector of observable factors
| [14] | Rosenbaum, P. R., & Rubin, D. B., "propensity score in observational studies for causal effects," Bio-metrika, pp. 41-55, 1983. |
[14]
. The propensity score represents the probability of selecting a therapy based on observed variables. The PSM method was used to estimate the impact of improved rice variety adoption on the food security status of adopters and non-adopters of improved rice beneficiaries.
The propensity score matching model is expressed as follows
Where, Q(x) is the propensity score, F= {1, 0} is the treatment variable or the dummy adoption variable and D is a vector of farmers' characteristics. The average treatment effect on the treated (ATT) is then computed using the estimated propensity scores. An indicator of how adoption affects adopters is provided by the ATT. Farmers face two potential outcomes (Y) given their adoption status (F) such that G = G0 if F = 0 and G = G1 if F = 1. E (G1 – G0) indicates the average treatment effect on the treated (ATT). The ATT may alternatively be written as E(G1|F= 1) – E(G0|F = 1). A logit) model is typically used to specify the selection equation in propensity score matching
| [15] | B. T. Anang, "are adopters of improved rice varieties more productive than non-adopters? empirical evidence from northern Ghana," Ghana Journal of Development Studie, pp. 92-107, 2019. |
[15]
. The logit adoption model used in this study was defined as an index function using Gi, an unobserved continuous variable, as shown in the equation
(3)
Where,
Gi = Food security outcome (1 for food secure and 0 for food insecure)
Di = Vector of farm and household characteristics βi = Vector of parameters to be estimated and εi = Random error.
3. Results and Discussion
3.1. Descriptive Statistics of the Demographic and Socioeconomic Characteristics of Sampled Households
The majority of the households in the sample (87.22%) were headed by males, while 12.78% were led by females. On average, 52.78% of the sampled households received agricultural extension services in the study area. However, only 46.11% of the respondents considered their land to be fertile. The chi-square (chi²) analysis showed that soil fertility had a significant and positive effect, statistically significant at the 5% level, on the adoption of improved rice varieties.
In terms of training, only 34.44% of rice producers had received instruction on rice production techniques during the 2018/19 crop production season. The chi² analysis revealed that this training positively influenced adoption rates, with statistical significance at the 5% level.
Membership in cooperatives was observed in almost half of the households (47.22%) in the study area. Among these, 26.67% were adopters of improved rice varieties, while 20.56% were non-adopters. The chi² analysis further indicated that cooperative membership positively impacted adoption, with statistical significance at the 1% level.
Finally, a majority of the households (61.67%) owned mobile phones, which they used to access timely information on improved rice varieties, inorganic fertilizers, and the production and marketing of agricultural products. According to the chi² analysis, mobile phone ownership had a positive and statistically significant effect on adoption, at the 10% level.
Table 2. Summary Statistics for Dummy Variables.
Dummy variables | Adopters | Non-Adopters | Total | X2 |
Sex (adopter) | 80 | 100 | 180 | 0.01 |
Male | 70 | 87 | 157 | |
Extension Contact | 80 | 100 | 180 | 1.28 |
Yes | 46 | 49 | 95 | |
Soil Fertility | 80 | 100 | 180 | 5.95** |
Yes | 45 | 38 | 83 | |
Trained in Rice Production | 80 | 100 | 180 | 5.52** |
Yes | 35 | 27 | 62 | |
Member of Cooperative | 80 | 100 | 180 | 9.43*** |
Yes | 48 | 37 | 85 | |
Own Mobile Phone | 80 | 100 | 180 | 3.05* |
Yes | 55 | 56 | 111 | |
Source: (Survey data, 2019)
3.2. Descriptive Statistics of the Demographic and Socioeconomic Characteristics of Sampled Households for Continuous Variables
The sample households are complete of grade on average. Adopters are more educated than non-adopters. The T- T-statistics showed statistical significance at 5% and a positive effect on adopting improved rice variety. Adopters of improved rice varieties are nearer to the district market than the non-adopters of improved rice varieties by six minutes. it is statistically significance at 1% and positive effect on the adoption of improved rice variety.
Table 3. Demographic and Socio-economic Characteristics of Sample Households.
Continuous variables | Adopter | Non-Adopter | Whole sample | T-Value |
Age | 41.60 | 43.02 | 42.38 | 1.22 |
Education | 1.54 | .98 | 1.23 | 2.64** |
Rice Farme experience | 5.48 | 5 | 5.21 | 1.22 |
Total farmland owned | 2.92 | 2.98 | 2.95 | 0.65 |
Land Allocated for rice | 0.589 | 0.59 | 0.59 | 0.12 |
Owned animal in TLU | 4.5 | 4.39 | 4.44 | 0.40 |
Distance to FTC in KM | 1.75 | 1.95 | 1.86 | 1.64 |
Distance to district market in Min | 22.94 | 28.53 | 26.04 | 8.33*** |
Distance to cooperative in KM | 1.34 | 1.52 | 1.44 | 1.26 |
Distance to milling paddy rice in KM | 1.57 | 1.50 | 1.53 | 0.47 |
Distance to main Road in Km | 0.39 | 0.81 | 0.63 | 4.78 |
Source: (Survey data, 2019)
3.3. Determinants of Adopting Improved Rice Varieties in Northwestern Ethiopia
The probit model estimated the factors that determine the adoption rate of improved rice variety in Northwestern Ethiopia. Rice farm experience, soil fertility, Access to credit, access to extension service, mobile phone, and owning more livestock are the factors that positively influence the adoption of improved rice variety. Distance to cooperatives, distance to main road, and distance to markets are factors that influenced the rice variety adoption negatively. Each of the variables is described as follows.
Rice farm experience: - sample respondents who are more experienced in the production of specific crops, particularly rice exposed to adopting improved rice variety. The farmers need to maximize their rice product from their given area. Therefore, they need new technology to maximize their rice outputs and this influenced them to adopt improved rice variety. It is significant and positively affected the rice adoption at 10%. Being all variables constant, Rice farm experience has a 4% probability of adopting improved rice variety the result is in line with
| [8] | Walelgn Yalew, Sisay Yehuala, Tigist Petros, "Determinants of the Adoption of Improved Sorghum and Sesame Seeds; the Case of West Gondar Zone, Ethiopia," International Journal of Energy and Environmental Science, pp. 82-89, 2020. |
| [16] | Y. Asmelash, "Determinants of adoption of upland rice varieties in Fogera district, South Gondar, Ethiopia," Journal of Agricultural Extension and Rural Development, pp. 332-338, 2014. |
[8, 16].
Soil fertility: - The more fertile their land the sample households being confidential on adoption improved rice variety. This is because farmers more fertile land gives more output and helped to repaid their input expense credits that borrowed or taking by gifts to repaid after harvesting of their output. It influences the rice variety adoption at a positive and statistically significant 5%. The marginal effect tells us, that Soli fertility has a 21% increment of the probability of adopting improved rice variety the same result is stated by
| [7] | Abdulkarim Ahmed Mumed, Abdi Hassen Habib, "Adoption of Improved Sorghum Variety (Melkam) and Its Impact on Household Food Security in Babile District, Eastern Ethiopia," Journal of Advances in Humanities Research, pp. 13-28, 2023. |
[7]
.
Access to credit: - Credit solves farmers' shortage of liquidity of money particularly at peak agricultural time when labor is scarce and purchasing all agricultural inputs by own capital only at the same time is difficult. Supply money to smallholder farmers is crucial at agricultural peak time to purchase improved agricultural technologies like inorganic fertilizer, improved seeds, and farm tools. As a result, Access to credit influenced the adoption of improved rice variety positively and statistically significant at 10%. The marginal effect tells us, that Soli fertility has a 26% increment of the probability of adopting improved rice variety the result is the same as
| [7] | Abdulkarim Ahmed Mumed, Abdi Hassen Habib, "Adoption of Improved Sorghum Variety (Melkam) and Its Impact on Household Food Security in Babile District, Eastern Ethiopia," Journal of Advances in Humanities Research, pp. 13-28, 2023. |
[7]
.
Access to Extension: - Currently there are three development agents per keble to consult, facilitate technology adoption, and help technical how to implement the technology at the farm level to smallholder farmers. except for socioeconomic problems, most smallholder farmers are willing to adopt more than one technology per cropping season. Consequently, access to extension services influences the adoption of improved rice variety positively and statistically significant at 5%. The marginal effect tells us, that Soli fertility has a 27% increment of the probability of adopting improved rice variety. The result is in line with
| [5] | Getaye Gizaw, Muhdin Muhamedhussen, Sisay Tolla, "TECHNOLOGICAL ADOPTION AND ITS IMPACT ON RICE PRODUCTION: CASE STUDIES OF FOGERA WEREDA–SOUTH GONDAR ZONE, AMHARA NATIONAL REGIONAL STATE, ETHIOPIA," Jimma University, pp. 1-90, 2017. |
| [13] | Md. Shahin Mia, Md. Taj Uddin, Humayun Kabir, Md. Abdul Monayem Miah, Md. Abdus Salam, "Adoption Analysis of BADC Produced Boro Rice Seed and Its Impact on Farm Household Food Security in Bangladesh," International Journal of Agricultural Economics, pp. 76-88, 2024. |
| [17] | Omotesho, O. A., Adewumi, Lawal, M., Ayinde, "Analysis of food security among rural households in Kwara State, Nigeria," African Journal of General Agriculture, pp. 1-15, 2006. |
| [9] | Abebaw Assaye, Endeshaw Habte, and Seiichi Sakurai, "Adoption of improved rice technologies in major rice producing areas of Ethiopia: a multivariate probit approach," Agriculture & Food Security, pp. 1-19, 2023. |
[5, 13, 17, 9]
.
TLU:- is the number of animals owned in tropical livestock unit that includes oxen TLU. Smallholder farmers own Livestock for draft power, sources of food like milk, eggs, and meat, saving and liquidity purposes, and social value. Particularly Smallholder farmers who own ox can easily plow their farm on time and get good yields from their crop farm. As a result, this initiated smallholder farmers to adopt improved agricultural technologies. TLU influences the improved rice variety positively and is statistically significant at 5%. The marginal effect tells us, that TLU has a 55% increment of the probability of adopting improved rice variety the result is in line with
| [13] | Md. Shahin Mia, Md. Taj Uddin, Humayun Kabir, Md. Abdul Monayem Miah, Md. Abdus Salam, "Adoption Analysis of BADC Produced Boro Rice Seed and Its Impact on Farm Household Food Security in Bangladesh," International Journal of Agricultural Economics, pp. 76-88, 2024. |
| [9] | Abebaw Assaye, Endeshaw Habte, and Seiichi Sakurai, "Adoption of improved rice technologies in major rice producing areas of Ethiopia: a multivariate probit approach," Agriculture & Food Security, pp. 1-19, 2023. |
[13, 9]
.
Own Mobile: - owning a cellphone by itself exposed farmers to different agricultural experts, agro-business, nongovernmental organizations, governmental organizations, and different social groups that easily access different agricultural technologies. Own mobile influence that adoption of improved rice variety positively and statistically significant at 1%. The marginal effect tells us, that own mobile has a 32% increment of probability of adopting improved rice variety. The same output is indicated by
| [9] | Abebaw Assaye, Endeshaw Habte, and Seiichi Sakurai, "Adoption of improved rice technologies in major rice producing areas of Ethiopia: a multivariate probit approach," Agriculture & Food Security, pp. 1-19, 2023. |
[9]
.
Distance to Cooperative: - as agricultural input suppliers are far from smallholder farmers, the farmers could access the information on improved agricultural technology delivery dates. As a result, the amount of seed will be exhausted before he comes and takes improved technologies. In other words, farmers will hate long-distance travel and improved agricultural technology time and date will leave him. Distance to cooperatives influenced the adoption of improved agricultural technologies negatively and statistically significant at 1%. The marginal effect tells us, that distance to the cooperative has 18% decreased the probability of adopting improved rice variety. The result is in line with
| [9] | Abebaw Assaye, Endeshaw Habte, and Seiichi Sakurai, "Adoption of improved rice technologies in major rice producing areas of Ethiopia: a multivariate probit approach," Agriculture & Food Security, pp. 1-19, 2023. |
[9]
.
Distance to main road: - developing all-weather roads that have easy access to agricultural technologies and transport improved technologies at affordable prices. This in turn affects smallholders' social contact with different professionals and peer farmers. As their residence is far from the main road the probability of accessing agricultural technology is some that difficult. Distance to the main road influenced the adoption of improved agricultural technologies negatively and was statistically significant at 1%. The marginal effect tells us, that the distance to the main road has 18% decreased the probability of adopting improved rice variety. The result is in line with
| [9] | Abebaw Assaye, Endeshaw Habte, and Seiichi Sakurai, "Adoption of improved rice technologies in major rice producing areas of Ethiopia: a multivariate probit approach," Agriculture & Food Security, pp. 1-19, 2023. |
[9]
.
Distance to market: The market is an important institution that meets all buyers and sellers in one place. As far as the smallholder farmers have demand and ability to buy improved agricultural tools, and inputs and sell their output, the market gave them a big chance to meet their customers both inputs and output. However, if the marketplace is far from their residence the probability of easy access to improved inputs and selling their product at a premium price based on the market information is difficult. Distance to market influenced the adoption of improved agricultural technologies negatively and statistically significant at 1%. The marginal effect tells us, that distance to market has 7% decreased the probability of adopting improved rice variety. The same result is stated by
| [12] | Bobah Brillant Sisang, Jong In Lee, "Impact of Improved Variety Adoption on Rice Productivity and Farmers’ Income in Cameroon: Application of Propensity Score Matching and Endogenous Switching Regression," Journal of Agricultural, Life and Environmental Sciences, pp. 26-46, 2023. |
| [9] | Abebaw Assaye, Endeshaw Habte, and Seiichi Sakurai, "Adoption of improved rice technologies in major rice producing areas of Ethiopia: a multivariate probit approach," Agriculture & Food Security, pp. 1-19, 2023. |
| [7] | Abdulkarim Ahmed Mumed, Abdi Hassen Habib, "Adoption of Improved Sorghum Variety (Melkam) and Its Impact on Household Food Security in Babile District, Eastern Ethiopia," Journal of Advances in Humanities Research, pp. 13-28, 2023. |
[12, 9, 7]
.
Table 4. Probit Regression for the Determinants of Improved Rice Variety in Northwestern Ethiopia.
Variables | Coef. | Robust Std. Err | P>|Z| | MFX |
SexHH | 0.24 | 0.38 | 0.53 | 0.09 |
AgeHH | -0.00 | 0.02 | 0.86 | -0.001 |
EduHH | 0.08 | 0.09 | 0.36 | 0.03 |
Riceland | -0.33 | 0.46 | 0.47 | -0.13 |
Tota own land | 0.13 | 0.21 | 0.53 | 0.05 |
Rice farm Expierence | 0.10 | 0.10 | 0.07 | 0.04 |
Soil Fertility | 0.53 | 0.53 | 0.03 | 0.21 |
Training | 0.37 | 0.37 | 0.14 | 0.15 |
Access to Credit | 0.15 | 0.15 | 0.26 | 0.06 |
Access to Extension | 0.09 | 0.27 | 0.27 | 0.04 |
TLU | 0.04 | 0.07 | 0.55 | 0.02 |
Distance to Cooperative | -0.47 | 0.13 | 0.000 | -0.18 |
Distance to road | -1.06 | 0.25 | 0.000 | -0.41 |
Distance to Market | -0.19 | 0.04 | 0.000 | -0.07 |
Own mobile | 0.86 | 0.26 | 0.001 | 0.32 |
Off- Income | -0.05 | 0.28 | 0.85 | -0.02 |
Constant | 2.96 | 1.36 | 1.36 | 0.03 |
Number of observation = 180 | Probit Chi2 = 0.000 | | |
Wald chi2(16) = 96.65 | Pseado R2 = 0.47 | | |
Wald chi2(16) = 96.65 | Pseado R2 = 0.47 | | |
Source: (Survey data, 2019)
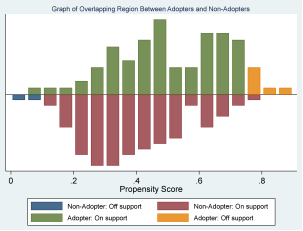
3.4. Propensity Score Distribution of the Adopter and Non-adopters
The impact of improved rice variety adoption on the food security of rice producers is estimated using propensity score by discarding the off-support and conducting sensitivity analysis to ensure unbiased and consistent average treatment effects.
Figure 2 shows the propensity score distribution of Adopters and Non-Adopters of improved rice varieties and their common support area. About 95.55% of the sample households fall in the common support area indicating that there is a good overlap of adopters and non-adopters’ distribution the finding is in line with (Moti, Menale, and Paswel 2015). These data therefore revealed themselves to matching adopters to their potential counterfactuals.
Figure 2. Common Support Area.
3.5. Effect of Adoption Improved Rice Variety on per Capital Food Consumption per Adult Equivalent in Northwestern Ethiopia
Adopting improved agricultural technologies like improved seed, inorganic fertilizer, and agronomic practices can enhance the productivity of the agricultural sector, particularly the rice sector. Smallholder Rice producers are growing rice for consumption purposes and earn income to cover some input expenses and industrial materials. As the productivity of rice increases the consumption of rice also increases at the household level. The Impact estimator of the Propensity Score Matching model revealed that the adopter of the improved rice variety obtained 751.76 kg per hectare of yield advantage over the non-adopters of the improved rice variety
| [12] | Bobah Brillant Sisang, Jong In Lee, "Impact of Improved Variety Adoption on Rice Productivity and Farmers’ Income in Cameroon: Application of Propensity Score Matching and Endogenous Switching Regression," Journal of Agricultural, Life and Environmental Sciences, pp. 26-46, 2023. |
[12]
. The T-statistics showed adoption of improved rice variety influenced the productivity of rice positively and was statistically significant at 1%. This result leads to the adopters consuming more rice outputs and selling some amount of rice than the counterfactuals. Adoption of Improved rice variety creates an opportunity to sell some amount of rice than non-adopters and to maximize their consumption utility both on food and non-food consumption over the counterparts. The Propensity Score Matching Model showed adopters of the rice variety consumed more than non-adopters in terms of total consumption per adult equivalent. The T-statistics showed adoption of improved rice variety influenced the productivity of rice positively and was statistically significant at 1%. The Model also showed adopters of rice variety more consumption of food and non-food items over the non-adopters
| [4] | J. Moti, K. Menale and M. Paswel, "Impact of Improved Maize Variety Adoption on Household Food Security in Ethiopia," International Association of Agricultural Economists, pp. 1-26, 2015. |
[4]
.
Table 5. Effect of Adopting Improved Rice on Smallholder Food Security Status.
Outcome Variable | Adopter | Non-Adopter | Difference | S.E | T-Stat |
Yield of Rice | | |
Unmatched | 3,023.40 | 1,962.87 | 1,060.53 | 124.01 | 4.95 |
ATT | 2,832.15 | 2,080.39 | 751.76 | 173.47 | 2.49 |
ATU | 2,027.75 | 2,952.10 | 924.35 | | |
ATE | | | 935.12 | | |
Total Consumption per Adult-Equivalent | |
Unmatched | 14,171.70 | 12,171.34 | 2,000.36 | 749.47 | 2.67 |
ATT | 14,133.61 | 12,094.43 | 2,039.18 | 810.58 | 2.52 |
ATU | 12,201.20 | 14,217.55 | 2,016.34 | | |
ATE | | | 2,026.17 | | |
Source: (Survey data, 2019)
3.6. Sensitivity Analysis of Food Security on Adopters and Non-Adopters
The final stage of evaluating the impact using Propensity Score Matching (PSM) involves verifying whether external variables influence the outcome variables—in this case, food security among smallholder farmers. Sensitivity analysis was conducted to assess the validity of the Conditional Independence Assumption (CIA). The analysis confirmed that the impact of adopting improved rice varieties on food security was not influenced by the external variables included in the model.
These findings underscore that the improved food security status observed among adopters of the improved rice varieties was directly attributable to the adoption itself. To further ensure the robustness of the results, a sensitivity test was conducted (as shown in
Table 6) to evaluate whether the impact of food security was influenced by exogenous factors. The test concluded that the impact on food security driven by the adoption of improved rice varieties remained unaffected by external variables.
Table 6. Sensitivity Analysis of Food Security on Adopters and Non-Adopters.
Gamma | Omega (Ω+) | Omega (Ω-) |
dx=1 | 3.2e-15 | 3.2e-15 |
dx =1.25 | 4.1e-12 | 4.1e-12 |
dx =1.5 | 2.1e-12 | 2.1e-12 |
dx =1.75 | 8.1e-12 | 8.1e-12 |
dx =2 | 1.1e-16 | 1.1e-16 |
dx =2.25 | 4.2e-15 | 4.2e-15 |
dx =2.5 | 9.1e-12 | 9.1e-12 |
dx =2.75 | 1.1e-12 | 1.1e-12 |
dx =3 | 9.1e-12 | 9.1e-12 |
Source: (Survey data, 2019)
4. Conclusion
This Research was conducted in the Pawe and Jawi districts located in the Metekel and Awi Zones respectively within the Benshagul Gumuz and Amhara regions of Northwestern Ethiopia. The main purpose of this research is to investigate the drivers and hindrances of improved rice variety adoption and their impact on smallholder rice producers' food security. Food insecurity remains a pressing issue in Ethiopia driven by factors of rapid population, shortage of farmland, explanation of urbanization, and climate changes. Despite progress over recent decades, a significant portion of the Ethiopian population remains vulnerable to food insecurity.
To tackle such a problem, the government of Ethiopia implemented an Agricultural-led industrialization policy with a strategy of innovation, release, and dissemination of new farming technologies. Among the strategies improving rice variety in Northwestern Ethiopia is a critical strategy to address these challenges, and rice is recognized as a key food security crop and economic resilience. This study investigated the determinants of improved rice adoption and their impact on smallholder rice producers' food security using both descriptive and econometric analysis. The descriptive analysis revealed that most households (87.22%) are male-headed, with adopters having a slight edge in education level, male households, access to training, and cooperative membership, which positively influence adoption.
The Econometric part revealed farm experience, soil fertility, access to credit, access to extension service, mobile phone ownership, and livestock ownership are positively influenced by the adoption of improved rice variety adoption whereas the long distance to cooperative, main road, and markets are influenced negatively. It also indicated that adopters of improved rice variety demonstrated significantly higher productivity compared to non-adopters, with a yield advantage of 751.76 kg per hectare. This increase in production directly contributes to greater food availability and higher calorie intake among adopters, enhancing food security. In addition to improved food consumption, adopters exhibited better non-food consumption patterns, suggesting that increased rice production provided surplus income that could be allocated to other necessities. Furthermore, adopters reported higher annual expenditures, both food and non-food items, compared to non-adopters.
Based on the findings, this research suggests the following recommendations
1) Strengthen Extension Services: Enhancing the capacity of extension agents and increasing their outreach to farmers will improve the dissemination and adoption of agricultural innovations.
2) Improve Access to Credit: Providing timely and affordable credit to smallholder farmers can alleviate financial constraints, enabling them to adopt improved technologies.
3) Invest in Infrastructure: Developing roads, markets, and cooperatives will reduce logistical challenges and improve access to agricultural inputs and markets.
4) Promote Training and Awareness: Organizing training sessions on improved rice production techniques will empower farmers to utilize these technologies effectively.
5) Encourage the Use of Technology: Expanding access to mobile phones and other communication tools will facilitate information sharing and market linkages.
Abbreviations
ATT | Average Treatment Effect on the Treated |
ATU | Average Treatment Effect on the Untreated |
CIA | Conditional Independence Assumption |
EG | Ethiopian Government |
EIAR | Ethiopia Institute of Agriculture Research |
ESR | Endogenous Switching Regression |
FTC | Farmer Training Center |
KG | Kilo Gram |
KM | Kilo Meter |
MoA | Ministry of Agriculture |
PSM | Propensity Score Matching |
TLU | Tropical Livestock Unit |
Author Contributions
Welay Tesfay is the sole author. The author read and approved the final manuscript.
Conflicts of Interest
The authors declare no conflicts of interest.
References
| [1] |
Godfray, H. C. J., Beddington, J. R., Crute, I. R., Haddad, L., Lawrence, D., Muir, J. F., Pretty, J., Robinson, S., Thomas, S. M., Toulmin, C, "Food Security: The Challenge of feeding 9 Billion People," Science, pp. 812-818, 2010.
|
| [2] |
FAOSTAT, "The state of food security in the World," Food and Agriculture Organization of the Rome, 2020.
|
| [3] |
ESS, "AREA AND PRODUCTION OF MAJOR CROPS PRIVATE PEASANT HOLDINGS, MEHER SEASON," Ethiopia Statistical Service, Addis Ababa, 2020.
|
| [4] |
J. Moti, K. Menale and M. Paswel, "Impact of Improved Maize Variety Adoption on Household Food Security in Ethiopia," International Association of Agricultural Economists, pp. 1-26, 2015.
|
| [5] |
Getaye Gizaw, Muhdin Muhamedhussen, Sisay Tolla, "TECHNOLOGICAL ADOPTION AND ITS IMPACT ON RICE PRODUCTION: CASE STUDIES OF FOGERA WEREDA–SOUTH GONDAR ZONE, AMHARA NATIONAL REGIONAL STATE, ETHIOPIA," Jimma University, pp. 1-90, 2017.
|
| [6] |
W. Cochran, Sampling techniques. John Wiley & Sons, 2007.
|
| [7] |
Abdulkarim Ahmed Mumed, Abdi Hassen Habib, "Adoption of Improved Sorghum Variety (Melkam) and Its Impact on Household Food Security in Babile District, Eastern Ethiopia," Journal of Advances in Humanities Research, pp. 13-28, 2023.
|
| [8] |
Walelgn Yalew, Sisay Yehuala, Tigist Petros, "Determinants of the Adoption of Improved Sorghum and Sesame Seeds; the Case of West Gondar Zone, Ethiopia," International Journal of Energy and Environmental Science, pp. 82-89, 2020.
|
| [9] |
Abebaw Assaye, Endeshaw Habte, and Seiichi Sakurai, "Adoption of improved rice technologies in major rice producing areas of Ethiopia: a multivariate probit approach," Agriculture & Food Security, pp. 1-19, 2023.
|
| [10] |
Welay Tesfay, Belete Woundiferaw, "Impact of Improved Rice Variety Adoption on Smallholder Farmers Rice Productivity and Gross Farm Income Enhancement in North Western Ethiopia," International Journal of Agricultural Economics, pp. 110-119, 2024.
|
| [11] |
Abel Kwaku K. Bruce, Samuel A. Donkoh* and Michael Ayamga, "Improved rice variety adoption and its effects on farmers’ output in Ghana," Journal of Development and Agricultural Economics, pp. 342-348, 2014.
|
| [12] |
Bobah Brillant Sisang, Jong In Lee, "Impact of Improved Variety Adoption on Rice Productivity and Farmers’ Income in Cameroon: Application of Propensity Score Matching and Endogenous Switching Regression," Journal of Agricultural, Life and Environmental Sciences, pp. 26-46, 2023.
|
| [13] |
Md. Shahin Mia, Md. Taj Uddin, Humayun Kabir, Md. Abdul Monayem Miah, Md. Abdus Salam, "Adoption Analysis of BADC Produced Boro Rice Seed and Its Impact on Farm Household Food Security in Bangladesh," International Journal of Agricultural Economics, pp. 76-88, 2024.
|
| [14] |
Rosenbaum, P. R., & Rubin, D. B., "propensity score in observational studies for causal effects," Bio-metrika, pp. 41-55, 1983.
|
| [15] |
B. T. Anang, "are adopters of improved rice varieties more productive than non-adopters? empirical evidence from northern Ghana," Ghana Journal of Development Studie, pp. 92-107, 2019.
|
| [16] |
Y. Asmelash, "Determinants of adoption of upland rice varieties in Fogera district, South Gondar, Ethiopia," Journal of Agricultural Extension and Rural Development, pp. 332-338, 2014.
|
| [17] |
Omotesho, O. A., Adewumi, Lawal, M., Ayinde, "Analysis of food security among rural households in Kwara State, Nigeria," African Journal of General Agriculture, pp. 1-15, 2006.
|
Cite This Article
-
ACS Style
Tesfay, W. Adoption of Improved Rice Variety and Its Impact on Smallholder Farmers' Food Security in North Western Ethiopia. Int. J. Photochem. Photobiol. 2025, 7(1), 9-18. doi: 10.11648/j.ijpp.20250701.12
 Copy
|
Copy
|
 Download
AMA Style
Tesfay W. Adoption of Improved Rice Variety and Its Impact on Smallholder Farmers' Food Security in North Western Ethiopia. Int J Photochem Photobiol. 2025;7(1):9-18. doi: 10.11648/j.ijpp.20250701.12
Copy
|
Download
-
@article{10.11648/j.ijpp.20250701.12,
  author = {Welay Tesfay},
  title = {Adoption of Improved Rice Variety and Its Impact on Smallholder Farmers' Food Security in North Western Ethiopia
},
  journal = {International Journal of Photochemistry and Photobiology},
  volume = {7},
  number = {1},
  pages = {9-18},
  doi = {10.11648/j.ijpp.20250701.12},
  url = {https://doi.org/10.11648/j.ijpp.20250701.12},
  eprint = {https://article.sciencepublishinggroup.com/pdf/10.11648.j.ijpp.20250701.12},
  abstract = {Food insecurity is the main challenge in Africa, particularly, in Ethiopia. The government of Ethiopia tacked such problems with an agricultural-led Industrialization policy and a strategy of innovation, and dissemination of new agricultural technologies. Rice is among the emphasis of food security crops to improve its genetics, and to be used by smallholder farmers to boost their agricultural productivity and ensure their food security. The research used a simple and systematic sampling technique to take 180 smallholder rice producers to examine the impact of improved rice variety adoption on smallholders' food security in Northwestern Ethiopia. The research used descriptive statistics, the Probit model, and the Propensity Score Matching models. The probit regression identified that Rice farm experience, soil fertility, Access to credit, access to extension service, Mobile phone, and owning more livestock are the factors that positively influence the adoption of improved rice variety and statistical significance at 10%, 5%, 10%, 5%, 1% respectively whereas Distance to cooperatives, distance to main road, and distance to markets are factors that influenced the improved rice variety adoption negatively and statistically significance at 1%, 1%, 1% respectively. The propensity Score Matching Model revealed that the adopters of improved rice variety produced more rice output and consumed more rice output in terms of calorie intake as well as food and non-food consumption. This directly improved the food security status of smallholder Adopters compared to the non-adopters. Therefore, governmental and non-governmental organizations should focus on outreach of improved agricultural technologies to ensure food security at household levels.
},
 year = {2025}
}
Copy
|
Download
-
TY  - JOUR
T1  - Adoption of Improved Rice Variety and Its Impact on Smallholder Farmers' Food Security in North Western Ethiopia

AU  - Welay Tesfay
Y1  - 2025/04/10
PY  - 2025
N1  - https://doi.org/10.11648/j.ijpp.20250701.12
DO  - 10.11648/j.ijpp.20250701.12
T2  - International Journal of Photochemistry and Photobiology
JF  - International Journal of Photochemistry and Photobiology
JO  - International Journal of Photochemistry and Photobiology
SP  - 9
EP  - 18
PB  - Science Publishing Group
SN  - 2640-429X
UR  - https://doi.org/10.11648/j.ijpp.20250701.12
AB  - Food insecurity is the main challenge in Africa, particularly, in Ethiopia. The government of Ethiopia tacked such problems with an agricultural-led Industrialization policy and a strategy of innovation, and dissemination of new agricultural technologies. Rice is among the emphasis of food security crops to improve its genetics, and to be used by smallholder farmers to boost their agricultural productivity and ensure their food security. The research used a simple and systematic sampling technique to take 180 smallholder rice producers to examine the impact of improved rice variety adoption on smallholders' food security in Northwestern Ethiopia. The research used descriptive statistics, the Probit model, and the Propensity Score Matching models. The probit regression identified that Rice farm experience, soil fertility, Access to credit, access to extension service, Mobile phone, and owning more livestock are the factors that positively influence the adoption of improved rice variety and statistical significance at 10%, 5%, 10%, 5%, 1% respectively whereas Distance to cooperatives, distance to main road, and distance to markets are factors that influenced the improved rice variety adoption negatively and statistically significance at 1%, 1%, 1% respectively. The propensity Score Matching Model revealed that the adopters of improved rice variety produced more rice output and consumed more rice output in terms of calorie intake as well as food and non-food consumption. This directly improved the food security status of smallholder Adopters compared to the non-adopters. Therefore, governmental and non-governmental organizations should focus on outreach of improved agricultural technologies to ensure food security at household levels.

VL  - 7
IS  - 1
ER  -
Copy
|
Download