This study examined the feeding ecology and distribution patterns of Common eland (Tragelaphus oryx) in the Ngorongoro Conservation Area (NCA). Study conducted early in the morning (0600-1130 HRS) and late evening (1700-1830 HRS) in both wet (April) and dry (September) seasons, in 2020 and 2021, using field observations along pre-established plots for feeding ecology, transects for distribution patterns of the common eland crossed diverse representation of vegetation types. The eland's diet varied significantly between plant species grazed often grazing on Chloris pycnothrix and Themeda triandra, but rarely browsing on Hibiscus aponeurus and Vachellia tortilis. Eland distribution patterns were computed and mapped using ArcGIS Software, while diet composition was demonstrated using Generalised Linear Model (GLM) in R statistical software. The results illustrate that 92 % of elands were mostly chosen grassland, 2% preferred shrubland, 4.8% preferred woodland, and 0.7% used the forest. The distribution patterns of eland in different vegetation did not vary significantly with the season and vegetation types, as there was no ecological association between season and vegetation types. The study provides recommendations for vegetation management in favour of the feeding ecology of common eland because they cluster into all vegetation types, whereas grassland influences the feeding of eland. The few remaining vegetation types were browsed but also used as tree cover, a security advantage, and an ability to reduce exposure to predators.
This is an Open Access article, distributed under the terms of the Creative Commons Attribution 4.0 International License (http://creativecommons.org/licenses/by/4.0/), which permits unrestricted use, distribution and reproduction in any medium or format, provided the original work is properly cited.
Ngorongoro, Common Eland, Feeding Ecology, Distribution Patterns, and Protected Area Conservation
1. Introduction
The common eland (Tragelaphus oryx), is an essential wildlife resource in NCA due to its ecological benefits, such as serving as prey species for large predators, including lion (Panthera leo), spotted hyena (Crocuta crocuta), African wild dog (Lycaon pictus) and leopard (P. pardus).
[3]
Decher J 1999 The Kingdon Field Guide to African Mammals. J Mammal 80 (2): 692.
[3]
. The common eland inhabits heterogeneous habitats such as Grassland, Woodland, Shrubs, and Forest. It was demonstrated that common elands are less selective of habitats and diet, as the animals need a large home range to obtain sufficient forage and habitat preferences
[4]
Estes RD 2012 The behavior guide to African mammals: including hoofed mammals, carnivores, and primates. Univ of California Press.
. The common eland (Tragelaphus oryx), formerly Taurotragus oryx, is among the rare African antelopes, including sable antelope (Hippotragus niger), tsessebe (Damaliscus lunatus), roan antelope (Hippotragus equinus), fringed-eared oryx (Oryx beisa callotis), gerenuk (Litocranius walleri) and lesser kudu (Tragelaphus imberbis)
[7]
IUCN 2012 IUCN Antelope Specialist Group. 30 (1).
[7]
. It is the second largest African antelope after the giant eland (Tragelaphus derbianus)
[10]
Hillman J 1988 Home range and movement of the common eland (Taurotragus oryx Pallas 1766) in Kenya. Afr J Ecol 26 (2): 135-148.
, and inhabits heterogeneous habitats that contain more shrubs and is frequently seen in grassland, woodland, and sub-desert bush habitats
[8]
IUCN 2008 The World Conservation Union (IUCN) Species Survival Commission.
[8]
.
Although the International Union for Conservation of Nature (IUCN) has categorized the species as “Least Concern” (LC), like other ungulates in the Ngorongoro Conservation Area (NCA). Needs close management and monitoring of their feeding ecology and distribution patterns, understanding the overhead ecological resources is vital for their existence in the NCA
[15]
Runyoro VA, Hofer H, Chausi EB, and Moehlman PD 1995 Long-term trends in the herbivore populations of the Ngorongoro Crater, Tanzania. Serengeti II: Dynamics, management, and conservation of an ecosystem 2: 146.
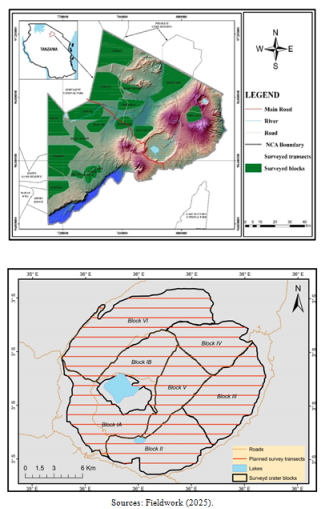
Figure 1. Surveyed Blocks in the Ngorongoro Conservation Area and its Crater.
Scanty information on feeding ecology and distribution patterns in NCA is available. Therefore, this study intended to examine the feeding ecology and distribution patterns of the common eland, which builds significant baseline data to effectively manage habitats in the face of conservation and contribute to the general body of knowledge, which is critical for conservation and management of the species-specific and the ecosystem at large.
2.2. Data Collection
2.2.1. Feeding Ecology of the Common Eland
Elands were searched twice a day, early in the morning (0600 - 1130 HRS) and late evening (1700 - 1800 HRS suitable time for common eland feeding
[9]
Fuhlendorf SD, & Engle DM. (2001). Restoring heterogeneity on rangelands: Ecosystem management based on evolutionary grazing patterns. BioScience, 51(8), 625-632.
. Whenever Eland groups were encountered feeding a plot of 1 hectare (100 m width x 100 m length) was established
[1]
Bukombe J, Senzota RB, Fryxell JM, Kittle A, Kija H, Hopcraft JGC, Mduma S, and Sinclair ARE 2016 Do animal size, seasons, and vegetation type influence detection probability and density estimates of Serengeti ungulates? Afr J Ecol 54 (1): 29-38.
, within a 1-hectare quadrat, four subplots of 1 m2 were established at each corner, subsequently; at the center of 1 hectare a 50 m width x 50 m length was established where four sub-plots each 1 m2 were placed at each corner which makes a total of eight 8 plots. In locating the feeding point, signs of visual marks of fresh tufted grasses with bites and fresh hoof prints of eland were used
[11]
Magome H, Cain III JW, Owen-Smith N and Henley SR 2008 Forage selection of sable antelope in Pilanesberg game reserve, South Africa. South African Journal of Wildlife Research-24-month delayed open access 38 (1): 35-41.
. Remnants of the grazed plants within the plot were identified at the species level. At each sampling point, parameters such as vegetation type, time, GPS coordinates, and foraged plant species were noted, and samples of unidentified specimens were collected for further identification using the Flora of Tropical East Africa plant identification book
[5]
Faden R and Beentje HJ 2012 Flora of tropical East Africa.
[5]
,
2.2.2. Distribution Patterns of the Common Eland
The habitats in the Ngorongoro Conservation Area were classified into numerous vegetation types, such as grassland, shrubs, woodland, wooded grassland, forest, and wetland
[18]
Pratt DM and Anderson VH 1985 Giraffe social behavior. J Nat Hist 19 (4): 771-781.
. Ecological data such as GPS coordinates, eland numbers, Date, time, and vegetation type were recorded once a group of Eland was sighted in NCA. The information was later recorded and overlaid into ArcGIS Software Version 10.3 to display eland habitats in heterogeneous vegetation
[13]
Reed DN, Anderson TM, Dempewolf J, Metzger K and Serneels S 2009 The spatial distribution of vegetation types in the Serengeti ecosystem: the influence of rainfall and topographic relief on vegetation patch characteristics. J Biogeogr 36 (4): 770-782.
A Generalized Linear Model (GLM) was fitted whereby the number of elands recorded was used as a response variable while plant species on which the animal was observed feeding were used as explanatory variables. The model was checked for over-dispersion by using the dispersion test function from the AER Package
[23]
Zeileis A, Kleiber C and Jackman S 2008 Regression models for count data in R. J Stat Softw 27 (8): 1-25.
. The variable was considered significant if the p-value was less than 0.05.
2.3.2. Distribution Patterns of Common Eland
The ArcGIS Software was used to map the habitats and quantify autocorrelation between different heterogeneous habitats and vegetation utilized by the eland. data from field surveys were collected and converted into a vector format. Datasets included, GPS coordinates (eastings and northings), vegetation type (grassland, woodland, shrubland, forest), and eland numbers were recorded in an Excel spreadsheet and overlaid into ArcGIS Version 10.3. Moreover, the R Software Version 4.1.1 for statistical analysis was used to illustrate seasonal eland habitat usage in heterogeneous vegetation at a 5% level of significance.
2.4. Research Findings
2.4.1. Feeding Ecology of the Common Eland
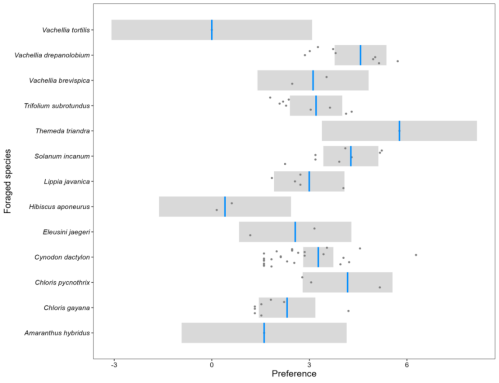
The feeding composition for common eland found thirteen plant species with six browsed including Vachelia tortilis, Vachelia drepanolobium, Vachelia brevispica, Solanumincanum, Lippia javanica, Hibiscus aponeurus and seven grazed species Themeda triandra, Trifolium subterraneum, Eleusine jaegeri, Cynodon dactylon, Chloris pycnothrix, Chloris gayana, and Amaranthus hybridus. The findings illustrate that most of the species were preferred with percentage preference ranging from 15-60% reflected by eleven plant species. Figure 2 indicates that only two plant species, Vachelia tortilis, and Hibiscus aponerus showed negative preference. The level of preference for most grazed species influenced the distribution pattern in line with the feeding ecology of the common eland in NCA. The results of the Poisson model showed significant over-dispersion (z = 2.262, P = 0.012). The model showed that the eland diet varied significantly between plant species (χ2 = 43.811, df = 14, P < 0.001). Field observations indicated that eland was feeding frequently on Themeda triandra, Chloris pycnothrix and Vachellia drepanolobium followed by Chloris gayana, Cynodon dactylon, Solanum incanum and Vachellia brevispica (all skewed towards positive preference), but rarely on Vachellia tortilis and Hibiscus aponeurus (both skewed towards negative preference (Figure 2).
2.4.2. Distribution Patterns of the Common Eland
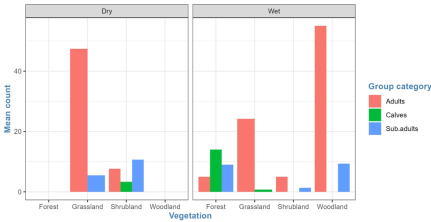
Distribution patterns of the common eland were compared by age groups to see which age group preferred which habitat in which season. The mean abundance of the common eland for adults, calves, and subadults is spread across all habitats in the wet season, with varying mean numbers of individuals per age group. The findings indicate that the forest habitat in the wet season recorded all the age groups, with calves registering a high mean, followed by subadults. The grassland had more adults with very few calves, while shrubland and woodland had only adults and subadults. In contrast to the wet season. The findings that the common eland utilized mostly the grassland other than shrubs, forest, and woodland habitats is ascribed to resource utilization, diet preference, and security advantage-ability to see their predators, The wet season results show that adult common eland and subadults utilize mostly the grassland as they feed on fresh grasses, and grazing becomes a more dominant feeding habit allowing them to spend more time in the grassland. Contrary to adults and subadults, juvenile eland spent more time in the forest to enhance hiding and reduce exposure to predators.
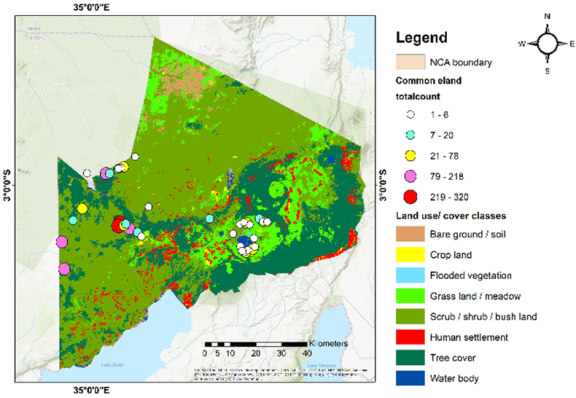
Figure 3. Eland Distribution Patterns in Heterogeneous Vegetation in NCA.
Common Eland distribution patterns in the Heterogeneous Vegetations.
The average number of the common eland inhabited across different habitats for both wet and dry seasons shows that the distribution of individuals was statistically significant (F=4.235, P=0.0302). Furthermore, in the wet season, the mean difference in eland located across all vegetation types was significant (F=3.499, P=0.0185). (Table 1)
Table 1. Common Eland distribution patterns in the Heterogeneous Vegetations.
. As previously shown, elands fed frequently on grasses but rarely on browse. The disproportionate availability of vegetation in the Serengeti ecosystem, which is more plains than other habitats, favors the common eland in response to food availability
[2]
D’Ammando G, Caro T, Oelze VM, Phillips S, Sime P, Stewart FA, and Piel AK 2022 Ecological Drivers of Habitat Use by Meso Mammals in a Miombo Ecosystem in the Issa Valley, Tanzania. Front Ecol Evol 10: 197.
IUCN 2008 The World Conservation Union (IUCN) Species Survival Commission.
[21]
Wallington BP, McKechnie AE, Owen-Smith N and Woodborne S 2007 Stable carbon isotope analysis of eland (Taurotragus oryx) diet in the Suikerbosrand Nature Reserve. South African Journal of Wildlife Research-24-month delayed open access 37 (2): 127-131.
, the study explained that the common eland mostly utilized habitats where there were abundant grasses in response to diet availability, as naturally, they are water-independent and capable of surviving for a considerable period without free water; water is obtained from their diet
[4]
Estes RD 2012 The behavior guide to African mammals: including hoofed mammals, carnivores, and primates. Univ of California Press.
. The similarity of the feeding ecology of the common eland in NCA with other study areas confirms the feeding ecology of the common eland. It explains the influence of diet on habitat use and distribution patterns in NCA.
The common eland inhabits heterogeneous habitats, as demonstrated by the results of this study. The finding that the common eland utilized mostly grassland, other than shrubs, forest, and woodland habitats, is ascribed to resource utilization, diet preference, and a security advantage to see their predators. The common eland, being a mixed feeder, can inhabit heterogeneous habitats based on the abundance of dietary items at a particular season of the year. These findings are similar to those of
[20]
Wronski T 2002 Feeding ecology and foraging behavior of impala Aepyceros melampus in Lake Mburo National Park, Uganda. Afr J Ecol 40 (3): 205-211.
, who found that the extent of grasses for grazers in East Africa influences the preference of grassland for the common eland. The wet season results show that adult common eland and subadults utilize mostly the grassland as they feed on fresh grasses, and grazing becomes a more dominant feeding habit, allowing them to spend more time in the grassland. Contrary to adults and subadults, juvenile eland spent more time in the forest to enhance hiding and reduce exposure to predators.
In the dry season, the common eland became less selective of habitats and diet, as the animals need a large home range to obtain sufficient forage. This suggests that eland habitat use was influenced by the availability of food resources
[4]
Estes RD 2012 The behavior guide to African mammals: including hoofed mammals, carnivores, and primates. Univ of California Press.
. These findings support studies on habitat heterogeneity as a driver of ungulate diversity and distribution patterns where Hluhluwe-iMfolozi Park, South Africa is a good example
[14]
Redfern J V, Grant R, Biggs H, and Getz WM 2003 Surface‐water constraints on herbivore foraging in the Kruger National Park, South Africa. Ecology 84 (8): 2092-2107.
Bukombe J, Senzota RB, Fryxell JM, Kittle A, Kija H, Hopcraft JGC, Mduma S, and Sinclair ARE 2016 Do animal size, seasons, and vegetation type influence detection probability and density estimates of Serengeti ungulates? Afr J Ecol 54 (1): 29-38.
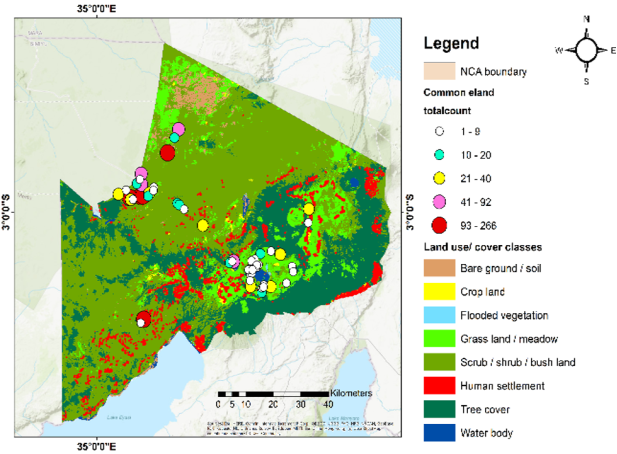
, in the Serengeti National Park, (SNP) showed that the availability of forage mostly influences resource use by ungulates. Additionally, the findings showed that in areas with human settlements for both seasons wet and dry, there was no common eland sighted this is probably because of the existence of human settlement and human development, these results agreed with that of
[10]
Hillman J 1988 Home range and movement of the common eland (Taurotragus oryx Pallas 1766) in Kenya. Afr J Ecol 26 (2): 135-148.
, who revealed that conservation pressures such as habitat loss and fragmentation are the major key factors for the decline of common eland elsewhere which exacerbated by human development.
4. Conclusion and Recommendation
4.1. Conclusion
The study on the feeding ecology and distribution patterns of the Common eland (Tragelaphus oryx) in the Ngorongoro Conservation Area provides critical insights into their dietary preferences and habitat utilization. The results indicate that the Common eland primarily feeds on grasses such as Themeda triandra and Chloris pycnothrix, while also occasionally browsing on certain shrubs and trees like Vachellia drepanolobium. The distribution patterns suggest a strong grassland preference, with limited use of shrubland, woodland, and forested areas. Seasonal variations did not significantly affect habitat selection, although juveniles were more likely to be found in forested areas for protection. The study underscores the importance of grassland habitats for the sustenance of the Common eland population, as they provide both food and security from predators.
4.2. Recommendations
Habitat Management and Monitoring through the use of satellite GPS collars for tracking movement patterns would provide more precise data on eland distribution patterns, permitting improved conservation plans.
Further study focusing on the impacts of climate change is recommended to enhance long-term conservation strategies.
Victoria Shayo: Data curation, Formal Analysis, Funding acquisition, Methodology, Project administration, Resources, Supervision, Validation, Visualization, Writing – original draft, Writing – review & editing
Peter Nyanswi: Conceptualization, Data curation, Formal Analysis, Funding acquisition, Investigation, Methodology, Software, Visualization, Writing – original draft, Writing – review & editing
Acknowledgments
We thank the Ngorongoro Conservation Area Authority for financial and logistical support in accomplishing this work. We also thank the research assistants for their commitment during data collection. Lastly, we thank the drivers, Nsajigwa Mwaisemba and Ibrahim Mtaki, for their full commitment to participating throughout the study.
Conflicts of Interest
The authors declare no conflicts of interest.
References
[1]
Bukombe J, Senzota RB, Fryxell JM, Kittle A, Kija H, Hopcraft JGC, Mduma S, and Sinclair ARE 2016 Do animal size, seasons, and vegetation type influence detection probability and density estimates of Serengeti ungulates? Afr J Ecol 54 (1): 29-38.
D’Ammando G, Caro T, Oelze VM, Phillips S, Sime P, Stewart FA, and Piel AK 2022 Ecological Drivers of Habitat Use by Meso Mammals in a Miombo Ecosystem in the Issa Valley, Tanzania. Front Ecol Evol 10: 197.
Magome H, Cain III JW, Owen-Smith N and Henley SR 2008 Forage selection of sable antelope in Pilanesberg game reserve, South Africa. South African Journal of Wildlife Research-24-month delayed open access 38 (1): 35-41.
Reed DN, Anderson TM, Dempewolf J, Metzger K and Serneels S 2009 The spatial distribution of vegetation types in the Serengeti ecosystem: the influence of rainfall and topographic relief on vegetation patch characteristics. J Biogeogr 36 (4): 770-782.
Redfern J V, Grant R, Biggs H, and Getz WM 2003 Surface‐water constraints on herbivore foraging in the Kruger National Park, South Africa. Ecology 84 (8): 2092-2107.
Runyoro VA, Hofer H, Chausi EB, and Moehlman PD 1995 Long-term trends in the herbivore populations of the Ngorongoro Crater, Tanzania. Serengeti II: Dynamics, management, and conservation of an ecosystem 2: 146.
Wallington BP, McKechnie AE, Owen-Smith N and Woodborne S 2007 Stable carbon isotope analysis of eland (Taurotragus oryx) diet in the Suikerbosrand Nature Reserve. South African Journal of Wildlife Research-24-month delayed open access 37 (2): 127-131.
Mtega, G., Shayo, V., Nyanswi, P. (2025). Feeding Ecology and Distribution Patterns of the Common Eland (Tragelaphus Oryx) in the Ngorongoro Conservation Area, Northern Tanzania. International Journal of Natural Resource Ecology and Management, 10(3), 179-186. https://doi.org/10.11648/j.ijnrem.20251003.13
Mtega, G.; Shayo, V.; Nyanswi, P. Feeding Ecology and Distribution Patterns of the Common Eland (Tragelaphus Oryx) in the Ngorongoro Conservation Area, Northern Tanzania. Int. J. Nat. Resour. Ecol. Manag.2025, 10(3), 179-186. doi: 10.11648/j.ijnrem.20251003.13
Mtega G, Shayo V, Nyanswi P. Feeding Ecology and Distribution Patterns of the Common Eland (Tragelaphus Oryx) in the Ngorongoro Conservation Area, Northern Tanzania. Int J Nat Resour Ecol Manag. 2025;10(3):179-186. doi: 10.11648/j.ijnrem.20251003.13
@article{10.11648/j.ijnrem.20251003.13,
  author = {Gregory Mtega and Victoria Shayo and Peter Nyanswi},
  title = {Feeding Ecology and Distribution Patterns of the Common Eland (Tragelaphus Oryx) in the Ngorongoro Conservation Area, Northern Tanzania
},
  journal = {International Journal of Natural Resource Ecology and Management},
  volume = {10},
  number = {3},
  pages = {179-186},
  doi = {10.11648/j.ijnrem.20251003.13},
  url = {https://doi.org/10.11648/j.ijnrem.20251003.13},
  eprint = {https://article.sciencepublishinggroup.com/pdf/10.11648.j.ijnrem.20251003.13},
  abstract = {This study examined the feeding ecology and distribution patterns of Common eland (Tragelaphus oryx) in the Ngorongoro Conservation Area (NCA). Study conducted early in the morning (0600-1130 HRS) and late evening (1700-1830 HRS) in both wet (April) and dry (September) seasons, in 2020 and 2021, using field observations along pre-established plots for feeding ecology, transects for distribution patterns of the common eland crossed diverse representation of vegetation types. The eland's diet varied significantly between plant species grazed often grazing on Chloris pycnothrix and Themeda triandra, but rarely browsing on Hibiscus aponeurus and Vachellia tortilis. Eland distribution patterns were computed and mapped using ArcGIS Software, while diet composition was demonstrated using Generalised Linear Model (GLM) in R statistical software. The results illustrate that 92 % of elands were mostly chosen grassland, 2% preferred shrubland, 4.8% preferred woodland, and 0.7% used the forest. The distribution patterns of eland in different vegetation did not vary significantly with the season and vegetation types, as there was no ecological association between season and vegetation types. The study provides recommendations for vegetation management in favour of the feeding ecology of common eland because they cluster into all vegetation types, whereas grassland influences the feeding of eland. The few remaining vegetation types were browsed but also used as tree cover, a security advantage, and an ability to reduce exposure to predators.},
 year = {2025}
}
TY  - JOUR
T1  - Feeding Ecology and Distribution Patterns of the Common Eland (Tragelaphus Oryx) in the Ngorongoro Conservation Area, Northern Tanzania

AU  - Gregory Mtega
AU  - Victoria Shayo
AU  - Peter Nyanswi
Y1  - 2025/08/08
PY  - 2025
N1  - https://doi.org/10.11648/j.ijnrem.20251003.13
DO  - 10.11648/j.ijnrem.20251003.13
T2  - International Journal of Natural Resource Ecology and Management
JF  - International Journal of Natural Resource Ecology and Management
JO  - International Journal of Natural Resource Ecology and Management
SP  - 179
EP  - 186
PB  - Science Publishing Group
SN  - 2575-3061
UR  - https://doi.org/10.11648/j.ijnrem.20251003.13
AB  - This study examined the feeding ecology and distribution patterns of Common eland (Tragelaphus oryx) in the Ngorongoro Conservation Area (NCA). Study conducted early in the morning (0600-1130 HRS) and late evening (1700-1830 HRS) in both wet (April) and dry (September) seasons, in 2020 and 2021, using field observations along pre-established plots for feeding ecology, transects for distribution patterns of the common eland crossed diverse representation of vegetation types. The eland's diet varied significantly between plant species grazed often grazing on Chloris pycnothrix and Themeda triandra, but rarely browsing on Hibiscus aponeurus and Vachellia tortilis. Eland distribution patterns were computed and mapped using ArcGIS Software, while diet composition was demonstrated using Generalised Linear Model (GLM) in R statistical software. The results illustrate that 92 % of elands were mostly chosen grassland, 2% preferred shrubland, 4.8% preferred woodland, and 0.7% used the forest. The distribution patterns of eland in different vegetation did not vary significantly with the season and vegetation types, as there was no ecological association between season and vegetation types. The study provides recommendations for vegetation management in favour of the feeding ecology of common eland because they cluster into all vegetation types, whereas grassland influences the feeding of eland. The few remaining vegetation types were browsed but also used as tree cover, a security advantage, and an ability to reduce exposure to predators.
VL  - 10
IS  - 3
ER  -