2. Materials and Methods
2.1. Materials
Fresh unripe bananas (Musa sapientum) at stage 2 of ripeness were purchased from agricultural markets in Ngaoundere (Cameroon). All the chemicals and media were of analytical reagent grade and were procured from Sinopharm Chemical Reagent, China and Sigma-Aldrich, Germany.
2.2. Preparation of Unripe Banana Flour
Banana fruits were hand-peeled, sliced to approximately 3 mm thickness, and blanched at 90 °C for 2 min to inactivate endogenous enzymes. Afterwards, gelatinization was carried out by boiling the unripe banana at 100 °C for 15 min. The gelatinized bananas were subsequently dried in a forced-air oven at 60 °C for 20 h until constant weight was achieved (8% moisture, wet basis). The dried gelatinized bananas slices were milled using a laboratory hammer mill and sieved to pass through an 80-mesh screen (≤180 µm). The resulting flours were sterilized by autoclaving for 20 min at 121°C and 15 psi. Furthermore, the flours were packed in airtight polyethylene bags and stored at room temperature until further used.
2.3. Microorganisms and Inoculum Preparation
The lactic acid bacteria utilized in this research were
Lactiplantibacillus plantarum,
Lactobacillus acidophilus, Lacticaseibacillus casei, Limosilactobacillus fermentum, and
Levilactobacillus brevis. The LABs were purchased from Dynisco Company (Kunshan, China). The strains were activated prior to being used according to the method described by Kwaw, Ma
| [10] | Kwaw, E., et al., Effect of Lactobacillus strains on phenolic profile, color attributes and antioxidant activities of lactic-acid-fermented mulberry juice. Food Chemistry, 2018. 250: p. 148-154.
https://doi.org/10.1016/j.foodchem.2018.01.009 |
[10]
, with slight modifications. In brief, 0.01 g of the culture was added to 200 ml of DeMan, Rogosa and Sharpe (MRS) broth and reactivated at 37°C for 18 h. Afterwards, the strains were subcultured twice in MRS broth at 37°C for 24 h. Each culture was centrifuged (Anke KA – 1000) at 3500 rpm for 10 min at 4°C. Microbial cells were collected, washed with 0.1% sterile NaCl. The cell concentration (10
8 cfu/ml) was determined using hemocytometer version XB-K-250 (Jianling Medical Device Co., Danyang, China).
2.4. Lactic Acid Bacteria Fermentation of Unripe Banana Flour
The LAB fermentation was performed according to Wan, Huang
| [11] | Wan, J., et al., Effects of LAB Fermentation on Physical Properties of Oat Flour and Its Suitability for Noodle Making. Cereal Chemistry, 2011. 88(2): p. 153-158.
https://doi.org/10.1094/CCHEM-12-09-0160 |
[11]
, with slight modification. Briefly, UBF (300 g) and starter culture (50 ml) were mixed (KitchenAid, St. Joseph, MI) using the speed 3 setting for 5 min. Sterilized water (550 mL) was slowly added at speed 3 and mixed well at speed 6 for 7 min. The batter was poured into a round container and fermented at 30°C for 4, 8, 12, 16, and 20 hr. At the end of fermentation, microbial activity was stopped by heating the slurry to 85°C for 10 min. Samples were neutralized to pH 7.0 using 1 M NaOH, oven-dried at 60°C for 20 h. Afterwards, ground and sieved to pass through a 150-mesh screen (≤100 µm), then stored at 4°C until use.
2.5. Proximate Analysis
Proximate composition of UBF was carried out by using standard methods. Titratable acidity (TA), pH, Moisture, carbohydrate, fat, dietary fiber, protein and ash content were estimated according to AACC
| [12] | AACC, A. A. o. C. C. A. M. C., Approved methods of the American association of cereal chemists. Vol. 1. 2000: American Association of Cereal Chemists. |
[12]
. Micro-Kjeldahl method was used to determine the nitrogen content of the sample. Calculation of total protein was obtained by multiplying the conversion factor of 6.25.
2.6. Starch Analysis
2.6.1. Resistant Starch
The RS content was determined according to Kongolo, Da Silva
| [13] | Kongolo, J. I., et al., Pasting, thermal, gel texture, resistant starch and colour properties of unripe banana flour from 10 desert banana varieties cultivated in South Africa. Journal of Food Measurement and Characterization, 2017. 11(3): p. 1056-1064. https://doi.org/10.1007/s11694-017-9481-x |
[13]
, by means of a resistant starch assay kit (Megazyme kit). UBF were incubated in a shaking water bath with two enzymes, amyloglucosidase and pancreatic α-amylase at 37°C for 16 h in order to achieve complete hydrolysis of the non-resistant starch. After centrifugation, the pellet was washed with ethanol (50% v/v) and the supernatant was decanted. The RS in the pellet was dissolved in 2 M KOH by vigorously stirring in an ice-water bath for 20 min. The starch was quantitatively hydrolyzed to glucose with amyloglucosidase and then the glucose determined using a glucose oxidase/peroxidase reagent, and RS was calculated as mg of glucose conversion factor of 0.9.
2.6.2. Total Starch
The total starch (TS) content was assessed according to Kongolo, Da Silva
| [13] | Kongolo, J. I., et al., Pasting, thermal, gel texture, resistant starch and colour properties of unripe banana flour from 10 desert banana varieties cultivated in South Africa. Journal of Food Measurement and Characterization, 2017. 11(3): p. 1056-1064. https://doi.org/10.1007/s11694-017-9481-x |
[13]
, Khoozani, Bekhit
| [14] | Khoozani, A. A., A. E.-D. A. Bekhit, and J. Birch, Effects of different drying conditions on the starch content, thermal properties and some of the physicochemical parameters of whole green banana flour. International Journal of Biological Macromolecules, 2019. 130: p. 938-946.
https://doi.org/10.1016/j.ijbiomac.2019.03.010 |
[14]
by means of a kit starch assay kit (Megazyme kit). The principle of the method involves the hydrolysis of starch using a thermostable α-amylase into soluble branched and unbranched maltodextrins, allowing quantification of TS.
2.6.3. Amylose and Amylopectin
The amylose content was assessed according to the method of Khoozani, Bekhit
| [14] | Khoozani, A. A., A. E.-D. A. Bekhit, and J. Birch, Effects of different drying conditions on the starch content, thermal properties and some of the physicochemical parameters of whole green banana flour. International Journal of Biological Macromolecules, 2019. 130: p. 938-946.
https://doi.org/10.1016/j.ijbiomac.2019.03.010 |
[14]
using an amylose/amylopectin kit (Megazyme kit). The method is based on the selective precipitation of amylopectin by concanavalin-A, followed by its removal through centrifugation, allowing quantification of the amylose and amylopectin fractions.
2.7. Functional Analysis
2.7.1. Water Absorption Index and Water Solubility Index
The water absorption index (WAI) and water solubility index (WSI) were determined using the centrifugation method adapted from Sharma, Singh
| [15] | Sharma, C., et al., Investigation of process and product parameters for physicochemical properties of rice and mung bean (Vigna radiata) flour based extruded snacks. Journal of food science and technology, 2017. 54(6): p. 1711-1720.
https://doi.org/10.1007/s13197-017-2606-8 |
[15]
. Briefly, 2.5 g of UBF was dispersed in 30 ml of distilled water and stirred for 30 min at 25°C. The suspension was centrifuged at 3000 g for 10 min, and the supernatant was collected and dried at 105°C to constant weight. The WAI was expressed as grams of sediment per gram of dry sample, while the WSI was calculated as the percentage of soluble solids in the supernatant relative to the sample weight. These indices describe the hydration and molecular dispersion behavior of the starch matrix under aqueous conditions.
2.7.2. Oil Absorption Capacity
The oil absorption capacity (OAC) was evaluated according to Osuna-Gallardo, Cuevas-Rodríguez
| [16] | Osuna-Gallardo, E. I., et al., Impact of Cooking and Extrusion Processing on Nutritional, Antinutritional, and Techno-Functional Characteristics of Indigenous Bean (Phaseolus coccineus). ACS Food Science & Technology, 2023. 3(11): p. 1835-1853. https://doi.org/10.1021/acsfoodscitech.2c00416 |
[16]
. One gram of sample was mixed with 10 ml of refined sunflower oil, vortexed for 1 min, and allowed to stand for 30 min at 25°C. The mixture was centrifuged at 3000 g for 10 min, and unbound oil was decanted. The OAC was expressed as grams of oil retained per gram of dry sample. This property reflects the hydrophobic character and surface affinity of flour constituents, essential for flavor retention and texture development in formulated foods.
2.7.3. Emulsification Capacity and Emulsion Stability
The emulsification capacity (EC) and emulsion stability (ES) were measured according to Bashash, Wang-Pruski
| [17] | Bashash, M., et al., The emulsifying capacity and stability of potato proteins and peptides: A comprehensive review. Comprehensive Reviews in Food Science and Food Safety, 2024. 23(5): p. e70007. https://doi.org/10.1111/1541-4337.70007 |
[17]
, using a homogenization–centrifugation method. One gram of UBF was dispersed in 25 ml of distilled water and homogenized at 10 000 rpm for 1 min. Then, 25 ml of vegetable oil was gradually added and homogenized for another minute. The emulsion was centrifuged at 3000 g for 5 min, and the height of the emulsified layer was measured. The EC was calculated as the percentage of the emulsified layer relative to the total mixture. The ES was determined after heating the emulsion at 80°C for 30 min, cooling, and re-centrifuging under identical conditions, and expressed as the percentage of the emulsified layer remaining after heating.
2.7.4. Foaming Capacity and Foaming Stability
The foaming properties were determined following the procedure of Ma, Greis
, with minor modifications. Two grams of UBF were dispersed in 100 ml of distilled water and homogenized at 10 000 rpm for 5 min. The resulting dispersion was immediately transferred into a graduated cylinder, and the initial volume (
V₀) and whipped volume (
V₁) were recorded.
The foaming capacity (FC) was calculated according to Eq. (
1):
The foam volume was measured again after 30 min (
V₂), and the foaming stability (FS) was calculated using Eq. (
2):
These indices describe the ability of proteins and other amphiphilic constituents to adsorb at the air–water interface, form cohesive films, and maintain foam structure over time.
2.7.5. Least Gelation Concentration
The least gelation concentration (LGC) was determined according to Jaddu, Pradhan
| [19] | Jaddu, S., R. C. Pradhan, and M. Dwivedi, Effect of multipin atmospheric cold plasma discharge on functional properties of little millet (Panicum miliare) flour. Innovative Food Science & Emerging Technologies, 2022. 77: p. 102957.
https://doi.org/10.1016/j.ifset.2022.102957 |
[19]
. Suspensions containing 2–20% (w/v) of UBF were prepared in 5 ml distilled water, heated in a boiling water bath for 1 h, cooled rapidly, and stored at 4°C for 2 h. The LGC was the lowest concentration at which the gel remained immobile when the tube was inverted at 90°C. LGC reflects the gel-forming potential of starch–protein systems, a critical parameter for designing textures in thermally processed foods.
2.8. Texture and Pasting Properties Analysis
2.8.1. Gel Hardness
Gel hardness was determined by texture profile analysis following Kongolo, Da Silva
| [13] | Kongolo, J. I., et al., Pasting, thermal, gel texture, resistant starch and colour properties of unripe banana flour from 10 desert banana varieties cultivated in South Africa. Journal of Food Measurement and Characterization, 2017. 11(3): p. 1056-1064. https://doi.org/10.1007/s11694-017-9481-x |
[13]
with minor modifications. Briefly, UBF was dispersed at 15% (w/v) in distilled water, heated in a boiling water bath for 30 min with constant stirring to ensure full gelatinization. The hot paste was then poured into cylindrical containers (30 mm height × 25 mm diameter) and sealed. Gels were conditioned at 4°C for 24 h, then equilibrated to 25°C before testing. Measurements were performed on a TA.XT Plus texture analyzer (Stable Micro Systems, Godalming, UK) fitted with a 5 kg load cell and a P/36R cylindrical probe. Samples were compressed to 50% of their original height at 1.0 mm s⁻¹; gel hardness was recorded as the first-cycle peak force (N). This parameter quantifies gel firmness and structure development induced by fermentation.
2.8.2. Pasting Properties
Pasting behavior was evaluated on a Rapid Visco Analyzer (RVA-4800, Perten Instruments, Hägersten, Sweden) following the standard RVA framework
| [13] | Kongolo, J. I., et al., Pasting, thermal, gel texture, resistant starch and colour properties of unripe banana flour from 10 desert banana varieties cultivated in South Africa. Journal of Food Measurement and Characterization, 2017. 11(3): p. 1056-1064. https://doi.org/10.1007/s11694-017-9481-x |
[13]
with a modified temperature profile to match our system. UBF (3.5 g, 14% moisture basis) was dispersed in 25 ml of distilled water. Agitation was 960 rpm for 10 s, then 160 rpm. The temperature program involved holding at 50°C for 1 min, heating from 50 to 95°C at 12°C min⁻¹, holding at 95°C for 2.5 min, cooling from 95 to 50°C at 12°C min⁻¹, and finally loading at 50°C for 2 min. The following parameters were extracted from the pasting curve (Thermocline v4.1) including peak viscosity (cP), trough (cP), breakdown (cP = Peak − Trough), final viscosity (FV, cP), setback (cP = Final − Trough), and pasting temperature (PT,°C), which together describe the viscoelastic and thermal stability of the flour during cooking/cooling.
2.9. Statistical analysis
All measurements were performed in triplicate, and the results were expressed as mean ± standard deviation. Statistical analyses were carried out using OriginPro 2025 (OriginLab Corp., Northampton, MA, USA). A one-way and two-way analysis of variance (ANOVA) were applied to evaluate the effects of treatment conditions and their interactions on the measured parameters. When significant differences were detected (p < 0.05), Tukey’s honestly significant difference (HSD) test was used for multiple mean comparison. In addition, Spearman correlation analysis was performed to assess relationships between measured variables, and principal component analysis (PCA) was conducted to explore the underlying structure and key patterns in the dataset.
3. Results and Discussion
3.1. Proximate Properties
3.1.1. Effect of Lacto-fermentation on pH and Titratable Acidity Content
The acidification dynamics of the fermented UBF were significantly influenced by the main effects of both LAB strain and fermentation time, as well as their statistical interaction (pH:
p < 0.001 for strain, time, and interaction; TA:
p < 0.001 for strain and time,
p < 0.05 for interaction) (
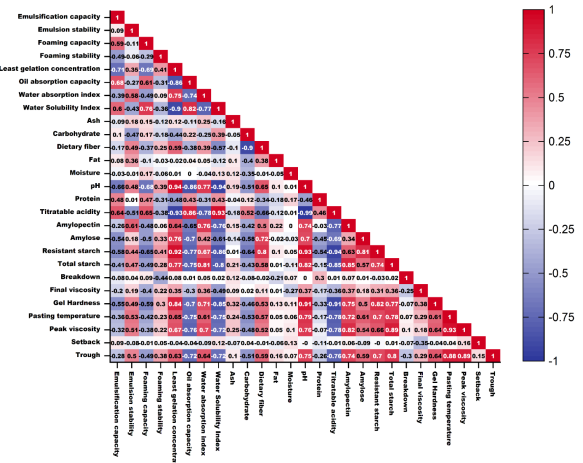
Table 1). The near-perfect negative Spearman correlation (
r = −0.994,
p < 0.05;
Figure 1) between pH and TA quantitatively confirmed that these metrics are complementary measures of the primary metabolic process, namely the progressive accumulation of organic acids generated from carbohydrate catabolism
| [20] | Gänzle, M. G., Lactic metabolism revisited: metabolism of lactic acid bacteria in food fermentations and food spoilage. Current Opinion in Food Science, 2015. 2: p. 106-117.
https://doi.org/10.1016/j.cofs.2015.03.001 |
[20]
. The highly significant time effect shown in
Table 1 indicated the cumulative acid production, whereas the marked strain effect underscored the critical role of the inoculum's intrinsic metabolic characteristics. The facultatively heterofermentative
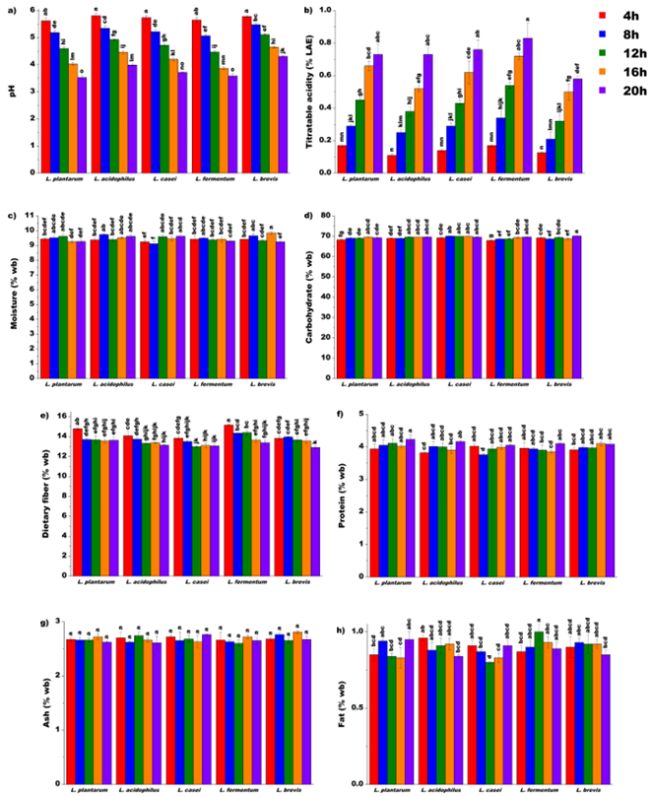
L. fermentum consistently displayed the most aggressive acidification profile (
Figure 2a and b), reaching a pH below 3.9 and the highest TA (0.83%) by 20 h. This rapid kinetic trajectory might be attributed to its efficient conversion of hexoses and robust acid tolerance mechanisms
| [21] | Verce, M., L. De Vuyst, and S. Weckx, Comparative genomics of Lactobacillus fermentum suggests a free-living lifestyle of this lactic acid bacterial species. Food Microbiology, 2020. 89: p. 103448. https://doi.org/10.1016/j.fm.2020.103448 |
[21]
. Conversely, the obligate heterofermenter,
L. brevis, exhibited a significantly (
p < 0.001) slower rate, maintaining a higher pH of 4.31 and lower TA (0.58%) at 20 h (
Figure 2a and b). This behavior arises from its phosphoketolase pathway which yields mixed end-products including ethanol and CO
2, resulting in a lower net TA per mole of hexose utilized compared to predominantly homofermentative pathways
| [20] | Gänzle, M. G., Lactic metabolism revisited: metabolism of lactic acid bacteria in food fermentations and food spoilage. Current Opinion in Food Science, 2015. 2: p. 106-117.
https://doi.org/10.1016/j.cofs.2015.03.001 |
[20]
. The statistically significant strain × time interaction (
Table 1) for both parameters demonstrated that the kinetic trajectory of acidification was non-uniform and uniquely defined by each strain. This variation stems from inter-strain differences in physiological traits, such as proton-translocating F1F0-ATPases, which are essential for maintaining cytoplasmic pH homeostasis and sustaining glycolytic flux under severe acid stress
. This rapid establishment of an acidic environment by vigorous strains is a critical prerequisite for the acid-catalyzed hydrolysis
| [21] | Verce, M., L. De Vuyst, and S. Weckx, Comparative genomics of Lactobacillus fermentum suggests a free-living lifestyle of this lactic acid bacterial species. Food Microbiology, 2020. 89: p. 103448. https://doi.org/10.1016/j.fm.2020.103448 |
[21]
.
3.1.2. Effect of Lacto-fermentation on Moisture Content
The residual moisture content of the fermented UBF was influenced by the extensive biochemical restructuring of the matrix. Significant main effects were observed for strain (
p < 0.05) and time (
p < 0.05) along with highly significant strain × time interaction (
p < 0.001) (
Table 1). The general temporal change in moisture content was related to the cumulative production of organic acids and the action of fermentation associated hydrolases. These enzymes progressively weakened the starch cell wall network and increased porosity, thereby liberating bound water and reducing the matrix's overall water holding capacity, facilitating its removal during drying
| [23] | Yan, X., et al., A review of the effects of fermentation on the structure, properties, and application of cereal starch in foods. Critical Reviews in Food Science and Nutrition, 2025. 65(12): p. 2323-2342. https://doi.org/10.1080/10408398.2024.2334269 |
[23]
. The significant strain effect (
Table 1) demonstrated that the rate of this moisture evolution was inoculum dependent. As illustrated in
Figure 2c, the slower metabolizing strains like
L. brevis retained higher moisture levels (9.85% at 16 h), compared to the lower levels attained by aggressively acidifying and hydrolyzing strains like
L. fermentum and
L. plantarum (9.30% and 9.27% at 20 h, respectively). This divergence may be explained by the transient balance between two competing effects. Acid and enzyme-driven pre-digestion break down water retaining structures, leading moisture loss
| [24] | Hernández-Figueroa, R. H., A. López-Malo, and E. Mani-López, Lactic Acid Bacteria-Derived Exopolysaccharides: Dual Roles as Functional Ingredients and Fermentation Agents in Food Applications. Fermentation, 2025. 11(9): p. 538.
https://doi.org/10.3390/fermentation11090538 |
[24]
. Conversely, some LAB
strains synthesize exopolysaccharides (EPS)
in situ, which are high molar mass hydrocolloids that transiently enhance water holding capacity, and thus slow down moisture loss
| [25] | Liu, W., et al., Lactic Acid Bacteria Exopolysaccharides Unveiling Multifaceted Insights from Structure to Application in Foods and Health Promotion. Foods, 2025. 14(5): p. 823.
https://doi.org/10.3390/foods14050823 |
[25]
. The highly significant strain × time interaction reflected the asynchronous nature of this balance, confirming that the kinetic pattern of moisture loss was strain-specific. As shown in
Figure 2c, divergent responses in the one-way ANOVA test (
L. brevis at 16 h being the wettest, while
L. casei at 8 h being the driest) were uniquely determined by the timing and extent of each strain's metabolic activity and structural degradation profile.
3.1.3. Effect of Lacto-fermentation on Carbohydrate Content
The carbohydrate content was significantly impacted (
Figure 2d) by both strain and time, with a highly significant interaction (
p < 0.001 for all;
Table 1). This alteration was a direct metabolic consequence of LAB utilizing available saccharides as their primary carbon and energy sources, converting them into organic acids, biomass, and other metabolites
| [20] | Gänzle, M. G., Lactic metabolism revisited: metabolism of lactic acid bacteria in food fermentations and food spoilage. Current Opinion in Food Science, 2015. 2: p. 106-117.
https://doi.org/10.1016/j.cofs.2015.03.001 |
[20]
. The statistical relationship between catabolism and acidification was evidenced by the negative Spearman correlation (
Figure 1) between carbohydrate content and pH (
r = −0.509,
p < 0.05), and the positive Spearman correlation with TA (
r = 0.518,
p < 0.05). The magnitude of carbohydrate reduction was defined by strain specific amylolytic capacity and acid tolerance. Strains like
L. plantarum and
L. fermentum possess robust extracellular amylase systems that efficiently hydrolyze the native starch granules into fermentable sugars, sustaining glycolysis and leading to more extensive substrate depletion
| [26] | Mukisa, I. M., et al., Influence of Cofermentation by Amylolytic Lactobacillus plantarum and Lactococcus lactis Strains on the Fermentation Process and Rheology of Sorghum Porridge. Applied and Environmental Microbiology, 2012. 78(15): p. 5220-5228. https://doi.org/10.1128/AEM.00857-12 |
[26]
.
Table 1. Two-factor ANOVA (mean square) for lactic acid bacteria strain and fermentation time effects on proximate, starch, functional, and pasting properties of unripe banana flour.
Source of variation | Strain | Time | Strain × Time | Model |
Proximate properties |
pH | 0.741*** | 8.664*** | 0.040*** | 1.595*** |
Titratable acidity | 0.064*** | 0.839*** | 0.004* | 0.153*** |
Carbohydrate | 1.707*** | 1.930*** | 0.525*** | 0.956*** |
Moisture | 0.050* | 0.046* | 0.112*** | 0.090*** |
Protein | 0.037* | 0.089*** | 0.020* | 0.034*** |
Dietary fiber | 1.745*** | 2.756*** | 0.215*** | 0.894*** |
Fat | 0.007* | 0.001 | 0.008*** | 0.007*** |
Ash | 0.009 | 0.006 | 0.009 | 0.008 |
Starch properties |
Total starch | 0.913*** | 2.460*** | 0.081 | 0.616*** |
Amylopectin | 1.055*** | 1.165*** | 0.026 | 0.387*** |
Amylose | 0.129* | 0.307** | 0.048 | 0.105* |
Resistant starch | 0.078 | 22.179*** | 0.278 | 3.895*** |
Functional properties |
Water solubility index | 1.045** | 6.764*** | 0.255 | 1.472*** |
Water absorption index | 0.059*** | 0.106*** | 0.009*** | 0.033*** |
Least gelation concentration | 0.358** | 4.449*** | 0.068 | 0.846*** |
Oil absorption capacity | 0.046*** | 0.125*** | 0.004 | 0.031*** |
Emulsification capacity | 17.139*** | 16.834*** | 2.173* | 7.111*** |
Emulsion stability | 11.160*** | 7.559* | 2.505 | 4.790** |
Foaming capacity | 2.868 | 12.991*** | 2.196 | 4.108* |
Foaming stability | 0.966 | 5.871 | 1.964 | 2.449* |
Texture and pasting properties |
Pasting temperature | 1.135*** | 1.221*** | 0.020 | 0.406*** |
Peak viscosity | 50036.280*** | 63676.980*** | 1149.405 | 19718.480*** |
Trough | 49753.020*** | 84410.220*** | 807.570 | 22898.920*** |
Breakdown | 2010.900 | 22770.000*** | 1791.900 | 5324.750* |
Final viscosity | 21087.120*** | 77592.720*** | 1864.245 | 17689.470*** |
Setback | 121.620 | 574.020 | 790.920 | 643.220 |
Gel hardness | 0.071* | 0.452*** | 0.022 | 0.102*** |
Asterisks (*, ** and ***) indicate 5%, 0.1% and 0.01% significant levels, respectively
Figure 1. Heatmap (Sperman correlation) of properties of unripe banana flour.
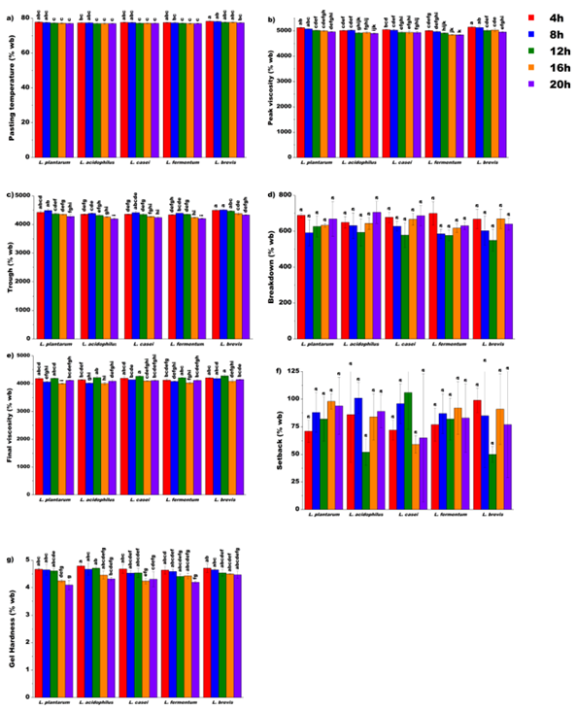
Figure 2. One-factor ANOVA for lactic acid bacteria strain and fermentation time effects on proximate properties of unripe banana flour.
A critical factor in interpreting these results is the analytical method employed. Because total carbohydrate is typically calculated by difference, the apparent rise in carbohydrate at later time points for certain strains (e.g.,
L. brevis at 20 h, 70.24%,
Figure 2d) does not reflect actual starch preservation. Instead, it is attributed to the inclusion of accumulated non-sugar organic solids, namely lactic and acetic acids, within this broad analytical pool
| [27] | Aly, M. O., S. M. Ghobashy, and S. M. Aborhyem, Authentication of protein, fat, carbohydrates, and total energy in commercialized high protein sports foods with their labeling data. Scientific Reports, 2023. 13(1): p. 15359.
https://doi.org/10.1038/s41598-023-42084-3 |
[27]
. The significant strain × time interaction therefore reflected the divergent kinetic patterns observed. The variations arose from the strain-dependent balance between substrate consumption through saccharification and the simultaneous accumulation of organic acids
.
3.1.4. Effect of Lacto-fermentation on Dietary Fiber Content
The DF content was significantly reduced by fermentation (
Figure 2e), exhibiting strong effects from the specific strain, time, and their interaction (
p < 0.001 for all;
Table 1). The general decline in DF over time provided quantitative evidence of the structural breakdown of the flour matrix, specifically targeting complex non starch polysaccharides. This degradation was mediated by both acid catalysis and the action of a spectrum of hydrolytic enzymes, including hemicellulases and glycosidases, that cleave the glycosidic bonds in non-starch polysaccharides
| [29] | Zhao, Y., et al., Advanced Modification Strategies of Plant-Sourced Dietary Fibers and Their Applications in Functional Foods. Foods, 2025. 14(15): p. 2710.
https://doi.org/10.3390/foods14152710 |
[29]
. The strong negative Spearman correlation between DF and TA (
r = −0.663,
p < 0.05,
Figure 1) and the positive Spearman correlation with pH (
r = 0.649,
p < 0.05;
Figure 1) reinforced the finding that deeper acidification aligned directly with lower measured DF. This observation is consistent with the conversion of insoluble fiber into smaller, soluble fragments
| [30] | Weckx, P., et al., High temperature 1H DOSY NMR reveals sourdough fermentation of wheat flour alters the molecular structure of water-extractable arabinoxylans. Food Hydrocolloids, 2025. 166: p. 111332.
https://doi.org/10.1016/j.foodhyd.2025.111332 |
[30]
. Besides, the strain differences were attributed to metabolic tempo and accessory enzyme profiles. Faster acidifiers such as
L. fermentum and
L. plantarum reached the optimal pH regime for non-starch polysaccharides destabilization more quickly. They also possessed enzymes like feruloyl esterases, capable of fragmenting lignin-carbohydrate complexes, thereby increasing solubility and reducing the fraction quantified as DF
| [31] | Su, Y., et al., Role of laccase and xylanase, with or without ferulic acid esterase-producing Lactiplantibacillus plantarum, on the aerobic stability, microbial composition and in vitro degradability of mulberry silage. BMC Microbiology, 2025. 25(1): p. 439. https://doi.org/10.1186/s12866-025-04165-3 |
[31]
. The significant strain × time interaction evidenced by non-chronological Tukey groupings (
Figure 2e), revealed that fiber degradation kinetics were highly strain specific. Distinct degradation trajectories were observed with
L. fermentum reached peak fiber content (15.16%) at 4 h before a sharp decline, whereas
L. brevis started lower and degraded more gradually (
Figure 2e). These asynchronous patterns indicated that the extent of fiber matrix remodeling at any given time depended on the unique combination of acid and hydrolytic enzymes produced by each strain.
3.1.5. Effect of Lacto-fermentation on Protein Content
The protein content increased (
Figure 2f) during fermentation, showing significant main effects of strain (
p < 0.05) and time (
p < 0.001), with a significant interaction (
p < 0.05) (
Table 1). This increase resulted from two interconnected pathways. First, the concentration effect, driven by the selective catabolism of starch and sugars, raised the protein percentage of the remaining dry matter
| [32] | Yan, Y., et al., Environmental factors and microbial interactions drive microbial community succession during solid-state fermentation of corn husk for microbial biomass protein production. Frontiers in Microbiology, 2025. Volume 16 - 2025.
https://doi.org/10.3389/fmicb.2025.1646555 |
[32]
. Second, the accumulation of microbial protein (biomass) was quantified by the total nitrogen assay
| [33] | Kong, S., et al., Three-Stage Solid-State Fermentation Technology for Distillers’ Grain Feed Protein Based on Different Microorganisms Considering Oxygen Requirements. Fermentation, 2024. 10(11): p. 550.
https://doi.org/10.3390/fermentation10110550 |
[33]
. The positive Spearman correlation with TA (
r = 0.518,
p < 0.05,
Figure 1) and the negative Spearman correlation with pH (
r = −0.465,
p < 0.05;
Figure 1) confirmed that higher measured protein coincided with more advanced carbohydrate catabolism and acidification. Strain variability was dictated by proteolytic capacity. Robust strains like
L. plantarum (highest protein, 4.23% at 20 h;
Figure 2f) possess efficient proteolytic systems, including cell envelope proteinases and peptidases. The enzymes degrade native plant proteins into peptides and amino acids, supporting high growth rates and enhancing microbial nitrogen production
| [34] | Ji, D., et al., Cell-envelope proteinases from lactic acid bacteria: Biochemical features and biotechnological applications. Comprehensive Reviews in Food Science and Food Safety, 2021. 20(1): p. 369-400.
https://doi.org/10.1111/1541-4337.12676 |
| [35] | Liu, R., et al., Exploring the proteolytic activity of Lactiplantibacillus plantarum AHQ-14 to reduce the allergenicity of milk protein and its probiotic potential based on peptidomics and genomics. Journal of Dairy Science, 2025. 108(5): p. 4573-4588. https://doi.org/10.3168/jds.2024-26245 |
[34, 35]
. In contrast, strains with slower acidification and lower inherent proteolytic activity progress more gradually
| [36] | Zioga, E., et al., Screening approaches and potential of isolated lactic acid bacteria for improving fermentation of Saccharina latissima. BMC Biotechnology, 2025. 25(1): p. 2. https://doi.org/10.1186/s12896-024-00926-6 |
[36]
. The significant strain × time interaction arose from the asynchronous kinetics of carbohydrate depletion (driving the concentration effect) and biomass accrual (driving microbial nitrogen content), resulting in unique temporal patterns for each specific starter culture.
3.1.6. Effect of Lacto-fermentation on Ash Content
The ash content, representing the inorganic mineral fraction, demonstrated statistical stability throughout the fermentation process (
Figure 2g). Both main effects for strain (
p > 0.05) and time (
p > 0.05), as well as the strain × time interaction (
p > 0.05), were non-significant (
Table 1). This statistical invariance, confirmed by all strain ×time sharing the same the Tukey group (
Figure 2g) is consistent with the nature of ash, which comprises non metabolizable inorganic elements. These components are neither significantly catabolized by LAB for energy nor volatilized during fermentation or drying
| [20] | Gänzle, M. G., Lactic metabolism revisited: metabolism of lactic acid bacteria in food fermentations and food spoilage. Current Opinion in Food Science, 2015. 2: p. 106-117.
https://doi.org/10.1016/j.cofs.2015.03.001 |
[20]
. While, mineral traces are required for microbial function, the biomass accumulation over the 20 h period was insufficient to quantitatively alter the bulk mineral content of the substrate detectable by proximate analysis. Consequently, the stability of the ash content serves as a key indicator that the observed functional and structural modifications were confined exclusively to the organic macronutrient matrix.
3.1.7. Effect of Lacto-fermentation on Fat Content
The fat content showed a significant main effect from strain (
p < 0.05) and a highly significant strain × time interaction (
p < 0.001), while the main effect of time was non-significant (
p > 0.05) (
Table 1). This indicated that changes were localized and dependent on the specific strain/time combination rather than systematic temporal decline. The tendency toward lower measured fat in more acidified samples was suggested by the Spearman correlation structure (negative with TA:
r = −0.120; positive with pH:
r = 0.097;
Figure 1). These modest fluctuations resulted from three coupled pathways linked to the broader matrix changes. The first involves limited lipolysis via strain specific esterases and lipases, as documented in
L. plantarum, releasing free fatty acids
| [37] | Chai, Y., et al., Dissecting the High Esterase/Lipase Activity and Probiotic Traits in Lactiplantibacillus plantarum B22: A Genome-Guided Functional Characterization. Foods, 2025. 14(13): p. 2354. https://doi.org/10.3390/foods14132354 |
| [38] | Dai, Y., et al., Recent Applications and Prospects of Enzymes in Quality and Safety Control of Fermented Foods. Foods, 2024. 13(23): p. 3804. https://doi.org/10.3390/foods13233804 |
[37, 38]
. The second is the cellular assimilation of free fatty acids by LAB for membrane restructuring
| [39] | Van den Berg, S. P. H., et al., Exogenous fatty acids inhibit fatty acid synthesis by competing with endogenously generated substrates for phospholipid synthesis in Escherichia coli. FEBS Letters, 2025. 599(5): p. 667-681.
https://doi.org/10.1002/1873-3468.15092 |
[39]
. The third involves reduced solvent extractability due to starch-lipid inclusion complexes forming between acid mobilized amylose chains and lipids during post fermentation drying
. The highly significant strain × time interaction captured the asynchronous kinetics of these competing effects. The net higher (
L. fermentum at 12 h, 1.00%) or lower
L. casei at 12 h, 0.80%) crude fat (
Figure 2h) reflected transiently balance among lipid liberation, assimilation, and complexation.
3.2. Starch Properties
3.2.1. Effect of Lacto-fermentation on Total Starch Content
Total starch content was strongly influenced by significant main effects of both strain and time (
p < 0.001 for both;
Table 1), while their interaction was non-significant (
p > 0.05). This alteration might be resulted from the concerted degradation of the starch granule through acid catalyzed chain scission and strain specific amylolytic hydrolysis, which converted high molecular-weight polymers into fermentable saccharides
| [23] | Yan, X., et al., A review of the effects of fermentation on the structure, properties, and application of cereal starch in foods. Critical Reviews in Food Science and Nutrition, 2025. 65(12): p. 2323-2342. https://doi.org/10.1080/10408398.2024.2334269 |
| [42] | Halim, A., et al., Investigating the Effects of Acid Hydrolysis on Physicochemical Properties of Quinoa and Faba Bean Starches as Compared to Cassava Starch. Foods, 2024. 13(23): p. 3885. https://doi.org/10.3390/foods13233885 |
[23, 42]
. The strong negative Spearman correlation with TA (
r = − 0.852,
p < 0.05;
Figure 1) provided strong statistical evidence for the causal role of acidification in promoting structural degradation. Strain differences were restricted to the magnitude of the reduction. Faster acidifiers and potentially more amylolytic strains like
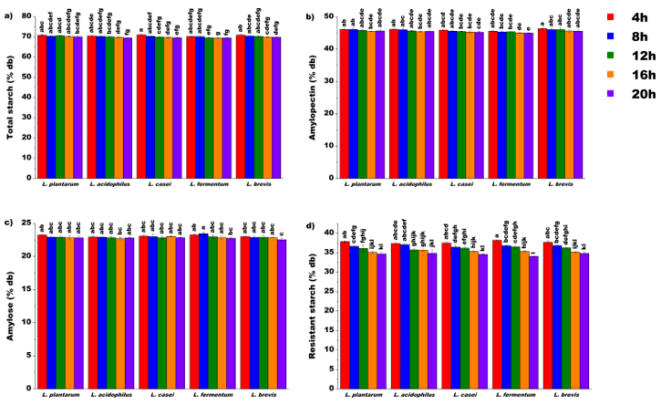
L. fermentum reached the lowest endpoints (69.40% at 16 h,
Figure 3a), reflecting more advanced degradation within the fixed time interval
| [26] | Mukisa, I. M., et al., Influence of Cofermentation by Amylolytic Lactobacillus plantarum and Lactococcus lactis Strains on the Fermentation Process and Rheology of Sorghum Porridge. Applied and Environmental Microbiology, 2012. 78(15): p. 5220-5228. https://doi.org/10.1128/AEM.00857-12 |
[26]
. The non-significant strain × time interaction confirmed that the kinetic patterns of starch loss were broadly similar across all starters. Accordingly, strain identity primarily governed the magnitude of reduction rather than the underlying time dependent degradation pathway.
3.2.2. Effect of Lacto-fermentation on Amylopectin Content
The amylopectin content reflected the total starch behavior, showing highly significant variations due to strain and time (
p < 0.001 for both,
Table 1), with a non-significant interaction (
p > 0.05). The strong positive Spearman correlation with total starch (
r = 0.848,
p < 0.05;
Figure 1) demonstrated that this highly branched polymer was the primary determinant of the overall starch depletion. Amylopectin degradation results from the combined effects of acid catalysis, which shortens long branches in amorphous regions. This process is enhanced by the synergistic action of microbial enzymes, specifically debranching enzymes (targeting α−1,6 linkages) and α-amylase (targeting α−1,4 linkages)
| [43] | Shao, D., et al., Modification of Structure, Pasting, and In Vitro Digestion Properties of Glutinous Rice Starch by Different Lactic Acid Bacteria Fermentation. Foods, 2025. 14(3): p. 367. https://doi.org/10.3390/foods14030367 |
[43]
. The extent depolymerization was quantitatively related to the depth of acidification, as shown by the negative correlation with TA (
r = −0.772,
p < 0.05;
Figure 1). Strain differences in reduction magnitude (
L. fermentum having the lowest values;
Figure 3b), aligned with inter-strain variation in acidification kinetics and starch modifying enzyme profiles. The lack of a significant strain × time interaction suggests a shared time dependent amylopectin degradation pathway across all starters.
3.2.3. Effect of Lacto-fermentation on Amylose Content
The amylose content was significantly influenced by strain (
p < 0.05) and time (
p < 0.01), with a non-significant interaction (
p > 0.05) (
Table 1). The progressive decline (
Figure 3c) resulted from acid catalyzed chain scission that preferentially occurred in the amorphous, amylose rich regions of the starch granule
| [42] | Halim, A., et al., Investigating the Effects of Acid Hydrolysis on Physicochemical Properties of Quinoa and Faba Bean Starches as Compared to Cassava Starch. Foods, 2024. 13(23): p. 3885. https://doi.org/10.3390/foods13233885 |
[42]
. This fragmentation shortened the linear glucan chains below the minimum length required to form the stable iodine-triiodide complex, leading to a measured reduction in apparent amylose content quantified by colorimetric methods
. The statistical coherence of this degradation with the overall fermentation trend was supported by the negative correlation with TA (
r = −0.690,
p < 0.05;
Figure 1). Notably, the strong positive correlation between amylose and RS (
r = 0.812
p < 0.05;
Figure 1) provided a crucial mechanistic insight. It indicates that the extent of amylose degradation directly compromises the pool of linear chains essential for subsequent retrogradation driven RS3 and RS5 formation
| [41] | Tan, X., et al., Amylose content controls the structures and digestibility of starch-lipid complexes during microwave postprocessing. Carbohydrate Polymers, 2025. 358: p. 123530. https://doi.org/10.1016/j.carbpol.2025.123530 |
[41]
. Strain differences in degradation rate were governed by acidification kinetics. Faster acidifiers (
L. fermentum and
L. plantarum) promoted a sharper decline in long chain populations, while
L. brevis, with a slower acidification profile due to low amylolytic activity, showed a moderated rate of structural breakdown.
3.2.4. Effect of Lacto-fermentation on Resistant Starch Content
RS content was driven primarily by incubation time, which showed a highly significant effect (
p < 0.001), whereas the main strain effect and the strain × time interaction were not significant (
p > 0.05) (
Table 1). The pronounced and progressive decrease in RS over time (e.g.,
L. fermentum dropping from 38.20% at 4 h to 34.09% at 20 h,
Figure 3d) was linked to the cumulative action of organic acids. The strong negative correlation with TA (
r = −0.937, p < 0.05;
Table 1) and positive correlation with pH (r = 0.933,
p < 0.05;
Table 1) indicated that low pH conditions catalyzed the hydrolysis and erosion of the crystalline and semi crystalline structures. Specifically, this affects RS3 and RS5, rendering them more accessible to enzyme degradation
| [43] | Shao, D., et al., Modification of Structure, Pasting, and In Vitro Digestion Properties of Glutinous Rice Starch by Different Lactic Acid Bacteria Fermentation. Foods, 2025. 14(3): p. 367. https://doi.org/10.3390/foods14030367 |
| [45] | Yu, S. J., K. Y. Lee, and H. G. Lee, Impact of different organic acids on heat-moisture treated potato starch for enhancing prebiotic potential. Food Science and Biotechnology, 2024. 33(14): p. 3347-3356.
https://doi.org/10.1007/s10068-024-01575-3 |
[43, 45]
. The statistical finding that time, rather than strain identity, was the dominant driver suggested that the total duration of exposure to the acidic environment imposed a consistent structural fate upon the RS fraction. This reduction was further confirmed as an integrated response of the starch matrix by the positive correlations of RS with amylose (
r = 0.812,
p < 0.05;
Table 1) and total starch (
r = 0.744,
p < 0.05;
Table 1). These correlations indicate that RS loss co-occurred with the consumption of the bulk starch pool and the shortening of linear chains
| [23] | Yan, X., et al., A review of the effects of fermentation on the structure, properties, and application of cereal starch in foods. Critical Reviews in Food Science and Nutrition, 2025. 65(12): p. 2323-2342. https://doi.org/10.1080/10408398.2024.2334269 |
[23]
.
Figure 3. One-factor ANOVA for lactic acid bacteria strain and fermentation time effects on starch properties of unripe banana flour
3.3. Functional Properties
3.3.1. Effect of Lacto-fermentation on Water Solubility Index
The WSI increased significantly over time (
p < 0.001) with a strain effect (
p < 0.01), whereas the strain × time interaction was not significant (
p > 0.05) (
Figure 4a;
Table 1). This increase is a reliable indicator of macromolecular depolymerization within the flour matrix. An acidification driven mechanism is supported by the positive Spearman correlation with TA (
r = 0.934,
p < 0.05;
Figure 1) and negative Spearman correlation with pH (
r = −0.942,
p < 0.05;
Figure 1). Consistently, organic acid accumulation and hydrolase activity cleaved glycosidic bonds in starch and fiber, increasing the fraction of low molecular weight, water soluble dextrins, peptides, and oligosaccharides
| [23] | Yan, X., et al., A review of the effects of fermentation on the structure, properties, and application of cereal starch in foods. Critical Reviews in Food Science and Nutrition, 2025. 65(12): p. 2323-2342. https://doi.org/10.1080/10408398.2024.2334269 |
| [42] | Halim, A., et al., Investigating the Effects of Acid Hydrolysis on Physicochemical Properties of Quinoa and Faba Bean Starches as Compared to Cassava Starch. Foods, 2024. 13(23): p. 3885. https://doi.org/10.3390/foods13233885 |
[23, 42]
. Strong inverse Spearman correlations between WSI and RS (
r = −0.861,
p < 0.05;
Figure 1) and between WSI and total starch (
r = −0.798,
p < 0.05;
Figure 1) indicate that WSI elevation occurred at the expense of the native, insoluble, ordered structure. Strain differences in WSI magnitude, with
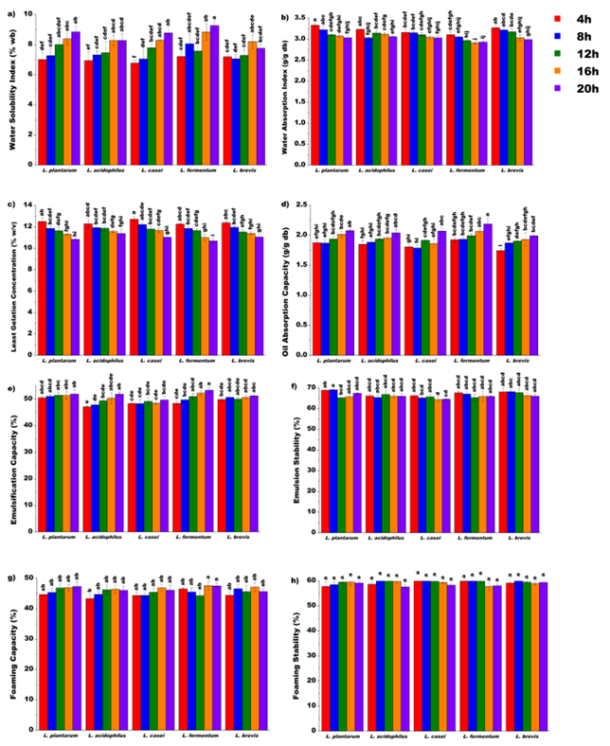
L. fermentum reaching the highest 9.27% at 20 h (
Figure 4a), were consistent with strain-specific acidification rates, supporting the interpretation that faster acidifiers progressed further along a common solubilization pathway
| [46] | Erem, E. and M. Kilic-Akyilmaz, The role of fermentation with lactic acid bacteria in quality and health effects of plant-based dairy analogues. Comprehensive Reviews in Food Science and Food Safety, 2024. 23(4): p. e13402.
https://doi.org/10.1111/1541-4337.13402 |
| [47] | You, Z., et al., Effect of Lactic Acid Bacteria Fermentation Agent on the Structure, Physicochemical Properties, and Digestive Characteristics of Corn, Oat, Barley, and Buckwheat Starch. Foods, 2025. 14(16): p. 2904.
https://doi.org/10.3390/foods14162904 |
[46, 47]
.
3.3.2. Effect of Lacto-fermentation on Water Absorption Index
The WAI, a highly dynamic indicator, exhibited significant main effects of strain and time, as well as a significant strain × time interaction
(p < 0.001 for all;
Table 1). WAI declined over time (
Figure 4b) and was inversely correlated with TA (r = −0.782,
p < 0.05;
Figure 1). This decline might be attributable to acid-catalyzed degradation of the starch granule's structural integrity, restricting imbibition and swelling, and thereby reducing the water holding capacity of the insoluble fraction
| [32] | Yan, Y., et al., Environmental factors and microbial interactions drive microbial community succession during solid-state fermentation of corn husk for microbial biomass protein production. Frontiers in Microbiology, 2025. Volume 16 - 2025.
https://doi.org/10.3389/fmicb.2025.1646555 |
[32]
. The inverse relationship with WSI (
r = −0.765,
p < 0.05;
Figure 1) confirmed a critical functional trade-off, showing that polymer fragmentation maximized solubility (WSI↑) by dismantling the network required for maximum water retention (WAI↓)
| [48] | Dou, X., et al., Effects of Lactic Acid Bacteria Fermentation on the Physicochemical Properties of Rice Flour and Rice Starch and on the Anti-Staling of Rice Bread. Foods, 2023. 12(20): p. 3818. https://doi.org/10.3390/foods12203818 |
[48]
. Furthermore, the significant strain × time interaction reflects asynchronous functional patterns driven by the distinct metabolic characteristics and acidification kinetics of the LAB species
. The rapid lactic acid production characteristic of facultatively heterofermentative strains, such as
L. plantarum, quickly imposes the structural changes that lead to the optimal WAI at 4 h (
Figure 4b). Conversely, obligately heterofermentative strains, such as
L. fermentum (which yielded the lowest WAI at 16 h and 20 h;
Figure 4b), co-produce acetate and CO
2 alongside lactic acid
| [50] | Gänzle, M. G., N. Vermeulen, and R. F. Vogel, Carbohydrate, peptide and lipid metabolism of lactic acid bacteria in sourdough. Food Microbiology, 2007. 24(2): p. 128-138.
https://doi.org/10.1016/j.fm.2006.07.006 |
[50]
. This differing spectrum of organic acids, combined with potential variations in accessory enzyme activity, uniquely modulates the rate of matrix depolymerization. As the result, the observed WAI reflects the net outcome of the strain's temporal metabolic rhythm intersecting with the starch matrix's susceptibility.
Figure 4. One-factor ANOVA for lactic acid bacteria strain and fermentation time effects on functional properties of unripe banana flour.
3.3.3. Effect of Lacto-fermentation on Least Gelation Concentration
The LGC decreased (
Figure 4c) significantly during fermentation (time:
p < 0.001; strain:
p < 0.01;
Table 1), indicating enhanced gelling ability, while the strain × time interaction was non-significant (
p > 0.05). The strong negative Spearman correlations with TA (r = −0.932,
p < 0.05;
Figure 1) and WSI (r = −0.902;
p < 0.05,
Figure 1) confirmed that deepening acidification and solubilization were prerequisites for improved gelation. Acid and enzyme mediated hydrolysis generated shorter, more mobile linear glucan chains, which facilitated rapid helix formation and the efficient assembly of junction zones during cooling
| [42] | Halim, A., et al., Investigating the Effects of Acid Hydrolysis on Physicochemical Properties of Quinoa and Faba Bean Starches as Compared to Cassava Starch. Foods, 2024. 13(23): p. 3885. https://doi.org/10.3390/foods13233885 |
[42]
. This reduction lowers the minimum solids required to establish a continuous gel network
| [23] | Yan, X., et al., A review of the effects of fermentation on the structure, properties, and application of cereal starch in foods. Critical Reviews in Food Science and Nutrition, 2025. 65(12): p. 2323-2342. https://doi.org/10.1080/10408398.2024.2334269 |
[23]
. The positive Spearman correlation between LGC and RS (
r = 0.925,
p < 0.05;
Figure 1) suggested that the structural components of resistance are also essential for forming a network that resists collapse at lower concentrations. Strain differences in the magnitude of LGC reduction were consistent with acidification rates, with faster acidifiers (
L. fermentum, lowest LGC 10.69% at 20 h,
Figure 4c) accelerating the accumulation of these gel-competent chain populations.
3.3.4. Effect of Lacto-fermentation on Oil Absorption Capacity
The OAC increased (
Figure 4d) significantly, with highly significant main effects of strain and time (
p < 0.001 for both;
Table 1), whereas the strain × time interaction was not significant (
p > 0.05). This increase correlated with the matrix breakdown, as indicated by strong positive Spearman correlations with TA (
r = 0.856,
p < 0.05;
Figure 1) and WSI (
r = 0.824,
p < 0.05;
Figure 1). Fermentation induced chain scission and acid erosion generate a highly porous structure, increasing specific surface area and promoting oil entrapment by capillarity uptake. Furthermore, acid conditions and limited proteolysis promote partial protein unfolding, exposing buried hydrophobic residues, and thereby enhancing oil binding through non-polar interactions
| [46] | Erem, E. and M. Kilic-Akyilmaz, The role of fermentation with lactic acid bacteria in quality and health effects of plant-based dairy analogues. Comprehensive Reviews in Food Science and Food Safety, 2024. 23(4): p. e13402.
https://doi.org/10.1111/1541-4337.13402 |
[46]
. The negative Spearman correlation of OAC with matrix integrity indices (OAC vs LGC:
r = −0.860,
p < 0.05; OAC vs PV:
r = −0.765,
p < 0.05;
Figure 1) captured the functional trade-off. The molecular and granular loosening that reduces paste viscosity and gel strength is precisely the structural remodeling required to maximize hydrophobic exposure and micro-void volume for oil uptake
. Strain differences in magnitude, with faster acidifiers achieving higher endpoints (e.g.,
L. fermentum 2.187 at 20 h,
Figure 4d), were coherent with the differential pace of structural collapse.
3.3.5. Effect of Lacto-fermentation on Emulsification Capacity
The EC increased (
Figure 4e) during fermentation, showing highly significant main effects of strain and time (
p < 0.001 for both), as well as a significant strain × time interaction (
p < 0.05 (
Table 1). The positive Spearman correlation with TA (
r = 0.639,
p <0.05;
Figure 1) suggested that EC improvement was linked to acid production and depolymerization. EC enhancement relies on the formation of amphiphilic, surface-active species. Proteolytic activity generated low molecular weight peptides that adsorbed rapidly at interfaces and formed stabilizing films
| [52] | García-Moreno, P. J., et al., Recent advances in the production of emulsifying peptides with the aid of proteomics and bioinformatics. Current Opinion in Food Science, 2023. 51: p. 101039. https://doi.org/10.1016/j.cofs.2023.101039 |
| [53] | Jiang, Y.-X., et al., Effects of proteolysis pretreatment on the formation, structural changes and emulsifying properties of rice glutelin amyloid-like fibrils. Food Chemistry, 2025. 475: p. 143252. https://doi.org/10.1016/j.foodchem.2025.143252 |
[52, 53]
. Starch hydrolysis generated soluble dextrins
| [23] | Yan, X., et al., A review of the effects of fermentation on the structure, properties, and application of cereal starch in foods. Critical Reviews in Food Science and Nutrition, 2025. 65(12): p. 2323-2342. https://doi.org/10.1080/10408398.2024.2334269 |
[23]
, while certain strains synthesized EPS that acted as emulsifiers or co-stabilizers
| [24] | Hernández-Figueroa, R. H., A. López-Malo, and E. Mani-López, Lactic Acid Bacteria-Derived Exopolysaccharides: Dual Roles as Functional Ingredients and Fermentation Agents in Food Applications. Fermentation, 2025. 11(9): p. 538.
https://doi.org/10.3390/fermentation11090538 |
[24]
. The significant strain × time interaction reflected the asynchronous progression of these processes. The unique metabolic kinetics and timing of EPS biosynthesis or peptide release for each strain resulted in distinct development patterns. For instance,
L. fermentum reached the highest EC (53.39% at 20 h,
Figure 4e) due to its combination of vigorous acidification and probable high proteolytic/biosynthetic activity.
3.3.6. Effect of Lacto-fermentation on Emulsion Stability
The ES was significantly influenced by strain (
p < 0.001) and time (
p < 0.05), but lacked a significant interaction (
p > 0.05) (
Table 1). ES followed a non-monotonic time course, with greater stability at early to mid-fermentation, in contrast to the continuous increase observed for EC. This pattern is consistent with a mechanism in which ES depends on a robust interfacial film and sufficient bulk viscosity to resist creaming and coalescence
. As fermentation progressed, acid induced thinning of the continuous phase via starch depolymerization, together with reduced electrostatic repulsion at the protein interface, promoted flocculation and coalescence, thereby lowering ES
| [23] | Yan, X., et al., A review of the effects of fermentation on the structure, properties, and application of cereal starch in foods. Critical Reviews in Food Science and Nutrition, 2025. 65(12): p. 2323-2342. https://doi.org/10.1080/10408398.2024.2334269 |
| [55] | Olsmats, E. and A. R. Rennie, Understanding Stabilization of Oil-in-Water Emulsions with Pea Protein─Studies of Structure and Properties. Langmuir, 2024. 40(26): p. 13386-13396.
https://doi.org/10.1021/acs.langmuir.4c00540 |
[23, 55]
. The stability trade-off was reflected in the positive Spearman correlations with structural integrity indices (ES vs WAI:
r = 0.581,
p < 0.05; ES vs amylopectin:
r =0.612,
p < 0.05;
Figure 1) and in negative Spearman correlation with solubilization (ES vs WSI:
r = −0.435,
p < 0.05;
Figure 1) and TA (
r = −0.510,
p < 0.05;
Figure 1). Taken together, these relationships indicate that excessive hydrolysis, although increasing EC, compromises the bulk viscosity and macromolecular structure required for sustained stability
| [17] | Bashash, M., et al., The emulsifying capacity and stability of potato proteins and peptides: A comprehensive review. Comprehensive Reviews in Food Science and Food Safety, 2024. 23(5): p. e70007. https://doi.org/10.1111/1541-4337.70007 |
[17]
. Strain differences were minor (
Figure 4f), reflecting only subtle variations in the capacity to generate stabilizing components like EPS that offset the destructive bulk-phase thinning.
3.3.7. Effect of Lacto-fermentation on Foaming Capacity
The FC was primarily governed by the highly significant effect of incubation time (
p < 0.001, with non-significant (
p > 0.05) strain and interaction effects (
Table 1). This uniform temporal enhancement was driven by the progressive accumulation of soluble, surface-active components necessary for reducing surface tension and stabilizing bubble formation
| [56] | Othmeni, I., R. Karoui, and C. Blecker, Impact of pH on the structure, interfacial and foaming properties of pea protein isolate: Investigation of the structure – Function relationship. International Journal of Biological Macromolecules, 2024. 278: p. 134818. https://doi.org/10.1016/j.ijbiomac.2024.134818 |
[56]
. Consistent with this interpretation, FC correlated positively with WSI (
r = 0.759,
p < 0.05;
Figure 1) and with TA (
r = 0.652,
p < 0.05;
Figure 1). These foam promoting molecules include amphiphilic peptides generated by acid-promoted protein unfolding and proteolysis, as well as soluble dextrins arising from starch breakdown
| [42] | Halim, A., et al., Investigating the Effects of Acid Hydrolysis on Physicochemical Properties of Quinoa and Faba Bean Starches as Compared to Cassava Starch. Foods, 2024. 13(23): p. 3885. https://doi.org/10.3390/foods13233885 |
| [57] | Qi, X., et al., Proteolysis improves the foaming properties of rice protein fibrils: Structure, physicochemical properties changes, and application in angel food cake. Food Chemistry, 2024. 437: p. 137765.
https://doi.org/10.1016/j.foodchem.2023.137765 |
[42, 57]
. The non-significant strain effect suggests a shared mechanism in which the concentration of key hydrolysates is primarily governed by the cumulative duration of matrix degradation, causing all strains to converge toward high FC endpoints (e.g.,
L. fermentum reaching 47.54% at 20 h,
Figure 4g). Indeed, the inverse relationship with LGC (
r = −0.692,
p < 0.05;
Figure 1) highlighted a functional trade-off, whereby structural dismantling and solubilization, although detrimental to gel formation, enhance foaming capacity.
3.3.8. Effect of Lacto-fermentation on Foaming Stability
The FS was not significantly affected (
p > 0.05) by strain, time, or their interaction (
Table 1). This, statistical homogeneity (
Figure 4h), indicates that FS is a resilient property, remaining largely unaffected throughout the 4–20 h fermentation period. FS depends on the continuous phase viscosity and the viscoelasticity of the interfacial film
| [58] | Wüest, S., et al., Plant vs Dairy protein stabilised cappuccino foams: how protein and hydrocolloid conformational changes affect foam stability. Food Hydrocolloids, 2025. 169: p. 111621. https://doi.org/10.1016/j.foodhyd.2025.111621 |
[58]
. The lack of a strong temporal trend might be interpreted as a functional stalemate, where the destabilizing influence of acid driven continuous phase thinning was counterbalanced by residual structural components (FS vs RS:
r = 0.412,
p < 0.05;
Figure 1) or by the stabilizing effects of strain dependent peptides and EPS
| [24] | Hernández-Figueroa, R. H., A. López-Malo, and E. Mani-López, Lactic Acid Bacteria-Derived Exopolysaccharides: Dual Roles as Functional Ingredients and Fermentation Agents in Food Applications. Fermentation, 2025. 11(9): p. 538.
https://doi.org/10.3390/fermentation11090538 |
| [52] | García-Moreno, P. J., et al., Recent advances in the production of emulsifying peptides with the aid of proteomics and bioinformatics. Current Opinion in Food Science, 2023. 51: p. 101039. https://doi.org/10.1016/j.cofs.2023.101039 |
[24, 52]
. The negative Spearman correlations between FS and both EC (
r = −0.492;
p < 0.05,
Figure 1) and OAC (
r = −0.307;
p < 0.05,
Figure 1) underscored the functional divergence, showing that the high degree of structural loosening required to maximize FC and EC resulted in inadequate bulk viscosity and film integrity required for long term stability
| [17] | Bashash, M., et al., The emulsifying capacity and stability of potato proteins and peptides: A comprehensive review. Comprehensive Reviews in Food Science and Food Safety, 2024. 23(5): p. e70007. https://doi.org/10.1111/1541-4337.70007 |
[17]
.
3.4. Texture and Pasting Properties
3.4.1. Effect of Lacto-fermentation on Pasting Temperature
The PT differed significantly by strain and time (
p < 0.001, both), whereas the strain × time interaction was not significant (
p > 0.05) (
Table 1). This can be attributed to acid accumulation, as indicated by the strong negative Spearman correlation between PT and TA (
r = −0.783,
p < 0.05;
Figure 1). Lower PT values under higher acidity are consistent with acid catalyzed erosion of amorphous regions in starch granules, which weakens internal associative forces and reduces the thermal energy required for initial swelling
| [42] | Halim, A., et al., Investigating the Effects of Acid Hydrolysis on Physicochemical Properties of Quinoa and Faba Bean Starches as Compared to Cassava Starch. Foods, 2024. 13(23): p. 3885. https://doi.org/10.3390/foods13233885 |
[42]
. Preservation of native structure was associated with higher PT, as supported by the positive Spearman correlation between PT and TS (
r = 0.779,
p < 0.05;
Figure 1). Strain differences in magnitude, with
L. brevis retaining the highest initial PT of 78.3°C (
Figure 5a) were coherent with differential rates of granular weakening, such that slower acidifiers incurred less damage at matched early time points. The absence of a significant interaction confirms a common time-dependent pathway of thermal destabilization across strains.
3.4.2. Effect of Lacto-fermentation on Peak Viscosity
The PV decreased during fermentation (
Figure 5b), with highly significant main effects of both strain and time (
p < 0.001 for both), whereas the strain × time interaction was a non-significant interaction (
p > 0.05) (
Table 1). The rheological collapse was statistically related to the extent of matrix breakdown (PV vs TA:
r = −0.775,
p < 0.05;
Figure 1) and structural integrity (PV vs Amylopectin:
r = 0.820,
p < 0.05;
Figure 1). These patterns are consistent with acid and enzyme driven predigestion that limits starch granule swelling power
| [48] | Dou, X., et al., Effects of Lactic Acid Bacteria Fermentation on the Physicochemical Properties of Rice Flour and Rice Starch and on the Anti-Staling of Rice Bread. Foods, 2023. 12(20): p. 3818. https://doi.org/10.3390/foods12203818 |
[48]
. Chain scission shortens glucan chains and impedes the volumetric expansion required to attain high PV under heating
| [23] | Yan, X., et al., A review of the effects of fermentation on the structure, properties, and application of cereal starch in foods. Critical Reviews in Food Science and Nutrition, 2025. 65(12): p. 2323-2342. https://doi.org/10.1080/10408398.2024.2334269 |
[23]
. A strong positive Spearman correlation with PT (
r = 0.925,
p < 0.05;
Figure 1) further indicates that the same weakening processes that lower pasting temperature also curtail ultimate swelling capacity. Consistent with this kinetic framework, faster acidifiers, notably
L. fermentum, reached the lowest PV within the defined range (4840 cP at 20 h;
Figure 5b), reflecting more advanced structural degradation.
3.4.3. Effect of Lacto-fermentation on Trough and Breakdown
The trough viscosity, reflecting paste stability during the holding phase, followed the same trend as PV (
Figure 5b and c). Significant main effects were observed for both strain and time (
p < 0.001, both), with no significant strain × time interaction (
p > 0.05) (
Table 1). The decline in trough was consistent with reduced granule integrity, making the paste more susceptible to shear thinning under sustained temperature
| [42] | Halim, A., et al., Investigating the Effects of Acid Hydrolysis on Physicochemical Properties of Quinoa and Faba Bean Starches as Compared to Cassava Starch. Foods, 2024. 13(23): p. 3885. https://doi.org/10.3390/foods13233885 |
[42]
. In contrast, breakdown viscosity, which reflects shear susceptibility (PV−Trough), showed a highly significant time effect (
p < 0.001;
Table 1). However, the effects of strain and interaction were non-significant (
p > 0.05). The lack of strain specific separation for breakdown, despite strong strain effects on PV and trough, could be interpreted as a systemic neutralization effect. Fermentation weakened granules across starters, constraining maximum swelling (PV ↓) and simultaneously limiting shear-induced loss during holding (trough ↓), yielding a statistically similar breakdown metric across strains
| [59] | Chang, L., et al., Effects of Lactobacillus plantarum fermentation on the structure, physicochemical properties, and digestibility of foxtail millet starches. International Journal of Biological Macromolecules, 2024. 270: p. 132496.
https://doi.org/10.1016/j.ijbiomac.2024.132496 |
[59]
. Correlation analysis reinforced this pattern, with trough aligning strongly with structural integrity (Trough vs PT:
r = 0.879,
p < 0.05;
Figure 1), whereas breakdown showed only weak associations, indicating that absolute paste stability is structurally governed while relative fragility is conserved across conditions. The significant strain effect on trough viscosity, but not on breakdown, highlights a distinct underlying mechanism (
Figure 5c and d). Strains such as
L. brevis and
L. plantarum at earlier time points (4 h, 8 h) produced the highest trough values (
Figure 5c), suggesting a more restrained modification of starch that preserved partial structural continuity within the paste. This behavior likely reflects strain specific amylolytic profiles, in which the balance between granule weakening and polymer solubilizing activities governs residual paste stability
.
Figure 5. One-factor ANOVA for lactic acid bacteria strain and fermentation time effects on functional texture and pasting properties of unripe banana flour.
3.4.4. Effect of Lacto-fermentation on Final Viscosity and Setback
The FV, which represents the residual strength of the cooled starch gel, showed highly significant main effects of strain and time (
p < 0.001, both) and no significant strain × time interaction (
p > 0.05) (
Table 1). Temporal changes in FV (
Figure 5e) were consistent with cumulative acid and enzyme driven degradation of starch polymers. As organic acids accumulate, together with carbohydrate active enzymes secreted by LAB strains, extensive chain cleavage occurs within amorphous domains of the granule
| [42] | Halim, A., et al., Investigating the Effects of Acid Hydrolysis on Physicochemical Properties of Quinoa and Faba Bean Starches as Compared to Cassava Starch. Foods, 2024. 13(23): p. 3885. https://doi.org/10.3390/foods13233885 |
[42]
. This reduces entanglement density and limits junction zone formation during cooling
| [43] | Shao, D., et al., Modification of Structure, Pasting, and In Vitro Digestion Properties of Glutinous Rice Starch by Different Lactic Acid Bacteria Fermentation. Foods, 2025. 14(3): p. 367. https://doi.org/10.3390/foods14030367 |
[43]
, resulting in surface erosion, increased porosity, and decreased swelling capacity and shear strength
| [23] | Yan, X., et al., A review of the effects of fermentation on the structure, properties, and application of cereal starch in foods. Critical Reviews in Food Science and Nutrition, 2025. 65(12): p. 2323-2342. https://doi.org/10.1080/10408398.2024.2334269 |
[23]
. The pathway is supported by the negative Spearman correlation between FV and TA (
r = −0.359,
p < 0.05;
Figure 1), indicating that greater acid production coincides with depletion of the long-chain polymers required for a strong gel network. Consistently, FV was negatively correlated with WSI (
r = −0.492,
p < 0.05;
Figure 1), suggesting that an increase in soluble fragments is associated with a decrease in gelling capacity. Differences in FV across strains are therefore attributable to distinct acidification kinetics and enzyme repertoires. In contrast to FV, setback viscosity, which quantifies short term retrogradation tendency, showed no significant (
p > 0.05;
Table 1) effects for strain, time, or their interaction. The statistical invariance in
Figure 5f indicates strong inhibition of starch recrystallisation across all conditions. Acid and enzyme activities fragmented linear glucan chains below the critical length for stable double helix formation, which effectively inhibited retrogradation throughout the fermentation conditions
| [43] | Shao, D., et al., Modification of Structure, Pasting, and In Vitro Digestion Properties of Glutinous Rice Starch by Different Lactic Acid Bacteria Fermentation. Foods, 2025. 14(3): p. 367. https://doi.org/10.3390/foods14030367 |
| [60] | Gänzle, M. and R. Follador, Metabolism of Oligosaccharides and Starch in Lactobacilli: A Review. Frontiers in Microbiology, 2012. Volume 3 - 2012.
https://doi.org/10.3389/fmicb.2012.00340 |
[43, 60]
. This outcome highlights a common functional endpoint achieved by all LAB strains irrespective of kinetic differences.
3.4.5. Effect of Lacto-fermentation on Gel Hardness
The gel hardness decreased significantly during fermentation (time:
p < 0.001; strain:
p < 0.05), with a non-significant interaction (
p > 0.05) (
Table 1). The softening tracked the acidification trajectory, as shown by a strong negative Spearman correlation with TA (
r = −0.911,
p < 0.05;
Figure 1) and a strong positive correlation with pH (
r = 0.905,
p < 0.05;
Figure 1). Acid driven depolymerization and chain shortening reduce average polymer molecular weight, weakened junction zone formation on cooling, and yielded softer gels
| [23] | Yan, X., et al., A review of the effects of fermentation on the structure, properties, and application of cereal starch in foods. Critical Reviews in Food Science and Nutrition, 2025. 65(12): p. 2323-2342. https://doi.org/10.1080/10408398.2024.2334269 |
| [61] | Gong, Y., et al., Factors and modification techniques enhancing starch gel structure and their applications in foods: A review. Food Chemistry: X, 2024. 24: p. 102045.
https://doi.org/10.1016/j.fochx.2024.102045 |
[23, 61]
. The structural interpretation was reinforced by positive associations between hardness and RS (
r = 0.817,
p < 0.05;
Figure 1) and between hardness and LGC (
r = 0.845,
p < 0.05;
Figure 1). Matrices that retain resistant structures require higher solids to form stronger gel networks
| [42] | Halim, A., et al., Investigating the Effects of Acid Hydrolysis on Physicochemical Properties of Quinoa and Faba Bean Starches as Compared to Cassava Starch. Foods, 2024. 13(23): p. 3885. https://doi.org/10.3390/foods13233885 |
[42]
. Besides, strain differences in the extent of softening (e.g.,
L. plantarum reaching the lowest mean hardness of 4.10 N at 20 h,
Figure 5g) were consistent with variations in their acidification kinetics and hydrolytic capacity.
3.5. Effect of Strain Dependent Acidification Kinetics on the Rheology of Fermented Unripe Banana Flour
Fermentation kinetics were the primary drivers of the physicochemical and rheological changes in the UBF matrix, showing clear strain-dependent differences in metabolic and physiological traits. As tabulated in
Table 2, the time required to reach the critical physiological stress threshold of pH 4.0 (t(pH = 4.0)) spanned from 15.10 h for the vigorous
L. fermentum to 20.00 h for the slower
L. brevis. This hierarchy was confirmed by the early acidification rate (ΔpH/Δt, 4−8 h), which ranked
L. fermentum highest (−0.15 h
−1). This rapid pH decline in
L. fermentum (t(pH = 4.0) = 15.10 h) and
L. plantarum (t(pH = 4.0) = 16.20 h) aligned with their efficient homofermentative conversion of hexoses and superior acid tolerance
| [50] | Gänzle, M. G., N. Vermeulen, and R. F. Vogel, Carbohydrate, peptide and lipid metabolism of lactic acid bacteria in sourdough. Food Microbiology, 2007. 24(2): p. 128-138.
https://doi.org/10.1016/j.fm.2006.07.006 |
[50]
. In contrast, the slower kinetics of
L. brevis reflect obligate heterofermentative metabolism with mixed end products and a lower ATP yield per hexose
| [46] | Erem, E. and M. Kilic-Akyilmaz, The role of fermentation with lactic acid bacteria in quality and health effects of plant-based dairy analogues. Comprehensive Reviews in Food Science and Food Safety, 2024. 23(4): p. e13402.
https://doi.org/10.1111/1541-4337.13402 |
[46]
. These kinetic contrasts translated into rheological outcomes, with faster acidifiers producing greater structural breakdown.
L. plantarum showed the largest reduction in gel hardness between 4 and 20 h (ΔHardness = 12.2%). This pattern is consistent with acid catalyzed hydrolysis together with proteolytic activity
. However, the PV reduction (ΔPV) provided a nuanced divergence, as
L. brevis, despite its slow acidification, displayed the largest magnitude of viscosity reduction (ΔPV = −191 cP). This outcome was driven by two competing factors. First, the less damaged early matrix had a higher initial PV, which provided more potential for viscosity loss. Second, the cumulative effect of prolonged, time-dependent acid exposure was significant. Specifically, the process took up to 20 h to reach pH 4.0, causing slower but sustained structural damage over the full duration. This pattern is consistent with the progressive surface erosion commonly observed in acidified starches
| [47] | You, Z., et al., Effect of Lactic Acid Bacteria Fermentation Agent on the Structure, Physicochemical Properties, and Digestive Characteristics of Corn, Oat, Barley, and Buckwheat Starch. Foods, 2025. 14(16): p. 2904.
https://doi.org/10.3390/foods14162904 |
[47]
. Setback changes were small and bidirectional (ΔSB ranging from −22 to +23 cP), indicating that final textural stability is highly sensitive to the chain length distribution produced by each strain’s balance of chain scission and debranching during fermentation
.
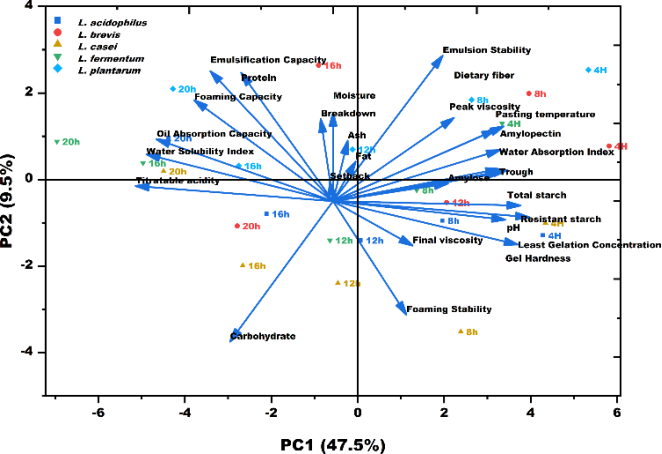
3.6. Principal Component Analysis of Lacto-fermentation Effects on Unripe Banana Flour Properties
PCA (
Figure 6) provided an integrated multivariate view of the system and confirmed a two-dimensional functional gradient governing the fermented flour properties. The eigenvalue of the first two principal components (PC1 and PC2) was able to explain the 57% of the total variance. The PC1 captured the majority of the data variance (47.5%), defining an acidification pre-digestion continuum. High positive loadings on PC1 (
Table 3) were consistently associated with parameters representing native structural integrity (pH, TS, RS, WAI, PV, Hardness). In contrast, strong negative loadings were observed for parameters reflecting metabolic progression and structural collapse (TA, WSI, OAC). Sample profiles demonstrated that incubation time drove a uniform movement toward increasingly negative PC1 scores (e.g.,
L. fermentum shifting from 0.932 at 4 h to −1.943 at 20 h,
Table 4). This shift explicitly quantified the time progressive, shared mechanism of acid mediated starch and cell wall degradation across all inocula
| [23] | Yan, X., et al., A review of the effects of fermentation on the structure, properties, and application of cereal starch in foods. Critical Reviews in Food Science and Nutrition, 2025. 65(12): p. 2323-2342. https://doi.org/10.1080/10408398.2024.2334269 |
[23]
. The PC2 orthogonalized the remaining variance, defining a protein/interfacial functionality axis, characterized by positive loadings for protein content, EC, and ES (
Table 3). This axis separated strains based on their differential capacity for generating surface-active molecules, such as peptides from proteolysis and specific EPS
| [25] | Liu, W., et al., Lactic Acid Bacteria Exopolysaccharides Unveiling Multifaceted Insights from Structure to Application in Foods and Health Promotion. Foods, 2025. 14(5): p. 823.
https://doi.org/10.3390/foods14050823 |
| [52] | García-Moreno, P. J., et al., Recent advances in the production of emulsifying peptides with the aid of proteomics and bioinformatics. Current Opinion in Food Science, 2023. 51: p. 101039. https://doi.org/10.1016/j.cofs.2023.101039 |
[25, 52]
. Strain identity shaped both the magnitude of PC1 progression and the direction of PC2 displacement, clearly illustrating the multivariate strain × time interaction (
Figure 6 and
Table 1).
L. fermentum, the faster acidifier, progressed furthest along the structural degradation axis (PC1 = −1.943), whereas
L. brevis showed the least advancement (PC1 = −0.778), consistent with their kinetic differences. Meanwhile,
L. brevis exhibited a pronounced positive shift on PC2 at 16 h (PC2 = 1.649), contrasting with the generally negative PC2 displacement observed in the other midrange acidifiers. This distinct PC2 behavior suggested a transient, strain specific dominance of EPS biosynthesis or unique peptide release in
L. brevis that significantly modified interfacial functionality independently of the bulk structural breakdown along PC1
| [64] | Wang, Y., et al., Synthesis in situ of heteropolysaccharide by LeviLactobacillus brevis AM7 during fermentation of oat and hemp and its effect on the techno-functional properties of oat yogurt type model. Food Hydrocolloids, 2024. 147: p. 109416. https://doi.org/10.1016/j.foodhyd.2023.109416 |
[64]
.
Table 2. Fermentation kinetics of lactic acid bacteria strains in unripe banana flour: acidification parameters and rheological properties.
Strain | t(pH=4.0) (h) | Early acidification rate ΔpH/Δt (4–8 h) (h⁻¹) | % Drop in gel hardness (4→20 h) | ΔPeak viscosity (20−4) (cP) | ΔSetback (20−4) (cP) |
Lactiplantibacillus plantarum | 16.20±0.21d | −0.11±0.02b | 12.20±2.23a | −163.00±17.04c | 23.00±16.07a |
Lactobacillus acidophilus | 19.30±2.01b | −0.12±0.03c | 9.80±0.82b | −115.00±15.03a | 3.00±26.05c |
Lacticaseibacillus casei | 17.70±0.22c | −0.13±0.04d | 8.00±3.71d | −117.00±25.06b | −6.00±34.08d |
Limosilactobacillus fermentum | 15.10±0.24e | −0.15±0.05e | 9.50±1.72c | −170.00±18.09d | 6.00±20.10b |
Levilactobacillus brevis | 20.00±0.15a | −0.08±0.01a | 5.10±2.41e | −191.00±19.11e | −22.00±28.12e |
Means in the same column with different low-case letter are significantly different at p < 0.05 (Tukey-Test)
Notes: t(pH) = 4.0 estimated by linear interpolation; “NR (>20 h)” indicates the threshold was not reached within the sampling window. Early ΔpH/Δt computed over 4–8 h per strain.% hardness drop = [(Hardness 4 h – Hardness 20 h)/Hardness 4 h]×100. ΔPeak and ΔSetback are 20 h − 4 h differences in Rapid Visco Analyser (RVA) indices (cP). Abbreviations: RVA, Rapid Visco Analyser; cP, centipoise.
Figure 6. Principal component analysis (biplot) of properties of unripe banana flour.
Table 3. Loadings of the first two principal components of the properties of unripe banana flour.
Flours properties | PC1 | PC2 |
Proximate properties | | |
Moisture | 0.000 | 1.336 |
pH | 1.929 | -0.242 |
Titratable acidity | -1.943 | 0.228 |
Ash | 0.144 | 0.912 |
Protein | -0.904 | 1.936 |
Carbohydrate | -1.014 | -2.120 |
Dietary fiber | 1.190 | 1.256 |
Fat | 0.222 | 0.595 |
Starch properties | | |
Resistant starch | 1.846 | -0.067 |
Amylose | 1.131 | 0.267 |
Amylopectin | 1.643 | 0.770 |
Total starch | 1.712 | 0.464 |
Functional properties | | |
Water solubility index | -1.836 | 0.705 |
Water absorption index | 1.635 | 0.485 |
Least gelation concentration | 1.818 | -0.654 |
Emulsification Capacity | -1.207 | 1.961 |
Emulsion stability | 1.078 | 2.195 |
Foaming capacity | -1.367 | 1.524 |
Foaming stability | 0.722 | -1.712 |
Oil absorption capacity | -1.737 | 0.932 |
Texture and pasting properties | | |
Peak viscosity | 1.679 | 1.126 |
Breakdown | -0.121 | 1.239 |
Trough | 1.634 | 0.422 |
Final viscosity | 0.783 | -0.671 |
Setback | -0.031 | 0.297 |
Gel Hardness | 1.695 | -0.279 |
Pasting temperature | 1.597 | 1.076 |
Table 4. Loadings of score label of the first two principal components of the properties of unripe banana flour.
Strain | PC1 | PC2 |
L. plantarum | | |
L. plantarum-4h | 1.489 | 1.583 |
L. plantarum-8h | 0.735 | 1.150 |
L. plantarum-12h | -0.034 | 0.434 |
L. plantarum-16h | -0.769 | 0.198 |
L. plantarum-20h | -1.194 | 1.309 |
L. acidophilus | | |
L. acidophilus-4h | 1.196 | -0.806 |
L. acidophilus-8h | 0.546 | -0.592 |
L. acidophilus-12h | 0.018 | -0.876 |
L. acidophilus-16h | -0.590 | -0.494 |
L. acidophilus-20h | -1.222 | 0.599 |
L. casei | | |
L. casei-4h | 1.212 | -0.628 |
L. casei-8h | 0.666 | -2.195 |
L. casei-12h | -0.128 | -1.496 |
L. casei-16h | -0.743 | -1.242 |
L. casei-20h | -1.254 | 0.118 |
L. fermentum | | |
L. fermentum-4h | 0.932 | 0.810 |
L. fermentum-8h | 0.381 | -0.152 |
L. fermentum-12h | -0.179 | -0.876 |
L. fermentum-16h | -1.387 | 0.238 |
L. fermentum-20h | -1.943 | 0.548 |
L. brevis | | |
L. brevis-4h | 1.623 | 0.483 |
L. brevis-8h | 1.106 | 1.241 |
L. brevis-12h | 0.574 | -0.333 |
L. brevis-16h | -0.254 | 1.649 |
L. brevis-20h | -0.778 | -0.669 |