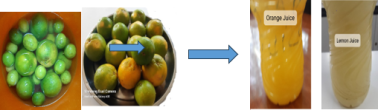
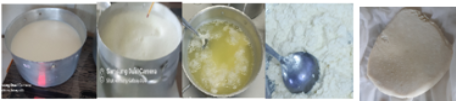
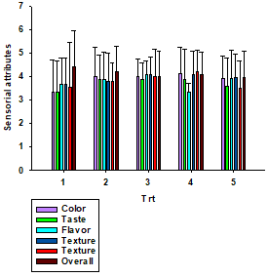
1. Introduction
Dairy products constitute a significant source of daily nutrients for human consumption
[15] | A. Haug, A. T. Hostmark, O. M. Harstad, Bovine milk in human nutrition, A review. Lipids Health Dis. 6, 1–25. 2007. |
[28] | C. M. Weaver, Role of dairy beverages in the diet. Physiol. Behav. 100, 1, 63–66, 2010. |
[15, 28]
and are highly recommended as part of a healthy and balanced diet
[18] | D. Kim, G. Thomas, R. Ulrich, D. Nutter, F. Milani, Life cycle assessment of cheese manufacturing in the United States, in: Proceedings of the 9th International conference on life cycle assessment in the agri-food sector. Lca food 2014, 8-10 October San Francisco, pp. 634–640, 2014. |
[18]
. Especially cheese is among a typical dairy product that produced by processing the milk. However, flavored cheese is the most important food product throughout the world. Considering the decrease production of milk in the world due to the milk producer to fulfilled the demand of the consumer. Enhancing the vitamin content of the cheese, fruit flavored developed cheese is found good acceptance in the consumer.
Dairy products, including milk, yogurt and cheese, are generally considered nutrient-dense foods that contain proteins, calcium, and other essential nutrients such as magnesium, potassium, phosphorus, zinc, and B vitamins and their intake is associated with higher diet quality
[22] | AM. Rangan, VM. Flood, G. Denyer, K. Webb, GB. Marks, TP. Gill, Dairy consumption and diet quality in a sample of Australian children. J Am Coll Nutr.; 31: 185–193, 2012. https://doi.org/10.1080/07315724.2012.10720026 |
[12] | VL. Fulgoni III, DR. Keast, N. Auestad, EE. Quann, Nutrients from dairy foods are difficult to replace in diets of Americans: food pattern modeling and an analyses of the national health and nutrition examination survey 2003–2006. Nutr Res.; 31: 759–765, 2011. https://doi.org/10.1016/j.nutres.2011.09.017 |
[22, 12]
.
Nowadays researchers have been given great attention on use of phenolic compounds extracted from fruit due to the human health benefits and functional properties of dairy products such as processed cheese
[21] | J. E. O’Connell and P. F. Fox, Significance and applications of phenolic compounds in the production and quality of milk and dairy products: A review. Int. Dairy J. 11: 103–120, 2001. |
[6] | Y. Chen, X. Lu, F. Ren, and S. Chen, Research on green tea processed cheese. Food Sci. Technol. (Campinas.) 11: 10–34, 2009. |
[21, 6]
. Phenolic compounds have been extracted from a variety of plant sources and used as ingredients in food matrices
[2] | M. Boroski, H. J. Giroux, H. Sabik, H. V. Petit, J. V. Visentainer, P. T. Matumoto-Pintro, and M. Britten, Use of oregano extract and oregano essential oil as antioxidants in functional dairy beverage formulations. LWT Food Sci. Technol. (Campinas.) 47: 167–174, 2012. |
[2]
. Dietary intake of polyphenols can protect oxidative stress such as cancer, cardiovascular, inflammatory and neurodegenerative diseases
[16] | D. Hervert-Hernández, C. Pintado, R. Rotger, and I. Goñi, Stimulatory role of grape pomace polyphenols on Lactobacillus acidophilus growth. Int. J. Food Microbiol. 136: 119–122, 2009. |
[5] | V. S. Chedea, C. Braicu, and C. Socaciu, Antioxidant/prooxidant activity of a polyphenolic grape seed extract. Food Chem. 121: 132–139, 2010. |
[16, 5]
. In this experiment the cheese can be enriched with phenolic compound by increasing the concentration of the fruit.
Regarding fruit is playing major role for the nutritional and sensory characteristics of the food product. Moreover, fruit is vital source of micronutrients such as magnesium, copper, phosphors, potassium and vitamins (B, C, E) and etc. Generally, the application of fruit is essential to improve the quality of cheese.
However, there is no adequate research work has been conducted in the development of fruit flavored cheese. Therefore, the aim of this study was to evaluate different proportion of fruit flavored cheese physicochemical properties and sensory attributes of the product.
2. Material and Methods
2.1. Experimental Materials
A total of 20 liters of milk were brought from Holeta Agricultural Research Center, dairy farm. Two types of fruit such as lemon and orange were purchased from Holeta fruit shops. Additional important materials such as digital stove, dish, measuring cylinder, distilled water, knife, spoon, manual fruit juice squeezer, plastic bottle, plastic container, muslin clothes, paper towel, bucket, cheese presser, aluminum foil, sterilized plastic packaging were used from the laboratory.
Figure 1. Fruit juice preparation for the experiment.
2.2. Fruit Juice Preparation
The fruits were promptly transported to the laboratory and initially subjected to a gentle washing process with cold water. This was done to reduce the fruit's temperature and minimize the surface microbial load. Subsequently, the fruits were washed again, with warm water at temperature of 37°C. Then the fruits manually peeling the fruits' skin using knives. Finally, the fruits were squeezed with a conventional kitchen juice squeezer to prepare the juice as shown in
Figure 1. The extracted orange juice was filtered through a muslin cloth, to remove the suspended solid particle, and then used in the experiments
.
2.3. Flavored Cheese Preparation
Fresh cow milk was pasteurized at 85°C for 15 min, and cooled to 32°C separately. Vinegar with orange was added in different proportion as a coagulant at a temperature of 75°C and allowed to curd the milk with constant and gentle stirring until coagulation takes place completed for 30min. The curd was allowed to settle for 5 minutes and the whey was drained with a muslin cloth. Then the curd was pressed for 20 minutes at room temperature to get cheese. Then the curds were packed in a container again and left in the press using local material in order to remove the water in the cheese overnight. Following the completion of the pressing process, samples were removed from the pressing cloth as shown in
Figure 2. Preparation of flavored cheese was made with some modification using the method described by
[19] | J. B. Lawlor, C M. Delahunty, MG. Wilkinson, J. Sheehan, Relationships between the sensory characteristics, neutral volatile composition and gross composition of ten cheese varieties. Lait, 81, 487–507, 2001. |
[19]
.
Figure 2. Cheese preparation process for the experiment.
2.4. Treatments
A total of five treatments were prepared using 4 liters of milk for each. Fruit Flavored cheese were comprised of fruit juice and cheese. The combination of the different components was done by using Design-Expert statistical software version 13.0 from Stat-Ease Inc.
Table 1. Treatment combinations.
Treatments | Blending levels (%) |
1 | 3% fruit Juice and 97% cheese |
2 | 6% fruit Juice and 94% cheese |
3 | 9% fruit Juice and 91% cheese |
4 | 12% fruit Juice and 88% cheese |
5 | 100% cheese (Control) |
2.5. Physicochemical Properties of Cheese
2.5.1. Determination of pH Value
Ten gram (10 g) of
flavored cheese sample was mixed with 90 ml of neutralized distilled water using NaOH. Then, the pH of the
cheese was measured by dipping glass electrode (E-201-9) of a digital pH meter (PHS-3C, China) into the sample after a proper calibration of standard buffer solution of pH 4 and 7 according to the methods
[1] | AOAC, “Association of official and analytical chemists”, in Official Method of Analysis of the Association of Analytical Chemists, 18th ed. AOAC, Washington, DC, USA, 2005. |
[1]
.
2.5.2. Titratable Acidity
Ten gram (10 g) of
flavored cheese was used in duplicate and each sample was homogenized in 90 ml of sterile distilled water and titrating the sample with a standard base (0.1 M NaOH) to the phenolphthalein endpoint. From the diluted sample, 10ml of supernatant of the solution was taken and each sample was titrated with 0.1 N standard solution of NaOH, after addition of three drops of 1% of phenolphthalein indicator. As the color of the sample was changed to flint pink, the volume of NaOH consumed until end point reached and was used to calculate the titratable acidity and expressed in terms of the predominant organic acid. The titratable acidity of
flavored cheese was determined by
[3] | R. Bradley, E. Arnold, D. Barbano, R. Semerad, D. Smith & B. Vines, Chemical and physical methods. In Standard Methods for the Examination of Dairy Product, (Ed. R Marshall), Washington, DC: American Public Health Association (APHA). pp. 433–532, 1993. |
[3]
.
Where N is the ml of 0.1N NaOH;
90 is milliequivalent factor;
ml= volume of the sample.
2.5.3. Moisture Content
Three grams of
flavored white cheese sample in a clean dry crucible were placed in an oven drying at 105°C for 3 hr. After oven drying the crucible was removed and allowed to cool in a desiccator to maintain the sample temperature to room temperature for 30 minute and weighed. The moisture content was calculated by the formula is described by
[1] | AOAC, “Association of official and analytical chemists”, in Official Method of Analysis of the Association of Analytical Chemists, 18th ed. AOAC, Washington, DC, USA, 2005. |
[1]
.
Where: W1 =Weight of crucible or empty crucible (g)
W2= Weight of crucible + sample before drying (g)
W2-W1= Weight of sample (g)
W3= Weight of crucible + sample after drying (g)
W2-W3= loss of weight (g)
2.5.4. Ash Content
Three gram of oven dry flavored cheese used to measure ash content was placed in muffle furnace at 550°C for about 4 hours. The crucible was then cooled in desiccators and immediately weighed. The ash percentage was calculated by the formula is described by
[1] | AOAC, “Association of official and analytical chemists”, in Official Method of Analysis of the Association of Analytical Chemists, 18th ed. AOAC, Washington, DC, USA, 2005. |
[1]
.
Where: W1 =Weight of crucible or empty crucible (g)
W2= Weight of crucible + sample before drying (g)
W2-W1= Weight of sample (g)
W3= Weight of crucible + sample after muffle furnace (g)
2.5.5. Crude Protein
Half gram (0.5 g) of
flavored cheese was weighed and digested at a temperature of 350°C by adding 10 ml of sulfuric acid with selenium mixture as catalyst for 2 hours. After light green color was observed, the digested solution was cooled and transferred into 100 ml of volumetric flask which was made up to mark with distilled water. Micro Kjeldahl distillation apparatus was used to distill the prepared digest by the addition of 45 ml of 40% sodium hydroxide. The blue color was changed to dark brown as distillation proceeded. The released ammonia was condensed and collected into a receiver containing 30 ml of boric acid with bromogersol green indicator solution. The condensed ammonia was then back titrated with 0.01M HCl to pink color end point. The total nitrogen content of
flavored cheese sample was determined by using the Kjeldahl method
[1] | AOAC, “Association of official and analytical chemists”, in Official Method of Analysis of the Association of Analytical Chemists, 18th ed. AOAC, Washington, DC, USA, 2005. |
[1]
. The crude protein content of
flavored cheese sample was calculated by multiplying the nitrogen content by the factor 6.25.
Where: W is weight of the sample taken for analysis
T is volume of HCl used for titration
B is blank used as control
2.5.6. Crude Fat Content
Three grams of dry flavored white cheese were accurately weighed and added to an extraction thimble, which was subsequently placed in the extraction unit. The flask was connected to a hexane solvent, which was filled to approximately two-thirds of the total volume, and the extraction process was allowed to proceed for a duration of six hours. Upon completion, the hexane solvent was evaporated either through distillation or by employing a Rota evaporator. The resulting flasks were then cooled in a dryer and reweighed to determine the final mass
[1] | AOAC, “Association of official and analytical chemists”, in Official Method of Analysis of the Association of Analytical Chemists, 18th ed. AOAC, Washington, DC, USA, 2005. |
[1]
.
2.5.7. Mineral Content
The contents of Ca, Fe, Zn, P and Mg of each sample was measured by using Atomic Absorption Spectrophotometer (Agilent AAS series 200, USA) according to the method
[1] | AOAC, “Association of official and analytical chemists”, in Official Method of Analysis of the Association of Analytical Chemists, 18th ed. AOAC, Washington, DC, USA, 2005. |
[1]
. A 0.5 g of grinded white cheese samples were weighed. The samples were ashed at 550°C for 4hrs in muffle furnace. The resulting white ash was weighed after cooling the ashed samples was dissolved and mixed with 2.5 ml 36% of HCL and 2.5ml distilled water in a 100 ml calibrated flask. Then the digested sample was filtered using 125 mm whatman filter paper and also marked with 100 ml volumetric flask. The aliquot was measured using AAS.
2.6. Sensory Evaluation
Sensory attributes of the
flavored cheese such as color, taste, flavor, odor, texture and overall acceptability were evaluated every for weeks interval by using five-point hedonic scale (i.e 5=like very much, 4= like moderately, 3= neither like nor dislike, 2= dislike moderately, 1= dislike very much for each attribute. Fifteen semi-trained panelists have tested the sensory attributes according to the method described by
[25] | H. Stone, J. L. Sidel, Sensory evaluation practices: Academic Press, Florida, 2004. |
[25]
.
2.7. Statistical Data Analysis
The physicochemical and Sensory attributes data were analyzed by using SAS (version 9.0) and SPSS statistical package program (SPSS, Inc., Chicago, IL, USA) Version 25 respectively. Analysis of variance was performed by using one way ANOVA at 95% confidence interval and 5% level of significance. The experiment was designed in completely randomized design (CRD) with replications. The data was analyzed using the following model: Yi= µ + xi + ei; Where, Yi = response variable; µ = overall mean; xi = effect of treatment; ei = random error associated with each observation.
3. Results and Discussion
3.1. Physicochemical Properties of Flavored Cheese
Table 2 revealed that the results of the determination of the physicochemical properties of pH, acidity, moisture, ash, protein and fat values among the five treatments. The present study shown that there were significant difference (P<0.05) of pH, moisture, ash and fat respectively. In terms of pH values, the overall mean of pH value of fruit flavored cheese was 5.87%. The maximum mean score of pH was 6.04 ± 0.06 for T4 (12% flavored cheese) and the minimum mean score of pH was of 5.68 ± 0.06 for T3 (9% flavored cheese) respectively as presented in
Table 2. The present finding in line with the work of
[7] | HY. Choi, CJ. Yang, KS. Choi and B. Inhyu, Characteristics of Gouda cheese supplemented with fruit liquors. Journal of Animal Science and Technology, 57: 15, 2015. https://doi.org/10.1186/s40781-015-0048-2 |
[7]
reported that the addition of fruit liquor increases the pH of white cheese. But it is disagreed with the work of
[23] | K. Razig, N. Babiker, Chemical and microbiological properties of Sudanese white soft cheese made by direct acidification technique. Pakistan Journal of Nutrition, Vol. 8, No. 8, 1138-1143, 2009. |
[23]
reported that the highest pH-value (3.74) was recorded by adding grapefruit juice; other values got less 3.48 and 3.28 for orange and lemon, respectively. Moreover, the work of
[17] | C. Irma, S. Sergio, F. Lucía, GM. Néstor, GI. Briselda, MG. Karol, M. Javier, Compositional, Functional and Sensory Characteristics of Selected Mexican Cheeses. Journal of Food and Nutrition Sciences, 5, 366-375, 2014. |
[17]
reported that the pH values of Swiss cheeses were in between 5.0 and 5.4. This may be due to the flavored cheese formulations contribute the alterations in pH levels. Regarding the moisture, the overall mean of moisture content of flavored cheese was 3.89%. The maximum mean score of moisture content was 3.76±0.21 for T2 (6% flavored cheese) and the minimum mean score of moisture content was 3.25± 0.22 for T3 (9% flavored cheese) respectively (
Table 2). The result of the present finding similar with the work of
[9] | FS. Denise, T. MP. Paula, B. Laurent, C. Charles and B. Michel, Effect of commercial grape extracts on the cheese-making properties of milk. J. Dairy Sci. 98: 1–11, 2015. |
[9]
reported that increasing the concentration of graph extract, which result in the cheese with a higher moisture content. have significant effect on the cheese. It may be due to the addition of fruit contribute to improve the moisture content of the cheese. In case of percentage of ash content, the overall mean percentage of ash in fruit-flavored cheese was found to be 9.75%. The maximum mean score of ash content was 11.55 ± 0.01% for the control and the minimum mean score of ash content was 9.46±0.03 for T2 (6% fruit-flavored cheese) respectively (
Table 2). The present work disagreed with the work of
[24] | BH Song, KS Choi, YD Kim, Changes of physicochemical and flavor components of Ume according to varieties and picking date. Kor J Postharvest Sci Technol.; 4: 77–85, 1997. |
[24]
reported that cheese supplemented with fruit contained the highest crude ash than the control. This may be due to the fruit negatively affected on the ash content of the cheese. With respect to the crude fat, the overall mean of percentage of crude fat was 17.54%. The maximum mean score of crude fat was 17.85± 0.21% for T2 (6% fruit flavored cheese) and the minimum mean score of crude fat was 17.00± 0.14% for T3 (9% fruit flavored cheese) respectively (
Table 2). The result of the present study disagreed with the work of
[9] | FS. Denise, T. MP. Paula, B. Laurent, C. Charles and B. Michel, Effect of commercial grape extracts on the cheese-making properties of milk. J. Dairy Sci. 98: 1–11, 2015. |
[9]
reported that the presence of graph extract in the milk had no effect on the fat recovery. This may be due to the fruit can maintain the fat content of the cheese. However, there were not significant difference (P>0.05) of acidity and protein among the five treatments respectively (
Table 2). In terms of acidity the overall mean of acidity of fruit flavored white cheese was 0.05%. In this study acidity did not differ in between treatments (T1, T2, T3, T4 and T5) that is similar mean result of 0.05%. The present finding is disagreed with the work
reported that the addition of blueberry increased the titratable acidity values of white cheese. In this study the addition of fruit did not significantly affect the acidity of white cheese. In case of protein, the overall mean of protein in fruit flavored cheese was 48.44%. The maximum mean of crude protein was 44.53±6.15 for T5 (control) and the minimum mean score of crude protein was 44.53±6.15% for T3 (9% fruit flavored cheese) respectively (
Table 2). The result of the present study agreed with the work of
[9] | FS. Denise, T. MP. Paula, B. Laurent, C. Charles and B. Michel, Effect of commercial grape extracts on the cheese-making properties of milk. J. Dairy Sci. 98: 1–11, 2015. |
[9]
reported that the presence of grape extracts in milk slightly increased the protein recovery of cheese. This may be due to the addition of fruit not affected the protein content of the cheese.
Table 2. Physicochemical properties of fruit flavored white cheese.
Trt | pH | TA% | MC% | Ash% | CP% | CF% |
T1 | 5.91±0.42b | 0.05±0.01a | 2.83±0.23b | 10.95± 0.02b | 47.08±2.72a | 17.45±0.35a |
T2 | 5.80± 0.03b | 0.05±0.00a | 3.76±0.21a | 9.46±0.03d | 51.18±5.51a | 15.10±0.42d |
T3 | 5.68±0.02c | 0.05±0.03a | 3.25±0.22ab | 9.73± 0.02c | 44.53± 6.15a | 17.30±0.14ab |
T4 | 6.04±0.06a | 0.05±0.01a | 3.50±0.23a | 7.06± 0.03d | 45.68± 0.11a | 16.95±0.07bc |
T5 | 5.91± 0.28b | 0.05± 0.00a | 3.60±0.01a | 11.55±0.01a | 53.96±2.27a | 16.40± 0.28c |
P | <0.001 | <0.898 | <0.031 | <0.001 | <0.246 | <0.054 |
Each value is expressed as Mean ± standard deviation (n=2) followed with the same letter(s) within a column are not significantly different (p<0.05) according to Duncan's Multiple Range Test. Trt= Treatment, T1 (3% fruit flavored cheese), T2 (6% fruit flavored cheese), T3 (9% fruit flavored cheese), T4 (12% fruit flavored cheese) and T5 (control), S.D=standard deviation. TA= Titratable acidity, MC= Moisture content, CP= Crude protein and CF= Crude Fat.
3.2. Mineral Composition of Flavored White Cheese
Table 3 revealed that the determination of minerals of flavored white cheese were not significant difference (
P>0.05) of calcium, iron, zinc and potassium except magnesium. With respect to calcium is one of the most important minerals in dairy products. It is the main component of bone tissue, and it actives and inhibits various enzymes. In addition to this, it is necessary for the maintenance of the water electrolyte homeostasis, acid-base balance and for muscle and nerve excitation
[8] | G. Cichosz, & H. Czeczot, Zywieniowy fenomen mleka (1st ed.). Olsztyn: UWM, 2013. |
[8]
. The overall mean of calcium in flavored white cheese was 1472.71 mg/100g. The highest mean score of calcium was 1917.72 ± 238.48 mg/100g for T5 (control) and the lowest mean score of calcium was 1065.75±182.35 mg/100g for T4 (12% flavored white cheese) respectively as presented in
Table 3. The present study in line with the work of
[7] | HY. Choi, CJ. Yang, KS. Choi and B. Inhyu, Characteristics of Gouda cheese supplemented with fruit liquors. Journal of Animal Science and Technology, 57: 15, 2015. https://doi.org/10.1186/s40781-015-0048-2 |
[7]
reported that Calcium content was two-fold higher in the control cheese than in cheese supplemented with wine. It might be due to cheese is rich source of calcium. In case of iron is not an abundant element in milk and dairy products made with cow milk
[10] | A. Flynn, Minerals and trace elements in milk. Adv Food Nutr Res. 36: 209–252. 1992. |
[10]
. Milk and dairy products are considered as very poor sources of Fe, and their contributions to the total Fe intake are very low. The overall mean of iron content in flavored cheese was 3.70 mg/100g. The highest mean score of iron content was 4.61±0.78 mg/100g for T5 (control) and the lowest mean of iron was 1.52± 0.66 mg/100g for T4 (12% fruit flavored cheese) (
Table 3). The previous study stated that 600 mL of milk provides 0.3 mg (i.e., about 2.5% of the recommended daily allowance). The present finding in agreement with the work of
[7] | HY. Choi, CJ. Yang, KS. Choi and B. Inhyu, Characteristics of Gouda cheese supplemented with fruit liquors. Journal of Animal Science and Technology, 57: 15, 2015. https://doi.org/10.1186/s40781-015-0048-2 |
[7]
reported that Gouda cheese supplemented with PM and CO fruit liquor were slightly higher than in the control cheese. With regard to zinc boosts immunity, regulates blood pressure, nerve and reproductive functions, and acts as a cofactor for various enzymes
[8] | G. Cichosz, & H. Czeczot, Zywieniowy fenomen mleka (1st ed.). Olsztyn: UWM, 2013. |
[8]
. The overall mean of zinc in the flavored white cheese was 15.37 mg/100g. The highest mean score of zinc content was 19.70± 5.59 mg/100g for T2 (6% fruit flavored cheese) while the lowest mean score of zinc was 11.68± 1.48 mg/100g for T4 (12% fruit flavored cheese) respectively (
Table 3). The present finding in line with the work of
[10] | A. Flynn, Minerals and trace elements in milk. Adv Food Nutr Res. 36: 209–252. 1992. |
[11] | A. Flynn, K. Cashman, Nutritional aspects of minerals in bovine and human milk. In Fox PF (ed): ‘‘Advanced Dairy Chemistry: Lactose, Water, Salts and Vitamins,’’ Vol 3, 2nd ed. London: Chapman & Hall, pp 257–302. 1997. |
[10, 11]
reported that Milk and dairy products contribute significantly to the zinc supply 600 ml of milk provides 2.4 mg corresponding to about 20% of the recommended daily allowance. In terms of potassium is present in all bodily fluids, and it is required for the healthy functioning of nerves and muscles and Naþ/Kþ ATPase activity. The overall mean of potassium in the flavored cheese was 715.80 mg/100g. The highest mean score of potassium content was 781.51± 74.92 mg/100g and the lowest mean score of potassium was 663.68± 37.55 mg/100g for T1 (3% fruit flavored cheese) respectively (
Table 3). The present finding disagreed with the work of
[17] | C. Irma, S. Sergio, F. Lucía, GM. Néstor, GI. Briselda, MG. Karol, M. Javier, Compositional, Functional and Sensory Characteristics of Selected Mexican Cheeses. Journal of Food and Nutrition Sciences, 5, 366-375, 2014. |
[17]
reported that the result of different types of cheese below as compared with my product. However, there was significant difference (
P<0.05) of magnesium among the five treatments. In this study, the result of the overall mean of magnesium in flavored cheese was 107.39 mg/100g. The highest mean score of magnesium was 125.99± 10.76 mg/100g for T3 (9% fruit flavored cheese) and the lowest mean score of magnesium was 85.77± 7.81 mg/100g) for T4 (12% fruit flavored cheese) respectively (
Table 3). The present finding in line with the work of reported that
[7] | HY. Choi, CJ. Yang, KS. Choi and B. Inhyu, Characteristics of Gouda cheese supplemented with fruit liquors. Journal of Animal Science and Technology, 57: 15, 2015. https://doi.org/10.1186/s40781-015-0048-2 |
[7]
reported that Gouda cheese supplemented with PM and CO fruit liquor were slightly higher than in the control cheese. The human daily recommended allowance of magnesium is about 16% of the dairy products. It might be due to the addition of fruit in the cheese significantly increases the availability of magnesium.
Table 3. Mineral composition of flavored white cheese.
Trt | Ca (mg/100g) | Fe (mg/100g) | Zn (mg/100g) | K (mg/100g) | Mg (mg/100g) |
1 | 1218.63±152.65ab | 4.43±2.75a | 13.32±0.63ab | 663.68± 37.55a | 87.59± 11.82b |
2 | 1449.32±483.94ab | 4.20±2.93a | 19.70±5.59a | 694.46±104.50a | 123.20± 11.84a |
3 | 1712.13±238.48ab | 3.75±1.61a | 15.17±1.46ab | 781.51± 74.92a | 125.99± 10.76a |
4 | 1065.75± 182.35b | 1.52± 0.66b | 11.68±1.48b | 754.38±82.26a | 85.77±7.81b |
5 | 1917.72±27.92a | 4.61± 0.78a | 16.97± 0.78ab | 684.96± 59.57a | 114.39± 6.95a |
P | <0.10 | <0.57 | <0.17 | <0.53 | <0.02 |
Each value is expressed as Mean ± standard deviation (n=2) followed with the same letter(s) within a column are not significantly different (p<0.05) according to Duncan's Multiple Range Test. Trt= Treatment, T1 (3% fruit flavored cheese), T2 (6% fruit flavored cheese), T3 (9% fruit flavored cheese), T4 (12% fruit flavored cheese) and T5 (control), S.D=standard deviation. Ca= Calcium, Fe= Iron, Zn= Zinc, K=Potassium and Mg= Magnesium.
3.3. Sensory Evaluation
Figure 3 revealed that the determination of sensory evaluation among the five treatments with the choice of panelists. In this study there were not significant difference of color, taste, flavor, odor, texture and overall acceptability with five-point hedonic scale. In terms of color, the highest mean score of color was 4.13 ± 1.13 for T4 (12% fruit flavored cheese) and the lowest mean score of color was 3.33 ± 1.40 for T1 (3% fruit flavored cheese) respectively (
Figure 3). The yellow color of cheese may be due to usually β-carotene and related carotenoid compounds
[4] | S. Carpino, J. Horne, C. Melilli, G. Licitra, D. M. Barbano, and P. J. Van Soest, Contribution of Native Pasture to the Sensory Properties of Ragusano Cheese. J. Dairy Sci. 87: 308–315, 2004. |
[4]
. Moreover, the present finding in agreement with the work of
reported that adding blueberry fruit to cheese increases its color value. In case of taste, the highest mean score of taste was 3.87 ± 1.30 for T4 (12% fruit-flavored cheese) and the lowest mean score was 3.33 ± 1.35) for T1 (3% fruit-flavored cheese) respectively (
Figure 3). The present finding in agreement with the work of
[27] | S. Yige, P. Dandan, Z. Xuewei and Z. Yuyu, Recent Progress in the Study of Taste Characteristics and the Nutrition and Health Properties of Organic Acids in Foods. Foods, 11(21), 3408, 2022. https://doi.org/10.3390/foods11213408 |
[27]
reported that the organic acid such as citric fruit contributes for the taste of cheese. It may be due to addition of fruit to cheese made improve taste preference. Regarding flavor, Treatment 3 (9% fruit-flavored cheese) demonstrated the highest flavor value, with a mean score of (4.07 ± 0.59) and T4 (12% fruit-flavored cheese) displayed the lowest flavor value, with a mean score of (3.35 ± 0.35) as shown in
Figure 3. The present finding in line with the work of
[19] | J. B. Lawlor, C M. Delahunty, MG. Wilkinson, J. Sheehan, Relationships between the sensory characteristics, neutral volatile composition and gross composition of ten cheese varieties. Lait, 81, 487–507, 2001. |
[19]
reported that the free fatty acid known to contribute the cheese flavor. It may be due to fat fraction of cheese is significant for the development of flavor. In terms of odor, T 3 (9% fruit-flavored cheese) was perceived to have the most pleasant odor, with a mean score of (4.20 ± 0.77 as compared with the control had the least favorable odor, with a mean score of (3.67 ± 1.05) observed in
Figure 3. The present finding in agreement with the work of
[14] | Z. C. Hardy, H. Kailyn and A. B. Sheryl, Swiss Cheese Flavor Variability Based on Correlations of Volatile Flavor Compounds, Descriptive Sensory Attributes, and Consumer Preference. Foods, 8(2), 78; 2019. https://doi.org/10.3390/foods8020078 |
[14]
reported that lactone contributes for fruity notes for swiss cheese. It may be due to the fruity odor cheese shown better its sensory acceptability. With respect to texture, T2 (6% fruit flavored white cheese) exhibited the highest texture value, with a mean of 4.20 ± 1.08 as compared with the control (T1) that displayed the lowest texture value, with a mean of 4.53 ± 1.55. Based on texture, the majority of the treatments were rated as moderately satisfactory mentioned in
Figure 3. The present finding in agreement with the work of
[19] | J. B. Lawlor, C M. Delahunty, MG. Wilkinson, J. Sheehan, Relationships between the sensory characteristics, neutral volatile composition and gross composition of ten cheese varieties. Lait, 81, 487–507, 2001. |
[19]
reported that the texture attributes was positively correlated with the protein of the cheese. It may be due to availability of protein in the cheese to enhance the product's texture. The overall sensory acceptability of fruit flavored white cheese was no statistically significant difference
(P>0.05) across the treatments. In terms of overall acceptability, the treatment T3 (9% fruit flavored cheese) exhibited the highest value, with a mean of 4.00 ± 0.51 when compared with the control had the lowest value of overall acceptability, with a mean of 3.50 ± 1.07. All of the treatments received a partial liking of "very much” as illustrated in
Figure 3. The findings of this study indicate that the inclusion of fruit improves the acceptance of the cheese. The present finding in agreement with the work of
[20] | R. Malaka, W. Hatta and S, Baco, Properties and Microstructure of Dangke Fresh Cheese Made with Passion Fruits Juice as Coagulant. International Journal of Agriculture Innovations and Research. Vol. 5, Issue 4, ISSN (Online) 2319-1473, 2017. |
[20]
reported that passion fruits juice with cheese influence overall acceptance between 7.5% and 10%.
Figure 3. Graph of sensorial attributes of flavored white cheese.
Author Contributions
Nesru Zeynu: Conceptualization, Data curation, Formal Analysis, Funding acquisition, Investigation, Methodology, Project administration, Resources, Software, Supervision, Validation, Visualization, Writing – original draft, Writing – review & editing
Yadesa Abeshu: Conceptualization, Data curation, Formal Analysis, Funding acquisition, Investigation, Project administration, Supervision, Validation, Visualization
Zerihun Asefa: Conceptualization, Data curation, Formal Analysis, Funding acquisition, Investigation, Methodology, Validation, Visualization, Writing – review & editing
Esayas Abrha: Conceptualization, Data curation, Formal Analysis, Funding acquisition, Investigation, Methodology, Validation, Visualization