1. Introduction
As online information continues to grow at a fast rate, users are faced with a large amount of data to filter through. This excessive information overload results in an increasing demand for efficient ways to filter, rank, and deliver the most relevant information to users. Businesses are starting to rely on new technologies and strategies to help manage huge amounts of data more efficiently
| [1] | K. Ong, S.-C. Haw and K.-W. Ng, "Deep Learning Based-Recommendation System: An Overview on Models, Datasets, Evaluation Metrics, and Future Trends," in The 2nd International Conference on Computational Intelligence and Intelligent Systems, 2019. https://doi.org/10.1145/3372422.3372444 |
[1]
. There are a variety of ways to facilitate the information seeking process and finding an efficient solution for managing information overload is becoming significant
.
In recent years, recommender systems have become increasingly popular for handling the challenge of information load
; Recommender systems are specifically designed to sift through vast amounts of data in order to identify the most pertinent and valuable information for users (Liling, 2019). As these systems have become increasingly prevalent, they now hold a crucial role in shaping our everyday experiences
by providing users with customized recommendations that align with their unique preferences, these systems empower individuals to save time and make well-informed decisions with greater efficiency
| [5] | P. K. Singh, P. K. D. Pramanik, A. K. Dey and P. Choudhury, "Recommender Systems: An Overview, Research Trends, and Future Directions," International Journal of Business and Systems Research, vol. 15, p. 40, 2021. https://doi.org/10.1504/IJBSR.2021.10033303 |
[5]
.
Many recommendation systems operate on the principle that users who exhibit similar preferences and behavior can serve as a basis for making recommendations to other users. This approach, known as collaborative filtering (CF), forms the foundation of such recommendations. However, traditional collaborative filtering methods often overlook the sequential order in which products are purchased. As the number of users and items grows, Collaborative Filtering algorithms encounter challenges in terms of scalability. With millions of customers and items to consider, the complexity of these algorithms becomes unmanageable
| [6] | M. Madhukar, "Challenges & Limitation in Recommender Systems," International Journal of Latest Trends in Engineering and Technology (IJLTET), p. 5, 2014. |
[6]
.
Over the past two decades, recommender systems have undergone significant evolution, incorporating the concepts of Artificial intelligence, Information retrieval, and Human-computer interaction, thereby becoming more efficient and gaining more popularity
| [7] | A. Kumar and A. Sharma, "Alleviating Sparsity and Scalability Issues in Collaborative Filtering Based Recommender Systems," in Proceedings of the International Conference on Frontiers of Intelligent Computing: Theory and Applications (FICTA), Berlin, 2013. https://doi.org/10.1007/978-3-642-35314-7_13 |
[7]
. Nevertheless, with the exponential growth of available data, it has become increasingly challenging for recommendation systems to consistently provide accurate predictions. Moreover, with the expansion of e-commerce platforms, social media, and other online services, user interests and behavior have become less predictable. These factors make it difficult for traditional recommender systems, which rely on basic data analysis techniques and a limited set of features, to generate accurate predictions. To address these challenges, contemporary recommendation systems integrate cutting-edge techniques like deep learning, natural language processing, and graph analysis into their recommendation algorithms. By leveraging these advanced methods, the system can generate more precise recommendations that take into account the contextual aspects of user behavior and the interconnections between various items
| [8] | Q. Zhang and Y. Jin, "Artificial intelligence in recommender systems," Complex & Intelligent Systems, p. 19, 2020. https://doi.org/10.1007/s40747-020-00212-w |
| [9] | P. Castellsa and D. Jannach, "Recommender Systems: A Primer," in Advanced Topics for Information Retrieval, Madrid, 2023. |
[8, 9]
.
The inclusion of temporal information from users' past usage records is a critical factor for achieving accurate predictions in recommender systems. This is due to the fact that the impact of past purchases and recently acquired items can fluctuate, directly influencing the user's present preferences. To incorporate this behavior, more advanced techniques, such as session-based recommendation and sequential modeling, which consider the order of user purchases to generate more accurate suggestions, can be used. Recurrent Neural Networks (RNNs) have demonstrated their effectiveness in recommendation systems. RNNs, being a type of deep learning algorithm, excel at analyzing sequential data, enabling them to capture temporal information in users' histories. This capability is particularly valuable in scenarios where users' interests and preferences evolve over time
| [10] | S. Zhang, L. YAO, A. SUN and Y. TAY, "Deep Learning Based Recommender System: A Survey and New Perspectives," in ACM Computing Surveys, 2018. https://doi.org/10.1145/3285029 |
[10]
. Among the various RNN architectures, the most frequently employed ones are the Long Short-Term Memory (LSTM) and Gated Recurrent Unit (GRU)
. However, while some Recurrent Neural Network (RNN) models do consider the repeated behavior of users, these models often lack precision in the exact timing for recommending repeated items.
Over the past few years, there has been a notable rise in the popularity of probabilistic models for developing recommendation systems that deliver personalized recommendations to users. These models excel at capturing the repetitive patterns observed in purchasing behavior, as they can effectively handle the uncertainty and randomness inherent in customer behavior. Leveraging these probabilistic models provides valuable insights into customers' recurring purchasing patterns. Moreover, these models can also consider the timing of purchases, which plays a vital role in accurately modeling repetitive purchase behavior
| [12] | P. S. Fader, B. G. S. Hardie and K. L. Lee, "RFM and CLV: Using Iso-value Curves for Customer Base Analysis," Journal of Marketing Research, vol. 42, no. 4, p. 40, 2005. https://doi.org/10.1509/jmkr.2005.42.4.415 |
[12]
. The Modified Poisson Gamma Model (MPG) is an advanced probabilistic model used in e-commerce to predict repeat purchases. By taking into account the customer's purchase history and specific time intervals, the MPG model produces precise and personalized recommendations. It calculates the customer's buying frequency for each product within a given timeframe, enabling the estimation of the probability of repeat purchases. Moreover, the model considers variations in purchase behavior across different customers and products by estimating shape and rate parameters for the Poisson and Gamma distributions
| [13] | T. Neifer, D. Lawo, G. Stevens, A. Boden and A. Gadatsch, "Recommender Systems in Food Retail: Modeling Repeat Purchase Decisions on Transaction Data of a Stationary Food Retailer," in 18th International Conference on e-Business, 2021. https://doi.org/10.5220/0010553600002997 |
[13]
. However, the Modified Poisson Gamma model alone may not effectively capture the pattern of customer purchasing behavior over time. In contrast, LSTMs excel in modeling such behavior. Therefore, integrating the Modified Poisson Gamma model with LSTMs could enhance the ability of recommender systems to model users' purchasing patterns while also taking into consideration the precise timing of purchases.
The objective of the research presented in this paper is to enhance the quality of recommendations for the next basket of items. The study proposes a novel approach for next basket recommendation by combining LSTM with an enhanced version of the Modified Poisson Gamma (MPG) model introduced by Bhagat et al. The Enhanced Modified Poisson Gamma (EMPG) model aims to enhance the capabilities of the original MPG model by introducing two additional parameters. The first parameter, known as the appearance rate, takes into account the frequency at which a specific product is purchased across a customer's orders. Additionally, the appearance rate across all customers is incorporated as a second parameter, as it provides insights into the product's overall popularity among all customers. A change is also made to the MPG model to focus on the customer purchase frequency and time signal as the main parameters in calculating the probability of the product being purchased. The probabilities for other parameters are summed and the sum compared to a threshold. If the sum exceeds the threshold, a factor is added to the probability resulting from the LSTM prediction score for the product
| [14] | R. Bhagat, S. Muralidharan, A. Lobzhanidze and S. Vishwanath, "Buy It Again: Modeling Repeat Purchase Recommendations," Applied Data Science Track Paper, p. 9, 2018. https://doi.org/10.1145/3219819.3219891 |
[14]
.
The remaining sections of the paper are structured as follows: Section 2 presents an overview of the relevant research in the recommendations domain. Within this section, two approaches are examined: Sequential-based Recommendations (Section 2.1) and Statistical-based Recommendations (Section 2.2). Section 3 presents the proposed methodology. A detailed explanation of the execution process is provided, which includes Baskets Preparation, Long Short-Term Memory (LSTM), and the Enhanced Modified Poisson Gamma Model (EMPG). Moving on to Section 4, the experiments conducted, and the results obtained are described. This section is further divided into three subsections: Research Questions (Section 4.1), Experimental Setup (Section 4.2), and Dataset Analysis (Section 4.3). In the Dataset Analysis subsection, various aspects are examined, such as Baskets Per User, Variations in Time Intervals between Baskets for all Users, Product Time Interval for Individual Users and all Users, Product Purchase Frequency for Individual Users and all Users, and Product Time signal for Individual Users. Section 5 is dedicated to discussing the results obtained from the experiments and providing insightful analysis. Finally, in Section 6, the conclusion of the study is presented and potential avenues for future work are outlined.
2. Related Work
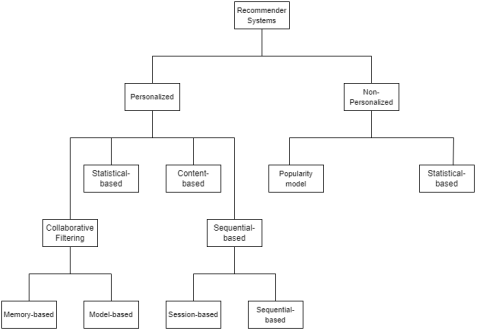
This section presents a review of research in recommender systems, which can be classified into personalized and non-personalized systems as shown in
Figure 1. Personalized recommender systems include collaborative, content-based, hybrid, sequential, and specific types of statistical models. Non-personalized recommender systems include popularity-based models and other types of statistical models. Under personalized models the collaborative filtering models focus solely on the appearance of items within a given context, discarding the order in which items are purchased, and the content-based models make recommendations which are similar to the items which have been purchased previously by the user. Under non-personalized models the popularity model recommends items based on the popularity of the items among all users. As a consequence, these models exhibit poor performance when attempting to predict the contents of a user's next purchase. That leaves sequential-based recommendations and statistical-based recommendations. Section 2.1 reviews research on sequential-based recommendations and section 2.2 reviews research on statistical-based recommendations.
Figure 1. Recommender System Types.
2.1. Sequential-Based Recommendations
Recommendation systems that follow a sequential approach generate recommendations by analyzing the user's historical sequential data
Sequential recommender systems can be classified into two main types: session-based recommender systems and sequential pattern-based recommender systems. Session-based recommender systems primarily focus on short-term user behavior, such as a single session or a visit to a website or app. These systems analyze the sequence of items viewed or interacted with by the user during the session and generate recommendations for the set of items that the user is likely to purchase
| [15] | S. Wang, Q. Zhang, L. Hu, X. Zhang, Y. Wang and C. Aggarwal, "Sequential/Session-based Recommendations: Challenges, Approaches, Applications and Opportunities," in Association for Computing Machinery, Madrid, 2022. https://doi.org/10.1145/3477495.3532685 |
[15]
. However, session-based recommendation models typically do not take into account the user's complete purchase history. To address this limitation, Wang et al. proposed a time-aware neural attention network for modeling dynamic user preferences in session-based recommendations. They constructed a global session graph based on all sessions and employed a graph neural network to learn item embeddings. Next, a GRU (Gated Recurrent Unit) was used to refine the item embeddings and capture the user's overall interests based on the current session. Additionally, a unique time-aware neural attention network was utilized to model the user's primary objectives throughout the session. Finally, the user's general interests and primary objectives were combined to determine their preferences, which were then used to generate personalized recommendations. The results of the experiments conducted in the study demonstrated that the proposed method outperformed several session-based recommendation methods, including TiSASRec, STAN, and FGNN, with P@k of 51.75 and MRR@k of 18.17
.
Sequential pattern-based recommender systems focus on capturing the long-term behavior of users. These systems analyze the sequential patterns in user behavior and identify recurring or notable patterns, such as user preferences or item associations, to generate recommendations. Sequential recommender systems prove to be effective in scenarios where the order of item purchase or interaction is meaningful
| [10] | S. Zhang, L. YAO, A. SUN and Y. TAY, "Deep Learning Based Recommender System: A Survey and New Perspectives," in ACM Computing Surveys, 2018. https://doi.org/10.1145/3285029 |
[10]
, such as in e-commerce, music, video streaming
| [17] | D. AFCHAR, A. B. MELCHIORRE and M. SCHEDL, "Explainability in Music Recommender Systems," in Johannes Kepler University and Linz Institute, Linz, 2022. https://doi.org/10.1002/aaai.12056 |
[17]
, and social services
| [18] | B. Choe, T. Kang and K. Jung, "Recommendation System With Hierarchical Recurrent Neural Network for Long-Term Time Series," in Department of Electrical and Computer Engineering, Seoul, 2021. https://doi.org/10.1109/ACCESS.2021.3079922 |
[18]
. These types of recommender systems are also referred to as time-dependent recommender systems
.
Donkers et al. proposed a model that combines matrix factorization with Markov Chains to capture the sequential patterns in user behavior. This model, known as the Factorizing Personalized Markov Chains (FPMC) model, aims to predict the likelihood of a user selecting a specific item for their next purchase based on their previous purchase history and the items currently in their basket. The authors utilized matrix factorization to learn latent representations of users and items, which were then integrated with personalized Markov Chains to model the sequential dependencies in user behavior. The performance of the FPMC model was evaluated using two real-world datasets: anonymized purchase data from an online drug store and a dense subset of the 10-core dataset. The results were compared against common matrix factorization and unpersonalized Markov Chain model. While the model showed promising results, it can only model the local sequential behavior between the previous basket and the current basket
| [20] | S. Rendle and C. Freudenthaler, "Factorizing Personalized Markov Chains for Next-Basket Recommendation," in International World Wide Web Conference, North Carolina, 2010. https://doi.org/10.1145/1772690.1772773 |
[20]
.
An approach where identity-based user embeddings, such as the user's identity or demographic characteristics, in existing sequential models are replaced with interaction-based user vectors is proposed by the study of Ananyeva et al
. The user vectors based on interactions are generated by utilizing GRU layers with modified dropout and a maximum item sequence length. This approach was evaluated on real-world datasets. The evaluation revealed that the majority of the evaluated models, including CHORUS, SLRC, and HGN, showed improved quality. However, while the proposed approach has the potential to improve the accuracy and generalization of sequential recommendation models, it does not consider the customer’s repeat purchase behavior, which as a result affects the quality of recommendation in terms of the timing
| [21] | M. Ananyeva, O. Lashinin, V. Ivanova, S. Kolesnikov and D. I. Ignatov, "Towards Interaction-based User Embeddings in Sequential Recommender Models," 2022. |
[21]
.
Lee et al. proposed a recommendation model for personalized recommendations based on Long Short-Term Memory (LSTM), which is a type of recurrent neural network (RNN) capable of retaining information from previous inputs over a long period while disregarding irrelevant data. By leveraging the strengths of LSTM, the authors aimed to capture subtle patterns and correlations in user behavior history to provide more relevant recommendations. Their model considers purchase histories and is evaluated using a multi-period approach. They assume that a customer has made purchases up to a certain timespan (T-1) and then recommend items for subsequent timespans (T, T+1, and so on). The LSTM-based model is trained using various methods and compared against collaborative filtering and popularity models. The model was tested on the Instacart dataset and demonstrated promising results compared to collaborative filtering and popularity models. However, its accuracy tends to decrease over longer timespans.
The study conducted by Yu et al. introduced the Dynamic Recurrent Model for Next Basket Recommendation (DREAM). This model proposes a novel neural network architecture that combines recurrent neural networks (RNNs) with dynamic embeddings to effectively capture the sequential patterns in user behavior. The main objective of the DREAM model is to predict the probability of a user including a specific item in their future purchase based on their previous buying history. To represent users, dynamic embeddings are utilized, which adapt and evolve as the user interacts with different items. The DREAM model takes input in the form of a sequence of baskets, consisting of items the user has previously purchased, and leverages this information to generate recommendations for the next items the user is likely to purchase. To represent these baskets as inputs, the vectors representing the items in a basket are aggregated using either max-pooling or average-pooling to form a basket-level representation. The basket-level representations obtained are subsequently fed into an RNN, which generates a dynamic representation of the user's interests as they evolve over time. Within the DREAM model, a hidden layer is incorporated to capture this dynamic representation of the user's interests. Additionally, a recurrent connection weight matrix facilitates the propagation of sequential signals between adjacent hidden states. At each time step, the hidden layer is updated by considering the current basket-level input and the previous hidden state. This enables the model to predict the probability distribution of the next item that a user is likely to purchase. The authors evaluated the model on two datasets, Instacart and Alibaba, and compared its performance with several recommendation approaches including MC, FPMC, and HRM. The results showed that the model outperformed the other recommendation approaches in terms of precision, recall, and F1 score
| [23] | F. Yu, Q. Liu, S. Wu, L. Wang and T. Tan, "A Dynamic Recurrent Model for Next Basket Recommendation," in Proceedings of the 24th ACM International on Conference on Information and Knowledge Management, 2015. https://doi.org/10.1145/2911451.2914683 |
[23]
.
A study conducted by Maasakkers et al. introduced a model for next-basket recommendation. This model is based on GRUs (Gated Recurrent Units) and is used to predict the next set of items that a user will purchase. Recurrent neural networks (RNNs) play a crucial role in this model as they allow the transfer of information from one time step to the next through feedback loops. By considering the complete sequence of previous purchases, RNNs enable the prediction of future customer baskets. The authors mention that various forms of RNNs have been used, including the standard fully connected RNN. In this type of RNN, each layer's output is calculated by taking a weighted sum of the previous layer's outputs and passing it through a non-linear activation function. The study specifically addresses the challenge of dealing with high dimensionality in e-commerce data, where there is a large number of unique items available for purchase. The proposed model was evaluated using the Instacart dataset and demonstrated superior performance compared to several state-of-the-art recommendation models, such as TARS and linear GRU.
| [24] | L. v. Maasakkers, D. F. b and B. Donkers, "Next-basket prediction in a high-dimensional setting using gated recurrent units," in Expert Systems with Applications, Netherlands, 2023. https://doi.org/10.1016/j.eswa.2022.118795 |
[24]
. DREAM and the GRU-based model are two distinct approaches proposed for next-basket recommendation in e-commerce. While both models utilize recurrent neural networks (RNNs) to capture the sequence of items purchased by users and predict their future baskets, there are variations in their approaches that may make one model more suitable than the other in specific scenarios. However, it is important to note that both models do not take into account the potential of modeling customers' repetitive purchasing behavior based on factors beyond their sequential purchase history.
The ReRec recommendation model, proposed by Wu et al., is specifically designed for community e-commerce scenarios where users interact and form groups. It consists of two main components: one that focuses on modeling repeat purchase behaviors exhibited by different user types, and another that recommends items to users based on their distinct repeat purchase patterns. To begin the analysis, a fundamental data matrix is collected, which contains user-item purchase records representing the original user-item interaction matrix. This matrix assigns user IDs to rows, item IDs to columns, and the corresponding elements represent the cumulative quantity of item purchases by each user at a given time 't’. Users and user-items are then classified based on their activity and stability levels. Users are divided into active and inactive categories using mathematical modeling, while items are categorized based on their stable or unstable levels of interest. The joint user-item partition matrix displays the combined classification outcomes. Using this matrix as a basis, item recommendation is carried out through a divide-and-conquer approach. Users' repeat purchase behaviors are categorized into four types: active users with stable interest (ASI), inactive users with stable interest (IASI), active users with unstable interest (AUSI), and inactive users with unstable interest (IAUSI). One notable aspect of the ReRec model is its incorporation of the social aspect of online shopping by considering users' repeat purchase behaviors in relation to their community activity. This differentiates it from conventional e-commerce platforms. The performance evaluation of the ReRec model was conducted using a dataset collected from a community e-commerce site. The results demonstrated its superiority over several other recommendation approaches, including traditional Collaborative Filtering (CF) and Singular Value Decomposition (SVD). However, it is important to note that the ReRec model may have limitations in its applicability to other recommendation scenarios, as it was specifically designed for community e-commerce scenarios. Additionally, the scalability of ReRec might be constrained when dealing with large-scale datasets, as the model was only tested with a dataset consisting of 11,350 purchase records. Overall, the ReRec model offers a unique approach to recommendation in community e-commerce scenarios, taking into account users' repeat purchase behaviors and community activity. Its performance superiority over other approaches in the evaluated dataset showcases its potential effectiveness in this specific context
| [25] | J. Wu, Y. Li, L. Shi, L. Yang, X. N. and W. Zhang, "ReRec: A Divide-and-Conquer Approach to Recommendation Based on Repeat Purchase Behaviors of Users in Community E-Commerce," in Mathematical Optimization and Evolutionary Algorithms with Applications, 2022. https://doi.org/10.3390/math10020208 |
[25]
.
2.2. Statistical-Based Recommendations
In recent years, probabilistic models have become increasingly popular for modeling repeat purchase behavior. One of the key advantages of these models is their ability to capture the uncertainty and variability of customer behavior. In the e-commerce and marketing industries, probabilistic models have proven to be particularly useful for predicting customer behavior and improving business outcomes
| [26] | Y. Zhang, M. Shirakawa and T. Hara, "A Probabilistic Model for Predicting E-commerce Purchases from Emerging Local and Social Interests," in ACM International Joint Conference on Web Intelligence and Intelligent Agent Technology, Melbourne, 2020. https://doi.org/10.1109/WIIAT50758.2020.00049 |
[26]
. These models provide businesses with insights into product associations and timing within a customer's life cycle. This understanding allows them to deliver personalized product recommendations that are relevant and timely, increasing the likelihood of customers making complementary purchases or purchasing items at specific stages in their journey. Furthermore, probabilistic models can be used to generate personalized recommendations and customer-specific promotions by taking into account the individual's purchase history and preferences.
A probabilistic model was proposed for time-aware recommender systems in the study of LIN et al. that considers the impact of both recent and earlier data on the quality of recommendations. To train and evaluate the model, the authors utilized four ratings datasets: MLK (MovieLens100k), MLM (MovieLens1M), Ep (Epinions), and EpEx (Epinions extended). To establish the initial distribution of random variables representing users and items, the initial ratings were utilized. Subsequently, a hidden Markov model was employed, incorporating the recent ratings, to capture the dynamic preferences of both users and items as they evolve over time. Notably, the model has the ability to adapt to new data seamlessly, without imposing substantial time costs. Through experimental evaluations, the researchers demonstrated that their model surpassed existing temporal and online models for recommender systems in terms of performance. This provides further evidence of the effectiveness and superiority of their approach in capturing and predicting evolving user-item preferences. It is worth noting, however, that the four ratings datasets used for testing the model were relatively small in size. Therefore, the performance of the model may vary when handling larger datasets. Furthermore, the model was not evaluated on data specifically related to purchasing behavior
.
A method for calculating probabilities was proposed by the study of Le et al... The proposed approach acknowledges the observation that items purchased together in small baskets exhibit stronger predictive power compared to their occurrence in large baskets. The NB (items) model consistently outperforms the NB (baskets) model in terms of binary hit rates and noise resistance, indicating its potential to enhance the adoption of personalized recommendations. However, it is important to note that the model does not account for the sequential ordering of item purchases. Another limitation is the lack of consideration for users' repetitive purchase behavior
.
The Poisson distribution is widely employed as a prevalent model for describing the frequency of random events occurring within a given timeframe, space, or unit. It is frequently utilized to characterize the occurrence of phenomena in various fields and contexts
| [29] | H. Ogura, H. Amano and M. Kondo, "Gamma-Poisson Distribution Model for Text Categorization," ISRN Artificial Intelligence, p. 18, 2013. https://doi.org/10.1155/2013/829630 |
[29]
. The Poisson distribution is a statistical model commonly used to analyze the occurrence of random events within a specified time frame. It provides a way to estimate the number of discrete events likely to happen over a given period. In the study conducted by Silva et al., a variation of the Poisson model called Poisson Gamma, combined with content and social trust information (referred to as Poisson-CS), was employed. The PoissonMF-CS model focused on modeling social trust, which suggests that users are influenced by the choices and behaviors of their peers. When users observe their peers engaging with specific items or having positive experiences with them, they tend to trust and follow their choices. Silva et al. conducted experiments using a dataset that contained both content and social side information. The results of their experiments consistently demonstrated that the proposed PoissonMF-CS model outperformed previous Poisson models such as SPF and CTPF, as well as alternative joint models based on Gaussian probabilistic factorization and LDA (CTR-SMF and CTR). This highlights the superiority of the PoissonMF-CS model in effectively leveraging content and social information to improve recommendation performance
| [30] | E. d. S. d. Silva, H. Langseth and H. Ramampiaro, "Content-Based Social Recommendation with Poisson Matrix Factorization," Norwegian University of Science and Technology, p. 17, 2017. https://doi.org/10.1007/978-3-319-71249-9_32 |
[30]
. Another model of Poisson distribution, which is the collective Bayesian Poisson factorization model, has been proposed by the study of Zhang et al. to address the cold-start problem which refers to a situation where the system encounters challenges in making accurate and effective recommendations for new users or new items with limited or no historical data. Through experimentation on real event datasets from Beijing and Shanghai, the researchers were able to validate the effectiveness of their model. The results consistently demonstrated that their model outperformed several alternative methods, including WBS, TBS, C-BPF, and CTR. This indicates the superiority of their approach in terms of performance and highlights its potential for practical applications in event modeling and analysis
| [31] | W. Zhang and J. Wang, "A Collective Bayesian Poisson Factorization Model for Cold-start Local Event Recommendation," Department of Computer Science and Technology, p. 10, 2015. https://doi.org/10.1145/2783258.2783336 |
[31]
.
Four models were proposed by the study of Bhagat et al. for the repeat purchase recommendations. The first model is the Repeat Customer Probability Model, which calculates the number of purchases of the product across all customers and ranks its priority in recommendation accordingly. The second model is the Aggregate Time Distribution Model, which takes into consideration the customers repurchase rate for the product and the last time a specific customer bought the product (the time signal), but it does not consider the repurchase rate for this specific customer, so it is not fully personalized. The third model introduced is the Poisson Gamma Model, which focuses on the repurchase rate of a specific customer without taking into account their most recent purchase of the product. On the other hand, the fourth model is the Modified Poisson Gamma Model (MPG), designed to capture the intricate purchasing behavior of e-commerce customers. The MPG model extends the basic Poisson Gamma process by incorporating additional parameters that consider repeat purchases of the same product. This includes factors such as the number of purchases made by a customer within a specific time interval and the influence of time on purchase behavior. Additionally, the MPG model incorporates the purchase rate for the product across all customers. The rate parameter of the Poisson distribution is modeled as a gamma distribution, which captures the variability of purchase frequency across the entire customer base. It is worth noting that both the Poisson-Gamma and Modified Poisson Gamma models are Bayesian in nature, allowing for the utilization of personalized purchase signals in addition to aggregate purchase behavior of all users. To evaluate the performance of these models, an Amazon dataset was employed for testing purposes. The experimental results indicated that the Aggregate Time Distribution Model, the Poisson Gamma Model, and the Modified Poisson Gamma models were more accurate compared to the baseline Repeat Customer Probability model. Furthermore, both the Repeat Customer Probability and the Aggregate Time Distribution models demonstrated significantly lower accuracy when compared to both the Poisson Gamma and the Modified Poisson Gamma models. These findings highlight the superior performance of the Poisson Gamma and Modified Poisson Gamma models in capturing and predicting customer purchase behavior
| [32] | H. Yu, "Latent Factor Model for Book Recommendation System - Taking Douban as an Example," in International Conference on Education Science and Economic Development (ICESED 2019), 2019. https://doi.org/10.2991/icesed-19.2020.5 |
[32]
.
Summary of Literature and Research Gap
After conducting a thorough literature review, it is evident that there is a research gap in the existing studies related to global sequential behavior, repetitive purchase behavior, time-elements, and large datasets.
Table 1 highlights the presence or absence of these features across various papers and models. In the table, "X" represents the absence of a feature, while "Y" represents the presence of a feature.
Table 1. Comparative Analysis of Features in Papers.
Paper/Feature | Global Sequential Behavior | Repetitive Purchase behavior | Time-Elements | Large datasets |
| [20] | S. Rendle and C. Freudenthaler, "Factorizing Personalized Markov Chains for Next-Basket Recommendation," in International World Wide Web Conference, North Carolina, 2010. https://doi.org/10.1145/1772690.1772773 |
[20] | X | X | X | Y |
| [21] | M. Ananyeva, O. Lashinin, V. Ivanova, S. Kolesnikov and D. I. Ignatov, "Towards Interaction-based User Embeddings in Sequential Recommender Models," 2022. |
[21] | Y | X | X | Y |
| Y | Y | X | Y |
| [23] | F. Yu, Q. Liu, S. Wu, L. Wang and T. Tan, "A Dynamic Recurrent Model for Next Basket Recommendation," in Proceedings of the 24th ACM International on Conference on Information and Knowledge Management, 2015. https://doi.org/10.1145/2911451.2914683 |
[23] | Y | Y | X | Y |
| [24] | L. v. Maasakkers, D. F. b and B. Donkers, "Next-basket prediction in a high-dimensional setting using gated recurrent units," in Expert Systems with Applications, Netherlands, 2023. https://doi.org/10.1016/j.eswa.2022.118795 |
[24] | Y | Y | X | Y |
| [25] | J. Wu, Y. Li, L. Shi, L. Yang, X. N. and W. Zhang, "ReRec: A Divide-and-Conquer Approach to Recommendation Based on Repeat Purchase Behaviors of Users in Community E-Commerce," in Mathematical Optimization and Evolutionary Algorithms with Applications, 2022. https://doi.org/10.3390/math10020208 |
[25] | X | Y | X | X |
| Y | X | Y | X |
| X | X | Y | Y |
| [32] | H. Yu, "Latent Factor Model for Book Recommendation System - Taking Douban as an Example," in International Conference on Education Science and Economic Development (ICESED 2019), 2019. https://doi.org/10.2991/icesed-19.2020.5 |
[32] | X | Y | Y | Y |
Upon analyzing the table, it becomes apparent that none of the previously introduced models encompass all the mentioned features. This finding shows the need for a comprehensive model that combines global sequential behavior, repetitive purchase behavior, time-elements, and the handling of large datasets. To bridge this research gap, the LSTM-EMPG model is being proposed. By integrating all of these crucial features, the LSTM-EMPG model aims to provide a holistic and effective solution for the next basket recommendation.
3. Proposed Methodology
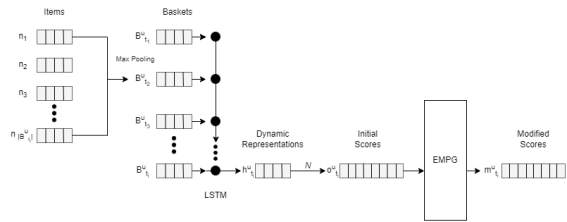
This paper proposes a Hybrid LSTM and Enhanced Modified Poisson Gamma model (LSTM-EMPG) for the next basket recommendations. LSTM has been shown to be effective in capturing the sequential patterns of a user's purchase history, especially in the context of recommendation systems. The Modified Poisson Gamma model (MPG), which is based on the Poisson Gamma model (PG), takes into account the time signal (MPG), the customer’s individual repurchase rate (PG) and the collective repurchase rates for all customers (PG). The Enhanced Modified Poisson Gamma model (EMPG) takes into consideration both the individual and collective item appearance rate (the number of times an item has been purchased over the number of baskets) and focuses on the individual user's purchase frequency and time signal as the main influencing parameters.
Figure 2. Proposed hybrid LSTM-EMPG.
The proposed hybrid LSTM-EMPG model is illustrated in
Figure 2 for a single user. Baskets are first prepared by converting the items in the basket into corresponding latent vectors. Max pooling is then applied to obtain a single vector representation of each basket. The baskets are then fed into the LSTM to train it and generate a dynamic representation of the user. Initial scores for all items are then obtained based on the dynamic representation. The EMPG model is then employed to further optimize these scores and the top 10 scoring items are recommended to the user. The following subsections describe in more detail the basket preparation, the LSTM, and the EMPG model.
3.1. Baskets Preparation
The baskets for each user are created using the IDs of the items purchased in each order and sorted in ascending order. The users are then divided into batches; in each batch, the baskets are padded out according to the user with the largest basket in the batch. The baskets are then converted into a sequence of vectors representing the items using latent factors. Latent factors are hidden characteristics of users and items that are not directly observable but can be inferred from their interactions. These latent factors can be considered as the underlying preferences, tastes, or features
. The basket for each user is initially represented as shown in Equation
1 where
represents the latent representation of the
l-th item in basket
and
denotes the number of items in basket
.
Equations are based on DREAM
| [34] | E. S. El-Shaer, G. T. McKee and A. Hamdy, "A Hybrid LSTM and Probabilistic Model for Modeling Repeat Purchase Behavior," in 2023 International Conference on Computer and Applications (ICCA), Cairo, 2023. https://doi.org/10.1109/ICCA59364.2023.10401585 |
[34]
.
(1)
In order to extract the key features from the input data, max pooling is then utilized, which is a neural network technique used to extract the dominant item embeddings from the input item sequence, as shown in Equation
2, where
is the
k- dimension of a basket representing vector
.
represents the value of
k- dimension of the vector representation of the
l-th item
in basket
. This results in focusing on the most important aspects of the features and discarding the less important details, which can improve computational efficiency.
(2)
3.2. Long Short-Term Memory (LSTM)
In the LSTM architecture, the sequence of vectors obtained from the previous step is passed into the LSTM architecture which consists of two hidden layers with a sigmoid activation function. The batch size is set to 32. To calculate the batch loss, the LSTM utilizes the Bayesian Personalized Ranking (BPR) method. The BPR loss function iterates over the baskets of each user in the batch, excluding the baskets that have zero products (the padded baskets). Each basket is assigned to a variable representing the purchased products in the basket (Pos_IDx). A corresponding basket is created containing the same number of products, but different products, selected randomly from the whole products of the dataset, and assigned to another variable (Neg_IDx). The score of each product in both baskets is obtained from the dynamic representation of the user. The score of each product in Neg_IDx is then subtracted from the score of the product at the same index position in Pos_IDx and the differences are summed to give an overall score for the basket. A large score resulting from the subtraction indicates that the actual purchased products in the user's basket have higher predicted scores than the non-purchased products, which indicates that the model is learning well. This is repeated for each basket to give an overall score for the user and for each user to give an overall score for the batch. A log-sigmoid function is then applied so that the loss is small if the score is large. The BPR loss function returns the batch's loss. The objective function is then optimized by Back Propagation Through Time (BPTT).
The LSTM output scores
for all items at time
for each user. This is achieved through the multiplication of product matrix N and a user’s dynamic representation
, as shown in Equation
3. A higher score reflects a stronger likelihood of the user purchasing the product.
3.3. Enhanced Modified Poisson Gamma Model
The LSTM (Long Short-Term Memory) model generates a probability distribution that encompasses all potential items a customer might add to their next basket. In the context of recommendation, the Enhanced Modified Poisson Gamma Model (EMPG) introduces modifications to this distribution. Specifically, the EMPG recommends the top 10 products with the highest scores to the user. This enhancement builds upon the Modified Poisson Gamma Model (MPG), which in turn is a modification of the Poisson Gamma model (PG). The purchase rate
for the MPG model is estimated using Equation
4 | [14] | R. Bhagat, S. Muralidharan, A. Lobzhanidze and S. Vishwanath, "Buy It Again: Modeling Repeat Purchase Recommendations," Applied Data Science Track Paper, p. 9, 2018. https://doi.org/10.1145/3219819.3219891 |
[14]
.
(4)
and are the shape and rate parameters of the product . The variable represents the number of purchases of product by user ; is elapsed time interval between the first and the most recent purchase of product by customer . The time signal represents the elapsed time interval between the last purchase of product by user and the current time. Additionally, is the estimated mean repeat purchase time interval between successive purchases of product by user .
Two parameters are proposed in EMPG. These parameters reflect the popularity of a product with an individual user and across all users, which is not reflected in the MPG model, where the focus is on the time period of purchases. The first parameter is the individual product appearance rate
, which considers the popularity of the product with an individual user. It is calculated as shown in Equation
5, where
is the number of times the product
has been purchased by user
and
is the number of baskets of user
.
The second parameter is the collective product appearance rate
, which considers the product's popularity among all users. It is calculated as shown in Equation
6, where
is the number of times the product has been purchased by user
,
is the number of baskets for user
, and both summations are over
.
Through experiments, reported in section 4, it was found that integrating all the parameters in a single equation had a negative impact on the accuracy of recommendations compared to when each parameter is considered individually. Further experiments, also reported in section 4, identified the individual user purchase frequency and time signal as the most influential parameters. These were incorporated into a revised equation for the purchase rate
of item
for user
. The revised calculation is shown in Equation
7.
(7)
These experiments identified purchase frequency across all users, individual product popularity, and collective product popularity across all users, as less influential. However, since these parameters were found to have a positive impact individually, but not always, it was decided to sum them and apply a threshold strategy, the threshold to be determined experimentally, to decide if the sum should contribute to the purchase rate. The sum
is calculated as shown in Equation
8, where
is the purchase frequency for product
across all customers and
is the purchase frequency for product
for individual users. The purchase rate
is then updated as shown in Equation
9, where
is the experimentally determined threshold.
(8)
(9)
The updated purchase rates obtained from Equation
9 are added to the scores for the corresponding products output by the LSTM model in Equation
3. The top 10 products with the highest scores are then recommended to the user.
4. Experimental Setup
An experimental study was conducted using the Instacart dataset. The study aimed to optimize the LSTM model by testing the influence of the two parameters of the MPG model. The first is the purchase frequency of individual users,
, which represents the number of times a product has been purchased by a single user
over a given time period
. The purchase rate in this case is given by Equation
10.
(10)
The second is the purchase frequency of all users,
, which indicates the number of times a product has been purchased by all users collectively
within a given time period
. The purchase rate in this case is given by Equation
11.
(11)
Furthermore, the study assessed the influence of the individual purchase frequency + time signal,
, which combines the number of times a product has been purchased by an individual user with the calculation of the time since the customer's last purchase of the product. The purchase rate in this case is given by Equation
12.
(12)
Then the influence of the proposed individual and collective appearance rates, respectively and , were assessed by summing each with the LSTM output to refine the recommendations scores.
Experiments were then conducted to determine a value for the threshold
in Equation
9 that optimized the accuracy of the hybrid LSTM-EMPG model.
In addition, both the MPG model in its original form and the proposed EMPG model were applied to optimize the LSTM model, and the effectiveness of each approach was evaluated.
Finally, the hybrid LSTM-EMPG is compared against four models including the Multi-period LSTM
, DREAM(RNN)
| [34] | E. S. El-Shaer, G. T. McKee and A. Hamdy, "A Hybrid LSTM and Probabilistic Model for Modeling Repeat Purchase Behavior," in 2023 International Conference on Computer and Applications (ICCA), Cairo, 2023. https://doi.org/10.1109/ICCA59364.2023.10401585 |
[34]
, DREAM(LSTM), and a state-of-the-art GRU-based model
| [24] | L. v. Maasakkers, D. F. b and B. Donkers, "Next-basket prediction in a high-dimensional setting using gated recurrent units," in Expert Systems with Applications, Netherlands, 2023. https://doi.org/10.1016/j.eswa.2022.118795 |
[24]
.
Python was used as the programming language for implementing the study. The DREAM(RNN) model
| [34] | E. S. El-Shaer, G. T. McKee and A. Hamdy, "A Hybrid LSTM and Probabilistic Model for Modeling Repeat Purchase Behavior," in 2023 International Conference on Computer and Applications (ICCA), Cairo, 2023. https://doi.org/10.1109/ICCA59364.2023.10401585 |
[34]
was run and its results matched the reported results, confirming the successful installation and execution of the model. DREAM(LSTM), DREAM(LSTM)+ MPG, and DREAM(LSTM)+EMPG were also executed. The results of the GRU model were obtained from
| [24] | L. v. Maasakkers, D. F. b and B. Donkers, "Next-basket prediction in a high-dimensional setting using gated recurrent units," in Expert Systems with Applications, Netherlands, 2023. https://doi.org/10.1016/j.eswa.2022.118795 |
[24]
, The results of the Multi-Period LSTM were obtained from.
The experimental setup for the model is similar to that of the DREAM model
| [23] | F. Yu, Q. Liu, S. Wu, L. Wang and T. Tan, "A Dynamic Recurrent Model for Next Basket Recommendation," in Proceedings of the 24th ACM International on Conference on Information and Knowledge Management, 2015. https://doi.org/10.1145/2911451.2914683 |
[23]
, with some modifications. Specifically, a switch from RNN to LSTM is made to improve the model's performance. In the LSTM configuration, the architecture comprises two hidden layers with a sigmoid activation function. The batch size is set to 32, and the batch loss is calculated using the Bayesian Personalized Ranking (BPR) method. These adjustments are made to enhance the model's capabilities and optimize its training process.
The research utilized the Instacart dataset as the primary data source for analysis and experimentation
, which consists of a vast collection of 3 million orders placed by 200,000 users. This dataset provides extensive details encompassing various aspects such as product information, order details, user profiles, department classifications, and aisle locations where the products are situated. The Instacart dataset was chosen for the research to ensure a fair evaluation against all the models. The following preprocessing steps were taken to prepare the dataset for training and testing the model.
First, the number of baskets is calculated for each user, as shown in Equations
13 and
14.
is the vector of baskets,
, of user
at times
,…,. The maximum number of baskets associated with each user is given by applying the count operator
on the vector of baskets
, denoted by
.
The average time intervals,
, between baskets for each user is calculated as shown in Equations
15 and
16.
is the vector of days between consecutive baskets at times
and
is the mean of
for user
.
is the average time between baskets for each user. The output is in terms of months, where a month is 30 days.
The time interval between the purchases of a given product is a critical factor in the proposed Enhanced Modified Poisson Gamma model for predicting the next basket. The baskets in which each product was purchased are first sorted in ascending order, and then the time span between the first and last of these baskets is computed in months. The days between each consecutive baskets for a particular product are denoted by
, with
ranging from
to
, where
represents the first basket in which the product
was purchased by user
, and
represents the last basket in which the product was purchased by user
. It should be noted that the first basket cannot be assigned a 'days since prior order' value, that is why it starts with
. To compute the time interval,
, the days are summed, and the result is divided by 30 to express it in months, as shown in Equation
17.
(17)
One of the significant factors in the EMPG model is the time signal, which estimates the customer's most recent purchase of the product. The time signal is computed as shown in Equation
18.
is the latest basket number containing the product.
is the latest basket number for the user in general,
is the difference in time between the
and
baskets,
is calculated as the sum of all
values, where
ranges from
to
and is divided by 30 to express it in months.
(18)
5. Results and Discussion
For evaluating the quality of the recommendations in this research, industry-standard evaluation metrics such as precision, recall, and F1 score were employed. These metrics are widely accepted and used to assess the performance of recommendation systems. The influence of each of the parameters of MPG on the LSTM model predictions has been tested as shown in
Table 2.
Table 2. Influence of the Parameters of MPG independently on LSTM.
Metric | LSTM | LSTM + | LSTM+ | LSTM+ + |
Precision | 0.075 | 0.277 | 0.161 | 0.289 |
Recall | 0.067 | 0.271 | 0.147 | 0.281 |
F1Score | 0.071 | 0.274 | 0.153 | 0.285 |
The results indicate that integrating any of the parameters of the MPG model enhances the prediction accuracy of the LSTM model. However, + , has the highest accuracy. This is reasonable, as an individual customer's purchase history is a critical factor in predicting future purchases. Additionally, the parameter incorporates both the purchase history and the time signal indicating when the most recent purchase was made. This ensures that the recommendations take into account not only what the customer has previously purchased but also when they made those purchases.
The influence of the proposed individual and collective appearance rates, respectively
and
, on the LSTM output were assessed.
Table 3 shows the contribution of each parameter to the accuracy of the recommendations generated for the user.
Table 3. Influence of the appearance rate parameters on LSTM.
Metric | LSTM | LSTM+ | LSTM+ |
Precision | 0.075 | 0.083 | 0.089 |
Recall | 0.067 | 0.081 | 0.085 |
F1Score | 0.071 | 0.082 | 0.087 |
The results show that the proposed appearance rate parameters increase the LSTM recommendation accuracy.
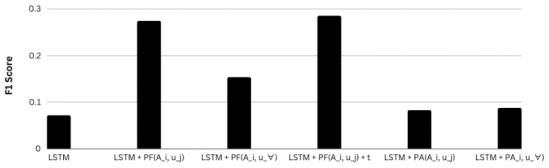
Figure 3 demonstrates the influence of all the parameters on the LSTM model, including the original MPG parameters and the proposed appearance rate parameters.
Figure 3. The most and least influential parameters on LSTM.
The results show that certain parameters have more influence than others. Specifically, the individual customer purchase frequency parameter (), along with the time signal (), are the most dominant. This makes sense as a customer's own purchase history is the strongest indicator of their future purchases. On the other hand, the user appearance rate () seems to have the least influence, as the time element is not present.
Initially, the objective was to integrate the Modified Poisson Gamma (MPG) model into the hidden state of the LSTM model. This was accomplished by treating users as baskets, where each basket consisted of a collection of products, each with its own unique features. For every product in a customer's basket, the Enhanced Modified Poisson Gamma (EMPG) model was applied to identify the most prominent feature, and its score was augmented within the hidden state. However, the integration of the MPG model into the hidden state in the initial approach did not yield substantial improvements. One potential reason for this outcome could be that the scores were potentially diminished or diluted during the backpropagation process. To ascertain if this was the sole reason, an alternative approach was attempted. In this alternative approach, the MPG model was incorporated into the input. Nonetheless, this adjustment did not lead to a significant increase in accuracy. This could be attributed to the fact that the inputs were treated as features rather than precise products, thereby limiting the effectiveness of the MPG model. After experimenting with various approaches, a final method was determined. This involved integrating the MPG model into the predictions of the LSTM model. By doing so, the predictions generated by the LSTM model were influenced by the MPG model, resulting in a more comprehensive and accurate representation of the data. This approach demonstrated a significant improvement in the accuracy and reliability of the predictions, as evidenced in
Table 4.
Table 4.
The integration of the MPG into LSTM | [34] | E. S. El-Shaer, G. T. McKee and A. Hamdy, "A Hybrid LSTM and Probabilistic Model for Modeling Repeat Purchase Behavior," in 2023 International Conference on Computer and Applications (ICCA), Cairo, 2023. https://doi.org/10.1109/ICCA59364.2023.10401585 |
Metric | LSTM | LSTM + MPG |
Precision | 0.075 | 0.227 |
Recall | 0.067 | 0.228 |
F1Score | 0.071 | 0.228 |
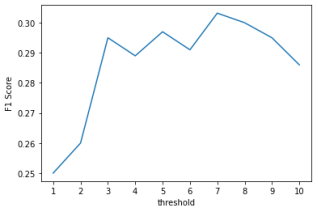
After analyzing the individual impact of each parameter on accuracy, it was found that integrating all the parameters had a negative impact on accuracy compared to considering each parameter individually. As a result, the decision was made to focus on the main influencing parameters for the LSTM model, which are the individual user purchase frequency and time signal. However, it was important to incorporate the other parameters because they had a positive impact on accuracy. Therefore, the decision was made to sum them up and compare the total to a threshold of 7. This threshold was identified as the optimal threshold after systematic testing with a range of other thresholds, as shown in
Figure 4.
Figure 4. Systematic testing of thresholds.
After deciding on the threshold, the EMPG was integrated into the LSTM outputs, resulting in an increase in the accuracy of LSTM recommendations, as shown in
Table 5.
Table 5. The integration of the EMPG into LSTM.
Metric | LSTM + EMPG |
Precision | 0.310 |
Recall | 0.296 |
F1 Score | 0.303 |
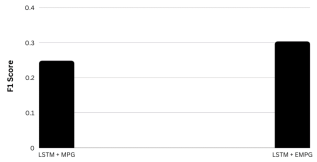
Figure 5. Comparison between MPG and EMPG models.
A comparison is made between the influence of MPG and the proposed EMPG on the accuracy of LSTM recommendations, as depicted in
Figure 5.
The reliability of LSTM recommendations was notably improved by the LSTM-EMPG model, surpassing the accuracy achieved by the MPG model.
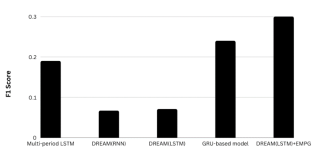
To evaluate the performance of the LSTM-EMPG model, a comparative analysis was conducted against several other models, namely the Multi-period LSTM, DREAM(RNN), DREAM(LSTM), and the state-of-the-art GRU model. The aim was to assess the accuracy and reliability of the LSTM recommendations in relation to these models. Notably, the proposed EMPG model outperformed the MPG model, demonstrating superior accuracy in generating LSTM recommendations. The performance of the LSTM-EMPG model was extensively compared to the models, and the results are depicted in
Figure 6. The primary objective of these proposed models is to improve the quality of recommendations for the next basket of items.
Figure 6. Comparison Of the prediction accuracy of LSTM_EMPG against previous models.
The results demonstrate that the multi-period LSTM model is superior to DREAM in certain aspects; however, it did not provide clear insights into how baskets were represented. This particular limitation led to focus on the DREAM model instead of the multi-period LSTM. The results also show a difference in accuracy between the use of general RNNs and the proposed LSTM in DREAM. This is due to certain users having up to 100 baskets, which could be challenging for general RNNs to remember. Nevertheless, since there are not many users who have long baskets, this could be the reason why the difference in accuracy is not very significant. The state of art GRU-based model demonstrated significant improvements over the multi-period and DREAM models. However, the proposed LSTM-EMPG model achieved the highest accuracy.
The LSTM-EMPG model distinguishes itself from other models by integrating the proposed EMPG model. This unique feature sets the LSTM-EMPG model apart from other models and contributes to its improved performance in the next basket recommendation.
6. Conclusion and Future Work
Most recommendation systems are built on the principle that users with similar preferences and behavior can be used to make recommendations to other users. This approach, commonly known as collaborative filtering, forms the foundation of many recommendation systems. On the other hand, most conventional collaborative filtering approaches neglect the crucial aspect of considering the sequential purchase order of products. While they rely on user ratings and preferences, they overlook the valuable insights that can be gained from analyzing the sequential purchase history of products.
To address this limitation, LSTM models have emerged as effective solutions. LSTMs excel at capturing the sequential patterns in user behaviors by leveraging memory cells and hidden states to store information from previous inputs. By considering the user's purchase history, LSTMs can generate personalized predictions for future purchases, resulting in more accurate and tailored recommendations.
However, existing LSTM models often overlook the significance of repetitive purchase behavior within specific time spans. They do not take into account the frequency of product purchases over time and the exact timing of these purchases, which can be effectively addressed by incorporating a probabilistic model.
This study introduces a novel approach called LSTM-EMPG (Long Short-Term Memory and Enhanced Modified Poisson Gamma Model) for the next basket recommendation. The EMPG model incorporates essential parameters, including the purchase frequency of individual customers and all customers, as well as a time signal indicating the customer's most recent purchase. Additionally, the model integrates two additional parameters: the appearance rate of the product for individual customers and all customers. These enhancements aim to improve the model's predictive capability for the next set of purchases by users. To determine the optimal approach for optimizing the LSTM model's predictions, experiments were conducted comparing the original MPG model with the proposed EMPG model. The results of these experiments revealed that the proposed EMPG model had a more significant impact on the LSTM recommendations, leading to improved performance. The performance of the LSTM-EMPG model was evaluated using the Instacart dataset. The results demonstrated its superiority over other models, including the multiperiod LSTM, DREAM, and GRU models. This finding provides strong evidence for the exceptional performance of the LSTM-EMPG model in making accurate predictions for next-basket recommendations.
In the future, the LSTM-EMPG model will be further tested on diverse datasets to validate its effectiveness in different contexts. Additionally, alternative embedding methods will be explored to enhance the item representation and enable seamless integration with the EMPG model. Moreover, the incorporation of essential parameters from the EMPG model into the GRU model will be investigated, aiming to enhance its accuracy even further. These future research directions hold great potential for advancing the performance and applicability of the LSTM-EMPG model in the field of next-basket recommendation.
The potential of the EMPG model will also be explored by examining different key parameters that have the potential to enhance its ability to predict repetitive purchase behavior for users. This research aims to continually enhance the LSTM-EMPG model and expand its capabilities in providing accurate and personalized recommendations.