1. Introduction
Genetic, epigenetic, and molecular alterations that disrupt regular cellular processes including adhesion, proliferation, and genomic maintenance are the causes of cancer, a complicated illness. Finding and understanding the molecular actors involved in these pathways is essential to developing effective diagnostic and therapeutic strategies. Four genes—HMMR (Hyaluronan-Mediated Motility Receptor), CDH1 (E-cadherin), NPM1 (Nucleophosmin1), and HDAC5 (Histone Deacetylase 5)—were selected for a comprehensive bioinformatics analysis to examine their expression, mutation status, immunological relationship, and potential role in the development of cancer.
| [1] | Samanta D, Bhattacharya M. Pivot gene enrichment analysis of Streptococcus pyogenes-specific hyaluronic acid mediated disease prognosis on gastric cancer: based on bioinformatics study. Comput Biol Chem. 2026; 122: 108928.
https://doi.org/10.1016/j.compbiolchem.2026.108928 |
| [2] | Samanta D. Microbial informatics in association with disease biology: a multi-omics approach on computational microbiology applications. Ann Med Med Sci. 2025. |
[1, 2]
HMMR encodes a protein that interacts with hyaluronan and is necessary for mitotic regulation, cell motility, and spindle formation. Overexpression of HMMR has been discovered in several malignancies, and this is often linked to enhanced migration, proliferation, and a poor prognosis. In contrast, the traditional tumor suppressor gene CDH1 is responsible for maintaining epithelial cell-cell contact through E-cadherin. CDH1 deletion or mutation triggers the epithelial-to-mesenchymal transition (EMT), a critical phase in tumor invasion and metastasis. NPM1 is a versatile nucleolar phosphoprotein involved in ribosome production, centrosome duplication, and genomic stability.
Mutations or mis-localization of NPM1 promote chromosomal instability and oncogenic transformation, especially in hematological malignancies. HDAC5 is an epigenetic regulator that affects tumor-associated signaling pathways, cell cycle regulation, differentiation, and chromatin remodeling and transcriptional control. Together, these genes constitute crucial regulatory points in the growth of cancer and the integrity of cells.
| [6] | Guilford P, Hopkins J, Harraway J, McLeod M, McLeod N, Harawira P, et al. E-cadherin germline mutations in gastric cancer. Nature. 1998; 392: 402-405.
https://doi.org/10.1038/32918 |
| [7] | Christofori G, Semb H. The role of E-cadherin in epithelial-mesenchymal transition. Trends Biochem Sci. 1999; 24(2): 73-76. https://doi.org/10.1016/S0968-0004(98)01343-7 |
| [8] | Assmann V, Jenkinson D, Marshall JF, Hart IR. doiThe role of RHAMM in tumor cell motility. J Biol Chem. 1999; 274(41): 28999-29006. https://doi.org/10.1074/jbc.274.41.28999 |
[6-8]
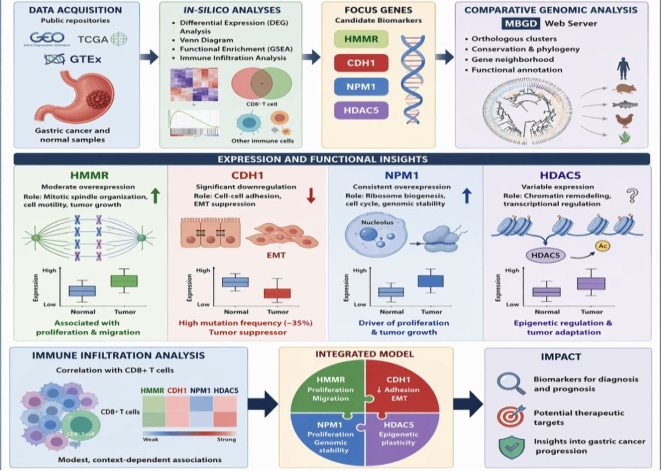
A comprehensive bioinformatics strategy was employed to investigate their biological significance using a range of tools and databases. (
Figure 1) The NCBI Gene Expression Omnibus (GEO) was the primary source of transcriptome datasets that were discovered using specific GSE accession numbers linked to different cancer types.
The initial PubMed literature review provided background information and previous findings for a contextual understanding of each gene's functional role.
Figure 1. Graphical abstract illustrating integrated in-silico analysis of HMMR, CDH1, NPM1, and HDAC5, highlighting differential expression, functional roles, immune associations, and their potential as diagnostic biomarkers and therapeutic targets in gastric cancer progression.
Differentially Expressed Gene (DEG) by Limma tool is helpful to specify genes that were significantly upregulated or downregulated between tumor and normal samples. The distribution of significant fold changes and p-values was displayed using volcano plots, while sample clustering and expression variation were displayed using Uniform Manifold Approximation and Projection (UMAP) plots.
To identify overlapping DEGs across datasets, BioVenn was utilized to generate Venn diagrams that visually represented shared and distinct genes between datasets. To ensure the accuracy and repeatability of the results, both systematic and non-systematic analyses were carried out. Functional enrichment utilizing Gene Set Enrichment Analysis (GSEA) identified the molecular processes and biological pathways affected by HMMR, CDH1, NPM1, and HDAC5. This makes it simpler to connect their expression to specific biological processes including cell adhesion, chromatin remodeling, mitosis, and DNA repair.
Additionally, Spearman correlation analysis depicts relationship between other significant biological indicators. In order to examine immunological relationships in the tumor microenvironment. Mutational and copy number alteration data (sCNA) were also analyzed to find structural genomic changes that might impact gene expression or function. Finally, Cancer Exploration tools were used to integrate data from multiple cancer types, providing a more complete picture of how these genes function in different types of cancer.
This work integrates expression profiling, correlation studies, immune infiltration analysis, and mutation assessment in an effort to produce a comprehensive molecular characterization of HMMR, CDH1, NPM1, and HDAC5. These results emphasize their distinct roles in tumor biology as well as potential connections within cancer signaling networks. Understanding these genes through multi-level bioinformatics tools could lead to the discovery of new biomarkers and therapeutic targets for improved cancer detection and therapy.
BIOVENN software was utilized to search for interactions between the DEGs after the functional analysis of the DEGs was completed utilizing the NCBI online program. Before being uploaded to the Connectivity Map database to search for small molecules, the DEGs in the interaction network were annotated using the GSEA.
The integration of differential gene expression analysis, functional enrichment, and immune infiltration profiling provides a comprehensive framework to understand the multifactorial nature of gastric cancer progression. In particular, the interaction between tumor cells and the immune microenvironment, including CD8+ T-cell infiltration, has emerged as a critical determinant of disease outcome and therapeutic response. However, the precise roles of HMMR, CDH1, NPM1, and HDAC5 within these interconnected pathways remain incompletely understood.
Therefore, the present study aims to perform an integrated in silico analysis and expression profiling of these four genes using publicly available transcriptomic databases and bioinformatics tools. By combining differential expression analysis, gene overlap assessment, pathway enrichment, and immune correlation studies, this work seeks to elucidate their functional significance and evaluate their potency gastric cancer biomarkers. Such insights may contribute to the development of more effective precision medicine strategies and targeted therapeutic interventions.
2. Materials and Methods
2.1. Obtaining Gene Expression Profile Through NCBI Database
Gastric cancer-associated transcriptomic datasets were systematically retrieved from the NCBI (https://static.pubmed.gov>portal) Gene Expression Omnibus (GEO) repository (https://www.ncbi.nlm.nih.gov>geo). Differential gene expression profiles of HMMR, CDH1, and NPM1 were analyzed using GEO2R, enabling robust comparison between tumor and matched normal tissue samples. Corresponding platform annotation files for each expression matrix were downloaded to ensure accurate probe-to-gene mapping. Stringent inclusion criteria were applied, restricting datasets to Homo sapiens samples. Quality control and normalization procedures inherent to GEO2R were employed to ensure data consistency, thereby facilitating reliable identification of significant transcriptional alterations associated with gastric cancer pathogenesis.
2.2. Differential Expression Analysis of Gastric Cancer Genes Through GEO2R
The differential expression of genes was analyzed using the GEO2R web-based platform available at the NCBI Gene Expression Omnibus (GEO) (https://www.ncbi.nlm.nih.gov/geo/). The GEO2R web-based tool utilizes the Bioconductor limma (Linear Models for Microarray Data) package implemented in R software for the comparison of expression profiles of genes in gastric cancer and normal tissue of stomach. Raw data of expression were automatically normalized using the GEO2R platform to reduce technical variation. The differentially expressed genes (DEGs) were obtained after setting the selection criteria based on the values of log2 fold change (log2FC) and p-values (Benjamini–Hochberg adjusted). The genes that met the statistical criteria mentioned above were considered as upregulated/downregulated. The distribution and significance of DEGs was visualized using volcano plot. Moreover, the comparative analysis of expression levels of the genes, which were defined as hallmarks of gastric cancer, namely, HMMR, CDH1, NPM1, and HDAC5 in the tumor and normal tissues was carried out using box plot. Additionally, UMAP (Uniform Manifold Approximation and Projection) clustering was performed to estimate sample heterogeneity and outliers.
2.3. Interpretation of Venn Diagrams Through BioVenn Web Source
To screen consistently dysregulated genes in multiple gastric cancer transcriptome datasets, differential expression genes (DEGs) were compared using BioVenn web server (http://bioinformatics.psb.ugent.be/webtools/venn/). FASTA sequences of HMMR (Accession Number: AAH57235.1), CDH1 (Accession Number: AAI46663.1), NPM1 (Accession Number: AAH09623.1) and HDAC5 (Accession Number: NP_001369322.1) were analysed in BioVenn Portal. Statistically significant DEGs obtained from each GEO dataset after performing differential expression analysis were exported and used as input in the BioVenn web server. Only those genes which fulfilled predefined criteria on basis of log2 fold change and adjusted p-value were used for reliable comparison analysis to avoid any possible errors. BioVenn tool performs comparison between multiple sets of genes and helps to identify common and unique genes through intersecting these gene lists. Area proportional Venn diagrams produced from this analysis provided an idea about level of similarity between DEG sets and helped to quickly determine the transcriptional similarities in independent gastric cancer data sets. Consistently dysregulated genes between multiple data sets were identified as highly reliable genes because of their similar pattern of expression in multiple data sets, while data set specific genes might show biological variation in data sets.
2.4. Analysis of Gene Set Functional Enrichment Through GSEA Website
For the identification of enriched gene set enrichment linked to the dysregulation of the selected gastric cancer hallmark genes, GSEA was applied in combination with the Molecular Signatures Database (MSigDB) (https://www.gsea-msigdb.org/gsea/). The differential expression profiles of HMMR, CDH1, NPM1, and HDAC5 genes were used for the determination of biological pathways and processes significantly enriched in these hallmark genes. Hallmark gene sets (H collection) and curated pathway collections (C2) available in the Molecular Signatures Database were used for the characterization of cellular functions involved in tumorigenesis and cancer development. For the enrichment analysis, biological pathways involved in cell cycle regulation, mitotic spindle organization, DNA replication and repair, epithelial-to-mesenchymal transition (EMT), cell adhesion, apoptosis, inflammatory signaling, and other biological processes connected to tumorigenesis were considered. For the assessment of the significance of enrichment, ranked lists were generated for the gene sets demonstrating significant enrichment in normalized enrichment scores (NES), nominal p-values, and false discovery rate (FDR) q-values. In addition, for the investigation of functional relations, the Spearman's rank correlation analysis was applied to determine the correlations between the expression levels of the target genes and gastric cancer-related molecular biomarkers. Correlation coefficients (ρ) and respective significance values were determined for the evaluation. Gene ontology, annotation, and pathway enrichment analysis conducted through the Gene Set Enrichment Analysis (GSEA) web tool discovered several biological processes and signaling pathways associated with the four candidate gastric cancer genes (HMMR, CDH1, NPM1, and HDAC5). The analysis conducted on the hallmark and curated gene sets from the Molecular Signatures Database (MSigDB) has revealed that the candidate genes play a part in various cancer-specific molecular functions associated with STAD. The enrichment analysis revealed an enrichment in cell cycle process, G2/M transition, mitotic spindle assembly, DNA replication, and DNA repair. This suggests that the candidate genes play a part in promoting cell proliferation and genome integrity. HMMR gene has shown enrichment in signaling pathways for mitotic progression, spindle formation, and chromosome segregation. This suggests its role in cell division. The enrichment in ribosome biogenesis, nucleolar organization, DNA damage response, and cell cycle regulatory processes was observed in the case of NPM1 gene.
CDH1, however, was enriched in biological processes such as cell-cell adhesion, adherens junction organization, epithelial cell differentiation, and epithelial-mesenchymal transition (EMT). Loss of CDH1 signaling led to epithelial dysfunction and increased migration capacity, which was expected during gastric cancer development. In turn, HDAC5 was enriched in functions and pathways such as chromatin remodeling, histone deacetylation, transcriptional regulation, epigenetic modification, and differentiation and apoptosis signaling.
Moreover, gene ontology annotations suggested that candidate genes were significantly associated with biological processes such as regulation of cell proliferation, protein localization, chromosome organization, intracellular signal transduction, immune regulation, and cellular stress response. Protein binding, ATP-dependent enzymatic activity, chromatin binding, cadherin binding, and structural molecule activity were found in molecular function analysis, whereas nuclear, nucleoplasmic, centrosomal, spindle apparatus, adherens junctions, and chromatin complexes were discovered as components where candidates were enriched. The results of correlation analysis carried out using GSEA showed a strong co-expression of the candidate genes with molecular biomarkers associated with the development of gastric carcinoma. The positive correlation was mostly found in the case of genes participating in cell cycle, replication, and mitosis, while the inverse correlation was revealed for genes controlling epithelial differentiation and adhesion. Overall, it means that the studied genes are components of bioprocesses including proliferation, epithelial plasticity, genome integrity, epigenetic regulation, and immunity involved in carcinogenesis and progression of adenocarcinoma of the stomach.
2.5. Analyzing Immune Cell Infiltration and Cancer Exploration in STAD Through TIMER Resource
In order to explore the associations between the expression of candidate genes and immune cell infiltration in stomach adenocarcinoma (STAD), a comprehensive analysis of both was conducted by utilizing Tumor Immune Estimation Resource (TIMER; https://compbio.cn/timer/), which is a systematic web-based platform analyzing the relationships of tumor-immune interactions based on The Cancer Genome Atlas (TCGA). In particular, the expression profiles of the candidate genes of hallmark of gastric cancer (HMMR, CDH1, NPM1, and HDAC5) were assessed with regard to their correlation with immune cell infiltration in the tumor microenvironment.
TIMER uses a deconvolution algorithm that estimates the proportion of infiltrating immune cells through bulk RNA sequencing while adjusting for tumor purity. The infiltrated levels of major immune cells such as B cells, CD4⁺ T cells, CD8⁺ T cells, macrophages, neutrophils, and dendritic cells were estimated for each gene expression using Spearman's rank correlation analysis. In order to better understand the immunogenomic landscape, Gene Module analysis was carried out to explore the association between target genes and well-known immune cell marker genes, which could further confirm the associations with particular immune cell populations.
Mutation analysis was carried out to analyze the impact of mutations in the selected candidate genes on immune cell infiltration in STAD samples. Also, Somatic Copy Number Alteration (SCNA) analysis was performed to assess the effect of genome variations such as deep deletion, arm-level deletion, diploid/normal copy number, arm-level gain, and high amplification on immune cell infiltration. Comparative statistical analyses among the SCNA groups were performed by using TIMER’s analysis system to detect significant differences in immune abundance. Combining immune infiltration, gene module, mutation and SCNA analyses provided a detailed analysis of the immune-genomic interactions, which helped in identifying potential immunological biomarkers and molecular mechanisms of gastric cancer progression and immune regulation.
3. Results
3.1. Retrieval of Gene Processing of Data Through NCBI Web Source
Gene sets data of HMMR protein (GSE34058), CDH1 protein (GSE51812), NPM1 protein (GSE4036), HDAC5 protein (GSE29327) has retrieved from NCBI database. For gene profiling of those proteins FASTA sequences are generated from GEO Profile at NCBI data source.
3.2. Analysis of Differential Expression (DEGs) Pattern of Gastric Cancer Genes Through GEO2R
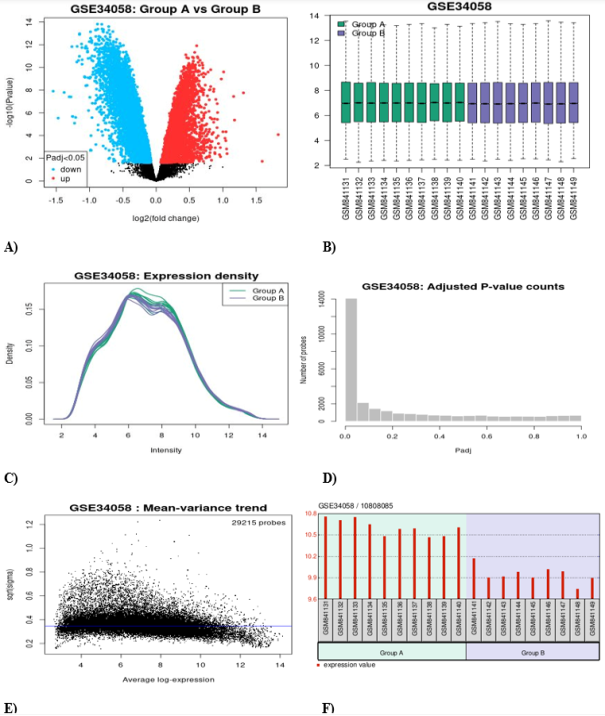
For analysis of Differentially Expressed Genes (DEGs) for above mentioned proteins GEO2R analysis have been done. For HMMR protein (GSE34058) dataset there are total 19 samples are present for DEGs analysis. 9 up-regulated samples and 10 down regulated samples among total of 19 samples are present for differential expressions. There are 3 up-regulated genes and 3 down regulated genes are selected for DEGs verification. 3 up-regulated genes for HMMR protein (GSE34058) are identified. Also 3 down regulated genes for HMMR protein (GSE34058) are identified. For up-regulated gene logFC of HMMR is 0.658 and for down regulation logFC of HMMR is -1.265. (
Figure 2A-F)
Figure 2. Differential expression analysis of HMMR in the GSE34058 dataset (19 samples; 9 up-regulated, 10 down-regulated) validated three up- and three down-regulated genes, with HMMR exhibiting logFC values of 0.658 and −1.265, respectively.
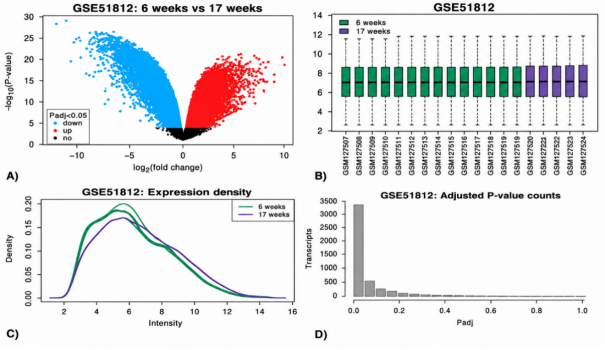
For CDH1 protein (GSE51812) dataset there are total 15 samples are present for DEGs analysis. 3 up-regulated samples and 12 down regulated samples among total of 15 samples are present for differential expressions. There are 3 up-regulated genes and 12 down regulated genes are selected for DEGs verification. (
Figure 3A-D)
Figure 3. DEGs OF CDH1: Three up-regulated and twelve down-regulated samples make up the 15 samples in the GSE51812 dataset for CDH1 protein that were used for DEG analysis. Twelve down-regulated genes and three up-regulated genes were chosen from these for validation.
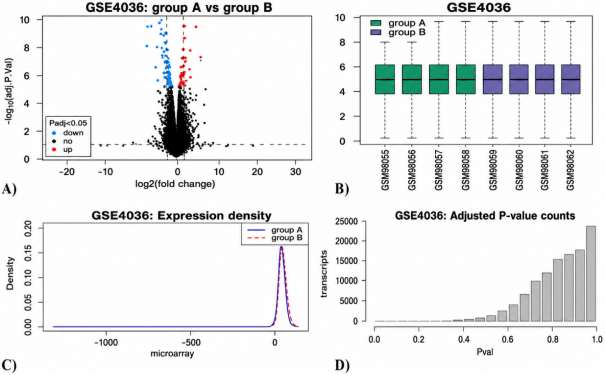
For NPM1 protein (GSE4036) dataset there are total 10 samples are present for DEGs analysis. 2 up-regulated samples and 8 down regulated samples among total of 10 samples are present for differential expressions. There are 2 up-regulated genes and 8 down regulated genes are selected for DEGs verification. (
Figure 4A-D)
Figure 4. DEGs OF NPM1: For NPM1 protein (GSE4036) dataset there are total 10 samples are present for DEGs analysis. 2 up-regulated samples and 8 down regulated samples among total of 10 samples are present for differential expressions. There are 2 up-regulated genes and 8 down regulated genes are selected for DEGs verification.
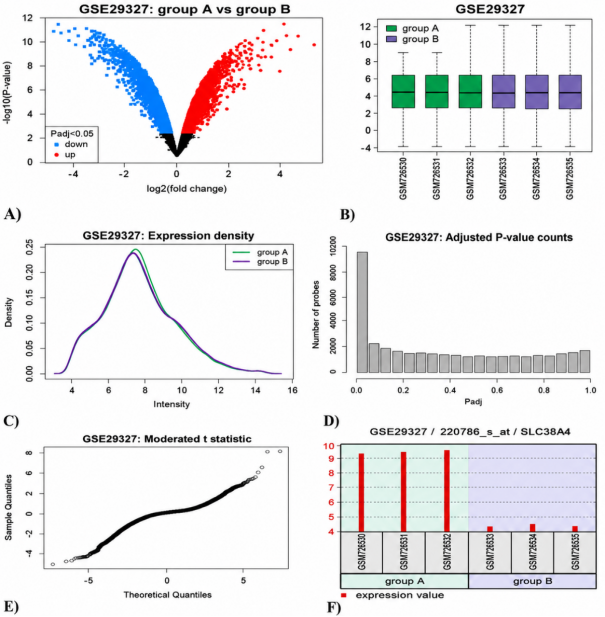
For HDAC5 protein (GSE29327) dataset there are total 12 samples are present for DEGs analysis. 7 up-regulated samples and 5 down regulated samples among total of 12 samples are present for differential expressions. There are 7 up-regulated genes and 5 down regulated genes are selected for DEGs verification. (
Figure 5A-F)
Figure 5. DEGs OF HDAC5: 12 samples total—7 up-regulated and 5 down-regulated—are included in the GSE29327 dataset for HDAC5 protein, which is utilized for differential gene expression (DEG) analysis. Seven up-regulated and five down-regulated genes were found and chosen for additional validation based on this analysis.
3.3. Generation of Venn Diagram Through BioVenn Portal
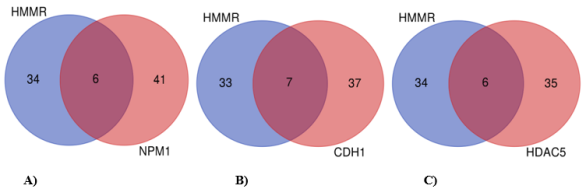
The respective datasets of endocytic genes CDH1, NPM1 and HDAC5 are analysed with HMMR gene separately for interpretation of area proportional to their overlapping regions. From the identification of Venn diagram of CDH1 and HMMR protein the number of unique elements is identified as 44 for CDH1 and 40 for HMMR protein, overall number of unique elements are 77 and the number of co-expressed genes is 7. (
Figure 6A-C)
The Venn diagram of NPM1 and HMMR protein identifies as the number of unique elements are 47 for NPM1 and 40 for HMMR protein, overall number of unique elements are 81 and the number of co-expressed genes is 6. Similarly, the Venn diagram shows the number of unique elements for HDAC5 is 41 in respect to 44 unique elements of HMMR, overall number of unique elements are 75 and the number of co-expressed genes is 6.
Figure 6. A) Symmetrical Venn Diagram. Venn Diagram of NPM1 analyzed with HMMR where out of 81 Up and down regulated genes – 34 were of HMMR, 41 of NPM1 and 6 co-expressed gene. B) Venn Diagram of CDH1 analysed with HMMR where out of 77 Up and down regulated genes – 33 were of HMMR, 37 of CDH1 and 7 co-expressed gene. C). Venn Diagram of HDAC5 analysed with HMMR where out of 75 Up and down regulated genes – 34 were of HMMR, 35 of HDAC5 and 6 co-expressed gene.
3.4. Candidate Biomarker and Gene Set Enrichment Analysis Through GSEA Web Server
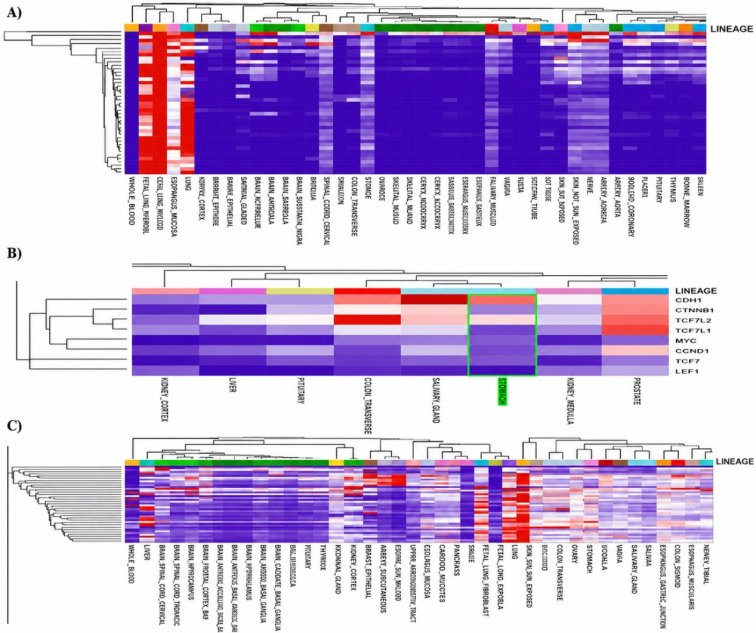
From Gene Set Enrichment Analysis (GSEA) there are Heat maps generated for HMMR, CDH1, NPM1 and HDAC5. The Heat maps of ontology gene-set HMMR has depicted as high gene expression rate. From Global Cancer Heat map of HMMR gene highest value is shown as -0.92757 and denoted by red bars and lowest value is -0.98852 which is denoted by blue bars. For CDH1 gene highest value is shown as -0.13070 and denoted by red bars and lowest value is -0.94270 which is denoted by blue bars. (
Figure 7A-C)
Figure 7. A) HMMR, B) CDH1 and C) NPM1 heat maps identified high expression intensity with values ranging from −0.92757 (highest) to −0.98852 (lowest), −0.13070 (highest) to −0.94270 (lowest) and −0.27480 (highest) to −0.98435 (lowest) respectively.A) HMMR, B) CDH1 and C) NPM1 heat maps identified high expression intensity with values ranging from −0.92757 (highest) to −0.98852 (lowest), −0.13070 (highest) to −0.94270 (lowest) and −0.27480 (highest) to −0.98435 (lowest) respectively.
For NPM1 gene highest value is shown as -0.27480 and denoted by red bars and lowest value is -0.98435 which is denoted by blue bars. So, HMMR and NPM1 have the similar Heat map values or intensity. The Gene Set Enrichment Analysis (GSEA) carried out on the candidate biomarkers HMMR, CDH1, NPM1, and HDAC5 showed significant enrichments in many biological processes and signaling pathways related to the development of gastric cancer, proliferation, ECM remodeling, immune system function, and apoptosis. Thus, the enrichments proved the participation of the above genes in key oncogenic processes regulating tumor initiation, invasion, metastasis, and response to therapy.
In particular, HMMR (Hyaluronan-Mediated Motility Receptor) has been found to have significant positive enrichments in cell cycle, mitotic spindle organization, DNA replication, G2/M checkpoint, EMT (epithelial-mesenchymal transition), ECM-receptor interaction, focal adhesion, PI3K-Akt pathway, and hyaluronan-mediated cell motility pathways. All of the enrichments show the regulatory role of HMMR in the processes of proliferation, migration, and invasion. The enrichments in mitotic checkpoint and chromosome segregation processes indicate the role of HMMR in the induction of genomic instability and uncontrolled tumor growth. Moreover, activation of ECM remodeling pathways shows an increase in the metastatic ability due to the enhanced capacity for tumor cell adhesion and migration.
On the other hand, CDH1 (E-cadherin) is mainly enriched in cell adhesion molecules (CAMs), adherens junctions, tight junctions, epithelial cell differentiation, Wnt signaling, apoptosis, and maintenance of epithelial integrity pathways. Gene enrichment analysis indicates that CDH1 has an important contribution to the maintenance of epithelial structure and inhibiting the metastatic spread. The reduced CDH1 enrichment is associated with EMT pathways activation, which reflects loss of cell-cell adhesions in the process of gastric cancer progression. Thus, these data confirm the known tumor-suppressor function of CDH1 and underline the significance of the gene for epithelial cell polarity and non-invasive properties.
The gene enrichment analysis of NPM1 (Nucleophosmin 1) showed the significant contribution to the ribosome biogenesis, RNA processing, nucleolar organization, DNA repair, cell cycle regulation, chromosome maintenance, MYC targets and p53 signaling pathways. The substantial enrichment of pathways related to protein synthesis and nucleoli functioning reflects the need for increased metabolism in fast proliferation of the tumor cells. The simultaneous enrichment in DNA damage response and checkpoint pathways suggests the participation of NPM1 in maintenance of genome integrity in parallel with the tumor growth.
Also, HDAC5 (Histone Deacetylase 5) was enriched for chromatin organization, transcription regulation, histone modifications, PI3K-Akt signaling, MAPK signaling, TGF-β signaling, regulation of apoptosis, immune response, and epithelial-mesenchymal transition pathways. This implies that HDAC5 acts as a significant epigenetic regulator affecting several downstream signaling pathways associated with the development of gastric cancer. The enrichment of the TGF-β and MAPK pathways indicates possible regulation of differentiation, proliferation, and migration, while the enrichment of the apoptosis-related pathways indicates transcriptional regulation of the programmed cell death through inhibition of pro-apoptotic genes.
3.5. Spearman’s Correlation Analysis Through TIMER Web Source
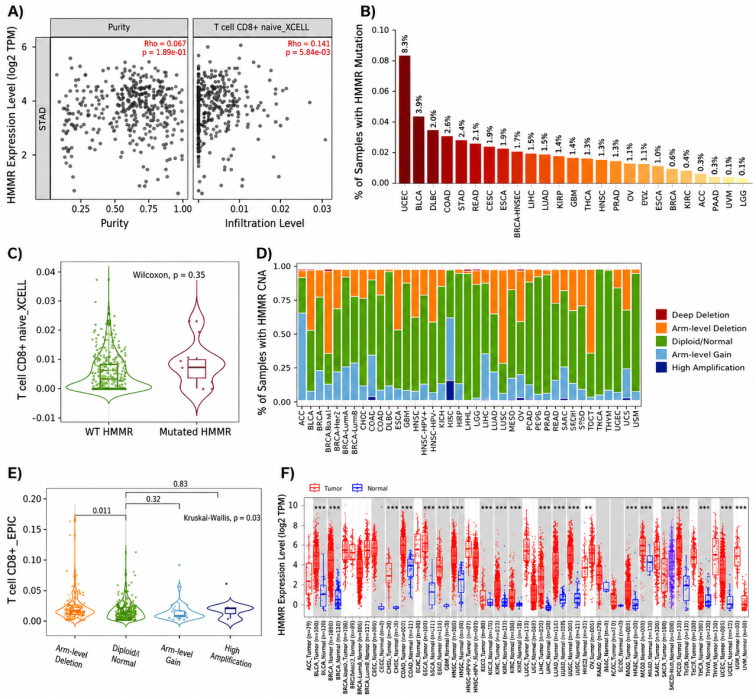
The Spearman's Rho value (ρ) for HMMR is 0.067 for purity and 0.141 for infiltration level in CD8+ T-cells, according to the Expression Immune Association graph. The Spearman's Rho value (ρ) is 0.067 for decreased HMMR expression levels for purity and -0.124 for CD8+ T-cell infiltration levels. Among 439 STAD patients, 8% of samples had an HMMR mutation. The highest Wilcoxon p value (0.36) for mutated HMMR above wild type HMMR in CD8+ T cells indicates that this is not statistically significant at the 0.05 significance level. With a P-value of 0.36, the likelihood that the null hypothesis is true is 36%. The lowest Wilcoxon p value of 0.12 for Mutated HMMR over Wild Type HMMR in CD8+ T cells indicates that the results are not statistically significant when applying the standard threshold of 0.05. This suggests that there isn't enough data to rule out the null hypothesis. (
Figure 8A-C) The percentage of samples with HMMR sCNA is approximately 0% for arm level gain, 0%–0.75% for diploid or normal, and 0.75%–1% for arm level deletion. The highest value of the HMMR gene is 0.136 for sCNA in CD8+ T cells, with a Kruskal-Wallis p value of 0.03. Because the Kruskal-Wallis p value of 0.03 is less than 0.05, it is considered statistically significant. As a result, the null hypothesis has a 3% chance of being rejected. The lowest value for sCNA in CD8+ T cells is -19.932 for the HMMR gene, with a Kruskal-Wallis p value of 0.01. Therefore, this Kruskal-Wallis p-value of 0.01 indicates very strong evidence to reject the null hypothesis, as it indicates a 1% chance of observing such data if the null hypothesis is correct. (
Figure 8D, E) The cancer analysis of candidate gastric cancer genes HMMR, CDH1, NPM1, and HDAC5 in stomach adenocarcinoma (STAD) by using the TIMER database illustrated the differential expression and immune infiltration features of these genes in the microenvironment of stomach adenocarcinoma. Analysis of differential gene expression showed that three candidate genes (HMMR, NPM1, and HDAC5) were abnormally expressed in STAD tumors relative to normal stomach tissues while one gene (CDH1) was expressed at a lower level compared to normal control samples, which is related to the well-known functions of the E-cadherin protein encoded by CDH1. This suggested the implication of these genes in different molecular mechanisms in the formation and development of gastric tumors. (
Figure 8F)
Figure 8. TIMER immune association analysis of HMMR revealed weak correlations with CD8+ T-cell infiltration (ρ = −0.124 to 0.141) and tumor purity (ρ = 0.067), limited immune variation across sCNA categories, no significant mutation-associated immune differences, and highly significant differential expression (***, p < 0.001) in gastric cancer.
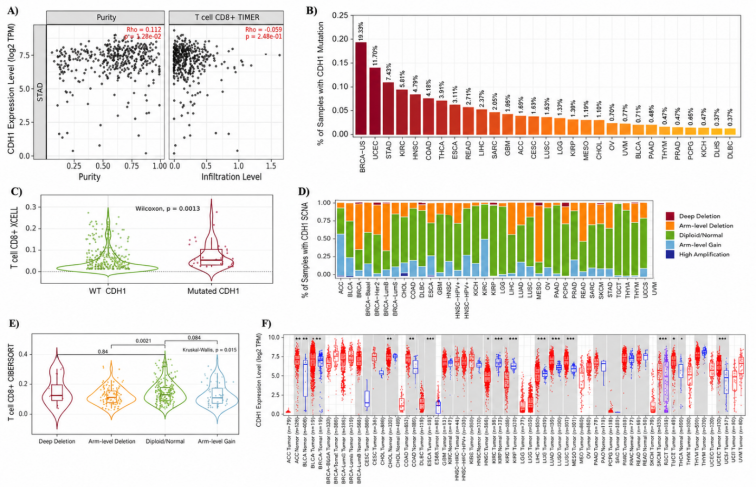
The Spearman's Rho value (ρ) for the greatest expression level of CDH1 in the Expression Immune Association graph is 0.127 for purity and -0.059 for infiltration level in CD8+ T-cell. The Spearman's Rho value (ρ) is 0.127 for decreased CDH1 expression levels for purity and -0.199 for CD8+ T-cell infiltration. (
Figure 9A-C) According to the percentage of samples with CDH1 sCNA, arm level gain is around 0%, diploid or normal is approximately 0%–0.75%, arm level deletion is approximately 0.75%–0.98%, and deep deletion is 1%. The CDH1 gene has a Kruskal-Wallis p value of 0.015 and the highest value for sCNA in CD8+ T cells is 0.174. Because it is less than the standard alpha threshold of 0.05, a Kruskal-Wallis p-value of 0.015 indicates statistical significance and rejects the null hypothesis. HMMR: CD8⁺ T cell infiltration quantified by EPIC showed statistically significant differences across the copy number alteration categories (Kruskal–Wallis, P = 0.03). The arm-level deletion group was found to have greater variability in terms of CD8⁺ T cell infiltration than the diploid/normal category. In pairwise comparisons, there was a statistically significant difference between the arm-level deletion group and the diploid/normal group (P = 0.011), but no statistically significant differences between the diploid/normal group and the arm-level gain group (P = 0.32) and between the diploid/normal group and the high amplification group (P = 0.83).
The CDH1 gene has a Kruskal-Wallis p value of 0.23 and the lowest value for sCNA in CD8+ T cells is -19.932. Therefore, the null hypothesis cannot be rejected because the Kruskal-Wallis p-value of 0.23 shows no statistical significance. (
Figure 9D, E) In terms of immune infiltration, the expression of the candidate genes turned out to be correlated with the number of various immune cell types present in STAD tumors. Correlation with tumor purity and numbers of various immune cells, including B cells, CD4⁺ T cells, CD8⁺ T cells, macrophages, neutrophils, and dendritic cells, showed that the genes possessed distinct immune infiltration features. Positive correlation of the expression of HMMR with many immune cells, especially with macrophages and dendritic cells, suggested its immune and inflammatory involvement. CDH1 was correlated weakly with immune responses but remained strongly associated with immune interactions related to epithelial cell integrity. NPM1 had moderate correlations with adaptive immune cells, such as CD4+ and CD8+ T lymphocytes, pointing towards immune response activation and tumor immune surveillance. HDAC5 had correlations with multiple immune cell types, confirming the involvement of this gene in epigenetic regulation of immune responses in gastric cancer development. (
Figure 9F)
Figure 9. TIMER immune association analysis of CDH1 demonstrated significantly higher CD8+ T-cell infiltration in mutated versus wild-type tumors (Wilcoxon p = 0.0033), limited immune variation across sCNA categories, and highly significant differential expression (***, p < 0.001) in gastric cancer.
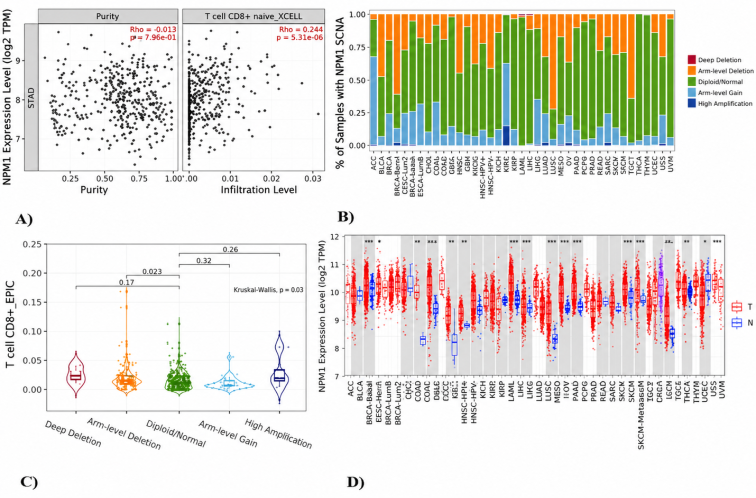
The Spearman's Rho value (ρ) for the greatest expression level of NPM1 in the Expression Immune Association graph is -0.013 for purity, and 0.294 for infiltration level in CD8+ T cells. The Spearman's Rho value (ρ) for the lower expression level of NPM1 expression level for purity is -0.013, and the Spearman's Rho value (ρ) for the infiltration level in CD8+ T-cell is -0.029. (
Figure 10A) High amplification is around 0%, arm level gain is approximately 0%, diploid or normal is approximately 0%-0.75%, arm level deletion is approximately 0.75%-1%, and deep deletion is approximately 1% of samples with NPM1 sCNA. The CDH1 gene has a Kruskal-Wallis p value of 0.03 and a maximum value of 0.99 for sCNA in CD8+ T cells. Since there is only a 3% probability of getting such findings if they were actually equal with a shared significance level of 0.05, a Kruskal-Wallis p-value of 0.03 shows a statistically significant difference between the groups. This means you may reject the null hypothesis that all group medians are the same. There was also significant variation in CD8+ T-cell infiltration in different groups of genomic alterations in the analysis of CDH1 sCNAs performed via the CIBERSORT method (Kruskal-Wallis test, P = 0.015). The deep deletion group had relatively higher CD8+ T-cell infiltration compared to other groups of genomic alterations. There was a highly significant difference between the arm-level deletion and diploid/normal groups (P = 0.0021) but not significant difference between arm-level deletion and deep deletion (P = 0.84) and diploid/normal and arm-level gain (P = 0.084).
The NPM1 gene has a Kruskal-Wallis p value of 0.001 and a lowest value of -19.932 for sCNA in CD8+ T cells. Kruskal-Wallis p-value of 0.001 typically refers to p < 0.001 or a similarly very small number indicating a highly statistically significant result. The interpretation of a p-value of 0.001 have sufficient evidence to reject the null hypothesis. In the case of NPM1, EPIC-based sCNA analysis has revealed significant differences in CD8⁺ T-cell infiltration among various copy number groups (Kruskal-Wallis test, P = 0.03). (
Figure 10B, C) Gene module analysis reinforced these observations through identification of correlations between the candidate genes and previously known immune cell marker genes of macrophages, dendritic cells, T lymphocytes, neutrophils, and B lymphocytes. Thus, the expression networks between the candidate genes and multiple immune cell populations were found, revealing their possible involvement in immune-related biological processes in the tumor microenvironment of the stomach. (
Figure 10D)
Figure 10. TIMER immune association analysis of NPM1 revealed a moderate positive correlation with CD8+ T-cell infiltration (ρ = 0.294), negligible correlation with tumor purity (ρ = −0.013), limited immune variation across sCNA categories, and significant differential expression (**, p < 0.01) in gastric cancer.
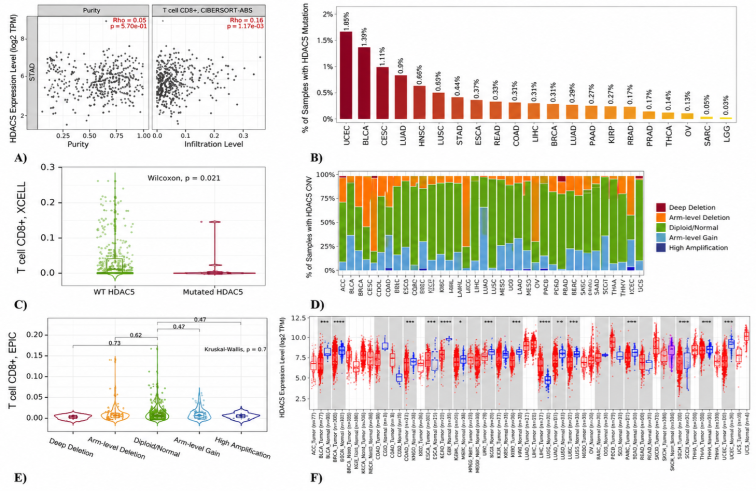
The Spearman's Rho value (ρ) for the highest expression level of HDAC5 expression level for purity is 0.029, and the Spearman's Rho value (ρ) for the infiltration level in CD8+ T-cell is 0.166. The Spearman's Rho value (ρ) for purity at lower HDAC5 expression levels is 0.029 and infiltration level in CD8+ T-cell the Spearman’s Rho value (ρ) is -0.257. (
Figure 11A-C) High amplification group exhibited higher infiltration by CD8⁺ T-cells than the diploid/normal and arm-level gain groups. Comparisons between individual groups have indicated significant differences between the arm-level deletion group and arm-level gain group (P = 0.023), but no significance was noted between the arm-level deletion and diploid/normal (P = 0.17), diploid/normal and arm-level gain (P = 0.32), and arm-level gain and high amplification (P = 0.26) groups.
The percentage of samples with HDAC5 sCNA shows that arm level gain is around 0%–0.25%, arm level deletion is approximately 0.75%–1%, diploid or normal is approximately 0.25%–0.75%, and high amplification is approximately 0%. The HDAC5 gene has a Kruskal-Wallis p value of 0.7 and a maximum value of -0.63 for sCNA in CD8+ T cells. Since it is greater than 0.05, a Kruskal-Wallis p-value of 0.7 (or 0.779) is not statistically significant, indicating that the null hypothesis cannot be rejected. The HDAC5 gene has a Kruskal-Wallis p value of 0.12 and a lowest value of -4.542 for sCNA in CD8+ T cells. The null hypothesis cannot be rejected since the Kruskal-Wallis p-value of 0.12 shows no statistically significant difference between the group medians. Conversely, HDAC5 displayed negligible effects of copy number changes on CD8⁺ T-cell infiltration. (
Figure 11D, E) Mutation profiling showed that genomic changes in HMMR, CDH1, NPM1, and HDAC5 were linked with different patterns of immune infiltration in STADs. The somatic mutations in the candidate genes impacted the number of infiltrating immune cells, which suggests a role of genetic changes in immune microenvironment remodelling. In addition, SCNA analysis revealed that deep deletions, arm-level deletions, diploid state, arm-level gain, and high-level amplifications yielded different immune infiltration signatures within the studied tumors. Significant variations in immune cell abundance were noted among certain SCNA types, especially macrophages, dendritic cells, and T-cell populations, indicating that immune cell recruitment is influenced by copy number alterations. (
Figure 11F)
Figure 11. TIMER immune association analysis of HDAC5 revealed a moderate positive correlation with CD8+ T-cell infiltration (ρ = 0.166), negligible correlation with tumor purity (ρ = 0.029), limited immune variation across sCNA categories, and significant differential expression (***, p < 0.001) in gastric cancer.
Among 439 STAD patients, 8% of samples had an HMMR mutation. Among 439 STAD patients, 35% of samples had a CDH1 mutation. NPM1 gene mutations in STAD patients have not been identified. Among 439 STAD patients, 12% of samples had an HDAC5 mutation. At the 0.05 significance level, the highest Wilcoxon p value of 0.36 for mutated HMMR above wild type HMMR in CD8+ T cells indicates that this is not statistically significant. With a P-value of 0.36, the null hypothesis has a 36% chance of being true. The lowest Wilcoxon p value of 0.12 for mutated HMMR above wild type HMMR in CD8+ T cells indicates that the results are not statistically significant when applying the standard cutoff of 0.05. This indicates a lack of strong evidence to reject the null hypothesis. The highest Wilcoxon p value of 0.0033 for mutated CDH1 above wild type CDH1 in CD8+ T cells indicates that the finding is statistically significant at the 0.05 significance level. The null hypothesis is rejected, according to the P-value of 0.0033. The lowest Wilcoxon p value of 0.068 for mutated CDH1 above wild type CDH1 in CD8+ T cells suggests that the result is not statistically significant at the 0.05 significance level. The ¹-value of 0.068 indicates that the null hypothesis is usually not rejected. There is no known mutation analysis for the NPM1 gene. The highest Wilcoxon p value of 0.38 for mutated HDAC5 above wild type HDAC5 in CD8+ T cells indicates that the data are not statistically significant at the 0.05 significance level, and as a result, the null hypothesis would not be rejected. The lowest Wilcoxon p value of 0.021 for Mutated HDAC5 over Wild Type HDAC5 in CD8+ T cells indicates that the results are statistically significant at the 0.05 significance level, and as a result, the null hypothesis is rejected.
The results from the EPIC analysis did not show any significant overall relationship amongst the five sCNAcategories (Kruskal–Wallis, P = 0.70). Similarly, there was no significance for pairwise comparisons between arm level deletions vs diploid/normal (P = 0.23), diploid/normal vs arm level gains (P = 0.62), diploid/normal vs high amplifications (P = 1.00), and arm level gains vs high amplifications (P = 0.47). This suggests that the relatively consistent pattern of CD8⁺ T-cell infiltration amongst all the HDAC5 copy number states reflects low effects of HDAC5 genomic changes on immune infiltration in STAD.
Collectively, the TIMER sCNA analysis demonstrated significant relationships between somatic copy number alterations and CD8⁺ T-cell infiltration for HMMR, CDH1, and NPM1, while HDAC5 had no significant immune infiltration changes between copy number states. This implies that copy number alterations of specific genes related to gastric cancer differently affect immune infiltrations in stomach adenocarcinomas.
Overall, the cancer exploration study using TIMER indicated that the gene expression, immune infiltration, mutational signature, and immune response induced by copy number alterations of HMMR, CDH1, NPM1, and HDAC5 are highly variable in STAD. These integrative results showed abundant interactions between immune cells and genomic features with respect to the selected candidates and highlighted their biomarker potential in gastric cancer.
4. Discussion
The integrative in silico analysis highlights distinct yet interconnected roles of HMMR, CDH1, NPM1, and HDAC5 in gastric cancer pathogenesis, emphasizing a coordinated molecular network rather than isolated gene effects. The significant downregulation of CDH1, which encodes the cell adhesion molecule E-cadherin is effective for Gastric Cancer downregulation. Loss of CDH1 disrupts epithelial integrity and promotes EMT. The observed high mutation frequency (~35%) further substantiates its role as a classical tumor suppressor, whose functional loss contributes to disease progression and poor prognosis.
In contrast, NPM1 demonstrates consistent overexpression across datasets, suggesting its involvement in enhanced cellular proliferation and genomic instability. As a multifunctional nucleolar protein regulating ribosome biogenesis and cell cycle progression, its dysregulation likely drives oncogenic transformation. The persistent upregulation of NPM1 positions it as a potential driver gene, contributing to uncontrolled tumor growth in gastric cancer.
HMMR, although moderately overexpressed, exhibits significant functional relevance due to its involvement in mitotic spindle organization and cell motility. These roles implicate HMMR in both proliferative and migratory capacities of cancer cells. Despite relatively weak statistical correlations with immune parameters, its contribution to structural and signaling pathways suggests a supportive role in tumor progression, potentially acting in concert with other oncogenic regulators.
HMMR contributes to tumorigenesis through its involvement in mitotic spindle dynamics and cellular motility, supporting both proliferative and invasive phenotypes. Although its immune correlations remain modest, its functional significance within cytoskeletal organization and signaling pathways suggests a cooperative role in cancer progression. In parallel, HDAC5 reflects the importance of epigenetic regulation, with its variable expression patterns indicating dynamic chromatin remodeling and transcriptional modulation that enable tumor adaptability and survival.
HDAC5 introduces an additional epigenetic dimension to gastric tumorigenesis. Its variable expression patterns indicate dynamic regulation of chromatin remodeling and transcriptional control. As a member of the histone deacetylase family, HDAC5 may influence gene expression programs associated with tumor survival, differentiation, and adaptation. This observation reinforces the concept that gastric cancer progression is governed by both genetic alterations and epigenetic reprogramming.
Furthermore, immune infiltration analysis reveals modest associations between these genes and CD8+ T-cell infiltration, indicating a potential influence on tumor–immune interactions. However, the lack of consistent statistical significance suggests that immune modulation is complex, multifactorial, and highly context-dependent, requiring further investigation.
Collectively, these findings support a multifaceted model of gastric cancer progression, wherein CDH1 loss facilitates metastasis, NPM1 overexpression drives proliferation, HMMR contributes to structural and migratory dynamics, and HDAC5 regulates epigenetic plasticity. The integration of differential expression analysis, Venn-based overlap assessment, pathway enrichment, and immune profiling underscores the complexity of the underlying molecular landscape. These genes emerge as promising diagnostic biomarkers and potential therapeutic targets.





 Share This Article
 Twitter
 Linked In
 Facebook
 Copy
Copy Download