2. Materials and Methods
2.1. Experimental Site
The experimental works such as, mineral contents, anti-nutritional factors, physico-chemical properties, and sensory evaluation of injera were carried out at Central laboratory, Haramaya University. All proximate analysis was carried out at the animal nutrition laboratory, School of Animal Science, Haramaya University.
2.2. Experimental Material
Twenty five kilograms of fresh potato (bubbu) varieties, which was released in 2001, and twelve kilograms of sorghum grain (muyra2) variety, which was released in 2000, was collected from Haramaya University Agricultural Research Center (HUARC). Six kilograms of barley grain, (golden eye) varieties, which was released in 2012, collected from Fadis Agricultural Research Center (FARC). Starter culture (Ersho) was prepared at the Department of Food Science, and Post-harvest Technology Laboratory, Haramaya University.
2.3. Experimental Plan
The experiments were conducted in two factorial designs of 4×3, namely fermentation duration (T) and blending ratio of (B). Blending ratio (B) had four levels and fermentation duration had three levels. Fermentation duration levels were 24, 48 and 72 hours, based on previous research by
| [17] | L. Yegrem, S. Abera, and M. Temesgen, “Nutritional composition and sensory quality of injera prepared from tef (Eragrostis tef (Zucc) Trotter) complemented with lupine (Lupines spp.),” 2021, https://doi.org/10.1080/23311932.2020.1862469 |
[17]
. During times of fermentation, batch type or back slope types of fermentation was used. The total amount of blending flour, which was used for dough preparation, was 400 g, which was used for each experimental treatment, while 100% of sorghum flour was used as a control unit and denoted by B0
. The combinations of flour proportions, which were used for dough preparation were 80% of sorghum, 15% of barley and 5% of potato flours giving a blending ratio (80:15:5), denoted by B1; 70% of sorghum, 20% of barley and 10% of potato flours giving a blending ratios (70:20:10) denoted by B2 and about 50% of sorghum, 25% of barley and 25% of potato flours forming a blending ratio (50:25:25), which was denoted by B3. The experimental treatment was carried out in triplicate.
Table 1. Experimental plan.
Fermentation Duration | Blending Ratio |
B0 | B1 | B2 | B3 |
T1 | T1B0 | T1B1 | T1B2 | T1B3 |
T2 | T2B0 | T2B1 | T2B2 | T2B3 |
T3 | T3B0 | T3B1 | T3B2 | T3B3 |
Where:
T1 = 24 hour, T2 = 48 hour, T3 = 72 hour, B0 = Control with blending ratio of 100% sorghum, B1 = Blending Ratio of 80:15:5, B2 = Blending Ratio of 70:20:10, and B3 = Blending ratio of 50:25:25.
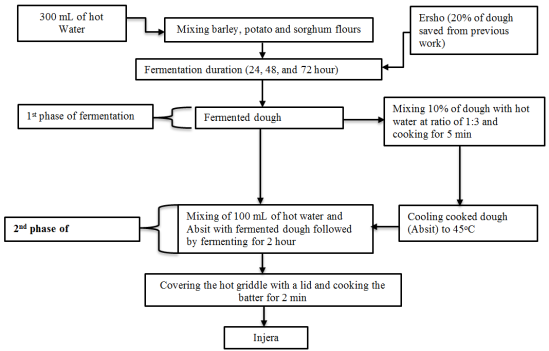
Figure 1. Flow chart for injera making.
2.4. Preparation of Samples
2.4.1. Preparation of Sorghum Flour
The preparation of sorghum flours was done in a public milling house, which was found in Bate. Ten kilograms (12 kg) of Sorghum grains (Muyra2 varieties) were cleaned by methods of dry cleaning to remove stones and other trace materials, then washed in clean water to remove unwanted material, which was not eliminated by dry cleaning. Then, it was dried in the sun for 30 min. The dried sorghum was weighed and milled into flour by a disc mill. Before milling the actual sample, 2 kg of sorghum grain was milled to remove remnants of previous flour from the flour mill to prevent contamination. Lastly, the flour samples were sealed, placed in polyethylene bags, and kept at room temperature (25°C) until they were required for additional processing and analysis
| [18] | K. Alawode, M. A. Idowu, A. A. Adeola, E. K. Oke, and S. A. Omoniyi, “Some quality attributes of complementary food produced from flour blends of orange fleshed sweetpotato, sorghum, and soybean,” Croat. J. Food Sci. Technol., vol. 9, no. 2, pp. 122-129, 2017, https://doi.org/10.17508/cjfst.2017.9.2.06 |
[18]
2.4.2. Preparation of Barley Flour
The preliminary preparation of barley grain was traditionally performed. The whole barley grain (golden eye variety) was assessed for any kind of defects and overall quality to the experimental analysis. Barley grain, which is free from defects and fulfills requirements for experimental work, was cleaned to remove unwanted material. This was done by a dry cleaning method followed by wet cleaning. Then, cleaned barley grain was conditioned or tempered for about 4 hours to 16% of moisture content. Then it was traditionally decorticated by a mortar and pestle to remove the hulls from the barley kernel. After that, drying was done by sun drying for about 45 min and separation of barley kernel from hull was done by winnowing. The prepared barley kernel was milled by a disc mill. For additional processing and experimental investigation, barley flour was sealed in polyethylene bags and kept at room temperature
.
2.4.3. Preparation of Potato Flour
Twenty five kilograms (25 kg) of potato tuber (bubbu variety) was selected for the experiment, and the basic flour processing were: cleaning/sorting, peeling, slicing, blanching, cooling, drying, crushing/milling and screening of final flours
| [20] | Z. Zhang, C. C. Wheatley, and H. Corke, “Biochemical changes during storage of sweet potato roots differing in dry matter content,” Postharvest Biol. Technol., vol. 24, no. 3, pp. 317-325, 2002. |
[20]
.
2.5. Sorghum, Barley and Potato Based Injera Development
Injera was made according to the modified method of
| [21] | A. B. Bhuiyan, M. J. Ali, A. A. M. Kassim, Z. Alias, and A. N. Munir, “Mission Drift and Sustainability of the Microfinance Institutions: A Methodological Review,” 2020. |
[21]
. Starter culture (Ersho) was made at Food Science and Post-harvest Technology Laboratory by using 200 g flour blended at the ratio 60:20:20 by percent of sorghum, barley, and potato flour respectively. About 500 g of composite flour with proper blending ratios of sorghum, barley, and potato flours was mixed with 600 mL of hot water, then starter culture (Ersho) mixed and kneaded for 6 min. Dough was fermented for desired duration (24, 48 and 72 hours), for the first phase of fermentation. After the initial fermentation, 10% of the fermented dough was combined with hot water in a 1: 3 ratio, boiled for 5 minutes, and Absit was formed. After allowing it to cool to 45 degrees Celsius, the Absit was added to the fermented dough and thoroughly mixed with 300 mL of hot water at the same temperature. The batter underwent a second stage of fermentation, which lasted for two hours. Injera was finally prepared by pouring the fermented batter onto a hot griddle, covering it for three minutes, and then manually lifting it off of the hot griddle. The injera was cooled to room temperature and stored in storage material which was traditionally made from grass until it was served for sensory evaluation
| [21] | A. B. Bhuiyan, M. J. Ali, A. A. M. Kassim, Z. Alias, and A. N. Munir, “Mission Drift and Sustainability of the Microfinance Institutions: A Methodological Review,” 2020. |
[21]
. Samples for laboratory analyses were kept in deep freeze to ensure the integrity of its contents.
2.6. Proximate Analysis of Flours of Sorghum, Barley, Potato and Composite Injera and Total Energy
2.6.1. Moisture Content
The moisture content of the prepared flour and injera sample were determined based on AOAC, (2000) official method 925.09. The empty moisture test dish was weighed (W1). The Sample weighed (W2) and dried at 60°C for 6 hours. Then it was cooled in a desiccator. The test dish and dried sample were weighed together (W3). Finally, the percentage of moisture content in injera was computed as:
Moisture Content (%) =(1)
Where: W1 is the dish's mass (g), W2 is the mass of sample and container (g) and W3 is the mass of sample and container after drying (g).
2.6.2. Crude Fat
The fat content of the food sample was evaluated by the soxhlet method of extraction following the procedures of AOAC, (2000) official method 979.09. Before being siphoned and returned to the boiling flask, the hexane solvent was poured to the extraction chamber and completely encircled the sample. This took five to ten minutes. The soxhlet, extraction thimble, extraction chamber and desiccators are all equipment used for overall fat extraction
| [23] | W. Horwitz, Official methods of analysis of AOAC International. Volume I, agricultural chemicals, contaminants, drugs/edited by William Horwitz. Gaithersburg (Maryland): AOAC International, 1997, 2010. |
[23]
. After being cleaned and dried, the extraction chamber was weighed in W1. Another layer of fat-free cotton was placed over the extraction thimble that held the 2 g of sample (W), which was primarily weighed. After that, the thimble was put inside the extraction chamber, and the extraction cylinder that had been cleaned and dried was taken out of the desiccator and put into the flask holder. The extraction cylinder was filled with roughly 50 mL of ether before being placed into the heating plank. For almost four hours, the extraction was conducted at 55°C. After being separated, the extraction cylinder was dried in an oven set to 70°C for roughly half an hour. After that, it was put in a desiccator to chill for roughly half an hour. The extraction cylinder was finally taken out of the desiccator and weighed (W2). The crude fat percentage was computed as follows:
Crude Fat(2)
Where: W1 = Weight of extraction cylinder (g); W2 = The weight of the dried crude fat and the extraction cylinder in (g) and W= Sample weight in (g)
2.6.3. Crude Protein
Protein content was determined based on AOAC, (2000) official method 979.09. After weighing 0.5 g of the sample, 6 mL of an acid combination (5% concentrated Orthophosphoric acid and 95% sulfuric acid) was added to each digestion tube and thoroughly mixed. After that, 3.5 mL of 30% hydrogen peroxide was added until violet reactions were observed. Each tube was filled with 3 g of the catalyst combination (0.5 g of ground selenium and 100 g of potassium sulfate), which was left for roughly 10 minutes prior to digestion. After four hours, the digestion was carried out until a clear solution was achieved. By adding 25 mL of di-ionized water, the precipitation of sulfate in solution was prevented. Using 2% boric acid and 40% NaOH, the sample solution was digested and diluted before being distilled. After that, the distillate was titrated with 0.1N HCl acid until a reddish hue developed. The calculation for the crude protein's nitrogen value was:
Nitrogen (%)(3)
Protein % = 6.25(4)
2.6.4. Ash Content
The ash content was determined based on
| [22] | AOAC, “Official Methods 925.09,” Assoc. Off. Anal. Chem., vol. 1, no. Official Analytical Int, pp. 1-1213, 2000. |
[22]
. The dried porcelain crucible, which has been washed by distilled water, was placed into a muffle furnace at about 550 C° and it was burned for about 30 min. TThe crucible was then allowed to cool at ambient temperature for almost half an hour. After weighing the crucible (M1), cooling crucible, and 3 g of sample combined (M2), the sample was completely burned in a fume hood until smoking stopped. For almost four hours, the sample was kept at 550 C° in a muffle furnace. After roughly an hour of cooling, it was weighed (M3).
Total Ash (%)(5)
Where: (M2-M1) = Sample weight on a dry basis and (M3-M1) = Ash weight
2.6.5. Crude Fiber
Crude fiber content was analyzed based on the official method
| [22] | AOAC, “Official Methods 925.09,” Assoc. Off. Anal. Chem., vol. 1, no. Official Analytical Int, pp. 1-1213, 2000. |
[22]
. A new 3 g (W1) sample was added to a 700 mL beaker. After adding roughly 200 mL of 1.25 percent H
2SO
4, it boiled for about half an hour. After adding roughly 20 mL of 20% KOH, the mixture was cooked for an additional 30 minutes. The residue in the crucible was cleaned with hot distilled water and then filtered twice. The residue was filtered once more after being cleaned with 1% H
2SO
4 and then rinsed with 1% KOH. Lastly, water-free acetone was used to wash the residue. After being dried for approximately two hours at 130 degrees Celsius in an oven dryer, the crucible containing the sample was cooled for approximately half an hour in a desiccator before being weighed (W2). After being heated to 550 C° for approximately 30 minutes in a muffle furnace, the crucible was cooled in a desiccator and its contents were weighed (W3). This is how the crude fiber was calculated.
Crude fiber content (%) =(6)
Where: W1 is the fresh Sample Weight, W2 is the weight of the crucible and sample following oven drying, and W3 is the weight of the crucible and sample following ashing
2.6.6. Utilizable Carbohydrate
This is how the utilizable carbohydrate was calculated:
%Utilizable Carbohydrate (%) = 100% - (% moisture + % protein % fat+ % fiber + % ash)(7)
2.6.7. Total Energy
Total energy was obtained by the conversion of 4, 9 and 4 kcal for each gram of crude protein, crude fat and carbohydrate, respectively
| [24] | T. T. T. Nguyen, G. Loiseau, C. Icard-Vernière, I. Rochette, S. Trèche, and J.-P. Guyot, “Effect of fermentation by amylolytic lactic acid bacteria, in process combinations, on characteristics of rice/soybean slurries: A new method for preparing high energy density complementary foods for young children,” Food Chem., vol. 100, no. 2, pp. 623-631, 2007. |
[24]
.
Energy (Kcal/100g) = [(8)
2.7. Mineral Analysis
2.7.1. Iron
Iron was evaluated by the Atomic absorption spectrophotometer method
| [25] | AACC, Approved methods of the American association of cereal chemists, vol. 1. Amer Assn of Cereal Chemists, 2000. |
[25]
. The crucible was pre-ignited at 550°C and cooled in a desiccator. The empty crucible was weighed and coded with a number so the weight of each crucible was recorded. A sample weighing around 3 g was put into a crucible. The sample in a crucible was heated at 550 °C in a muffle furnace for 4 hours, or until ashing developed. After cooling in a desiccator, the crucible and ash were weighed together, and the outcome was once more noted. Five milliliters of diluted 0.1M HCl were used to dissolve the ash. After that, the solution was filtered into a volumetric flask using premium filter paper. After being redissolved in 20 milliliters of 1M HCl, the residue was filtered into 100 milliliters of volumetric flasks. Then it was read by the Atomic absorption spectrophotometer (510 nm). Iron content was computed as:
(9)
Where: C = Concentration of sample in ppm; DF = dilution factor; 10 = conversion factor when 10 ml was evaluated from 100 ml.
2.7.2. Zinc
The same procedure to iron analysis was followed. Zink content was computed as:
Zink(10)
Where: Cs = Concentration of analyte, Cb = Concentration of blank, V = Initial volume (100 ml), D = Dilution factor and S = Mass of the sample (g).
2.7.3. Calcium
Sample was weighed and charred on a hot plate, and then it was ashed. The sample was cooled and a few drops of strong HCl were added if ashing could not be finished. After drying, the sample was re-ashed. After that, 5 mL of strong HCl was used to break it up and dissolve it. Using a steam bath, the solution was cooked and then evaporated. After dissolving the residue in HCl once more, the mixture was filtered into a volumetric flask. After washing, the paper and residue were diluted to the 100 mL threshold. A stock solution of lanthanum (La) was added. Next, a typical calcium solution was made. Lastly, using an absorption spectrometer, the absorbance of the sample and the standard solution was measured at 422.1 nm.
| [26] | Kebede Dida, “Comparison Of Finger Millet Varieties for Production Of Injera And Its Physicochemical, Antioxidant And Sensory Properties Msc. Thesis Kebede Dida Ariti,” 2022. |
[26]
. Calcium content was computed as:
(11)
Where: Cs = Concentration of analyte; Cb = Concentration of blank; initial volume; D = Dilution factor and S = Mass of sample (g).
2.8. Anti-nutritional Contents and pH value
2.8.1. Phytic Acid
The sample of flours were weighed and added with trichloro acetic acid, in a water bath. Then supernatant was used for estimation of phytate. The FeCl
3 was added to the sample solution and stirred well. The decanted and precipitated supernatant was washed tri-chloro acetic acid, HCl and distilled water. Precipitation was digested by H
2SO
4. Then phosphorus converted into phosphate. Lastly, phytate phosphorus (Phytate = P *3.55) was used to quantify phytate.
| [27] | M. A. A. Gonzales, “Establishment of High-Throughput Techniques For Studying Starch Functionalities,” 2019, Purdue University Graduate School. |
[27]
. The calculation of phytic acid was:
(12)
Where: W is the initial sample's mass; As is the sample's absorbance; and Ab is the blank matter's absorbance.
2.8.2. Tannin
The reagent vanillin-HCl was made. The samples were weighed and placed into conical flasks. After adding the concentrated HCl, the conical flask was centrifuged after being shaken constantly for roughly 20 min. The vanillin-HCl test tube was filled with the supernatant. After 20 min of incubation at 30°C, the absorbance at 450 nm was measured using the spectrophotometer. The blank sample was evaluated
| [28] | C. E. Palacios, A. Nagai, P. Torres, J. A. Rodrigues, and A. Salatino, “Contents of tannins of cultivars of sorghum cultivated in Brazil, as determined by four quantification methods,” Food Chem., vol. 337, p. 127970, 2021. |
[28]
. The tannin content was computed as:
(13)
Where: As = Absorbance of the sample, Ab = Absorbance of the blank sample, W = Weight of the sample, D = Density of the solution
2.8.3. pH Value
About 5 g of fine grinded sample of coded injera was added to the cleaned and dried beaker. After 50 mL of distilled water was added, and roughly stirred for 5 min, it was allowed to settle the dissolved sample for 2 hours until sediment was formed. Finally, the solution was read by pH meter and the result was recorded
| [29] | W. Horwitz and G. Latimer, “AOAC-Association of official analytical chemists,” Off. Methods Anal. AOAC Int. 18th ed, Gaithersburg, Maryland, USA, vol. 45, pp. 75-76, 2005. |
[29]
.
2.9. Sensory Acceptability Evaluation
A panel consisting of thirty judges assessed the sensory acceptability. The panelists were chosen at random from among the residents of Bate town, which is close to the main campus of Haramaya University. Within two hours of the injera baking, the evaluation was carried out. In order to assess the injera's sensory acceptability, the panelists categorized and placed the samples in a random order. A glass of drinking water was given to each and every panelist, so they rinse their mouth between tests of all samples. Finally, using a seven-point hedonic scale, the panelists were instructed to rate each coded sample based on their assessment of sensory attributes like color, flavor, mouth feel or texture, eyes of injera, roll-ability, underside appearance, and overall acceptability (1 = dislike very much; 2 = dislike moderately; 3 = dislike slightly; 4 = neither like nor dislike; 5 = like slightly; 6 = like moderately and 7 = like very much
| [30] | T. Lawless and H. Heymann, Sensory evaluation of food: principles and practices, vol. 2. Springer, 2010. |
[30]
.
2.10. Statistical Analysis
Analysis of variance (ANOVA) between the treatments was carried out utilizing SAS 9.1 computer software as a statistical analysis tool following data collection. Mean values were used to compare the data. LSD (P = 0.05) was used to compare all significant treatment effects in the examined parameters. The analysis of the treatment was done in triplicate.
3. Results and Discussions
3.1. Proximate Composition of Composite Injera
3.1.1. Main Effect of Factors on Proximate Composition of Composite Injera
Proximate composition data of the injera products made from the composite flours and the control are given in
Table 2. The moisture content of sorghum-barley-potato composite flours injera exhibited significant differences (P˂0.05) due to blending ratios. The highest value (62.38%) was observed in samples of 50% sorghum, 25% barley, and 25% potato. The moisture contents of the control (100% sorghum) and B1 were 59.89 and 58.94% respectively with no statistical difference between them.
Table 2. Main effect of blending ratio and fermentation duration on proximate composition of composite injera.
BR | Moisture (wb %) | Crude fat (%) | CP (%) | CF (%) | Ash (%) | CHO (%) | Total Energy (kcal/100 g) |
B0 | 59.89±1.13b | 1.81±0.13a | 10.51±0.37a | 1.36±0.06b | 1.84±0.04b | 24.59±1.44a | 156.68±4.32a |
B1 | 58.94±2.39b | 1.85±0.16a | 11.32±0.89a | 1.56±0.03a | 2.10±0.21ba | 24.24±2.99ba | 158.82±9.90a |
B2 | 60.49±2.68ba | 1.74±0.10ba | 10.81±0.77a | 1.58±0.16a | 2.13±0.11a | 23.25±2.31ba | 151.90±7.92ba |
B3 | 62.38±1.15a | 1.62±0.12b | 10.55±0.70a | 1.54±1.10a | 2.27±0.10a | 21.65±0.78b | 143.40±5.39b |
CV (%) | 2.89 | 7.27 | 6.55 | 6.57 | 6.17 | 8.78 | 4.73 |
LSD | 2.23 | 0.16 | 0.90 | 0.13 | 0.16 | 2.63 | 9.22 |
FD | | | | | | | |
T1 | 61.98±1.25a | 1.67±0.11b | 10.14±0.5b | 1.56±0.19a | 1.99±0.20b | 24.95±2.68a | 155.37±11.12a |
T2 | 59.69±2.53b | 1.82±0.08a | 11.27±0.69a | 1.48±0.06a | 2.07±0.15ba | 23.75±1.25a | 156.50±6.05a |
T3 | 59.61±1.47b | 1.77±0.19ba | 10.98±0.53a | 1.49±0.08a | 2.19±0.20a | 21.59±1.2b | 146.23±6.09b |
CV (%) | 3.04 | 7.83 | 5.44 | 8.50 | 8.95 | 7.89 | 5.31 |
LSD | 1.84 | 0.14 | 0.59 | 0.13 | 0.19 | 1.85 | 8.13 |
All values are mean ± standard deviation. Means within a column with the different letter are significantly different at P˂0.05. Where: FD = Fermentation duration, CV = Coefficient of variance, LSD = Least significant difference, wb = Wet basis, CP (%) = Crude protein, CF (%) = Crude fiber, CHO (%) = Utilizable carbohydrate, B0 = Control sample (100% sorghum flour), B1, B2, B3 = Blended ratios, T1 = 24 hour, T2 = 48 hour, T3 = 72 hour
These results are slightly lower than the 64.01 to 65.63% reported by
| [31] | Manihot, “Effect of Blending Ratio on Proximate Composition, Physico-Chemical Property, and Sensory Acceptability of Injera Produced from Red Tef Effect of Blending Ratio on Proximate Composition, Physico-Chemical Property, and Sensory Acceptability of Injera P,” no. October, 2017. |
[31]
for teff-cassava (70:30) composite injera. With increase in barley-potato flour proportion, moisture content of product increased from 58.94 to 62.38%. Similarly, the moisture content of blended flour injera were also significantly (P˂0.05) affected by fermentation duration (
Table 2). The recorded data showed that the highest value (61.98%) was observed in injeras of 24 hour fermentation time. The decrease of moisture content toward the increase of fermentation duration may be due to dry matter having a chance to increase, during fermentation as a result of microbial proliferation
| [32] | D. M. Divisekera et al., “Oral toxicity evaluation of probiotic strains isolated from Finger millet [Eleusine coracana (L.) Gaertn.] in Wistar rat models (in vivo),” Arch. Ecotoxicol., vol. 3, no. 3, pp. 91-102, 2021. |
[32]
. The 24 and 72 hour fermentation times didn’t show statistical difference (P>0.05) with values of 59.61 and 59.69%, respectively. The recorded results in the present study were in agreement with results of previous studies which ranged from 60.22 to 66.76% as reported by
| [24] | T. T. T. Nguyen, G. Loiseau, C. Icard-Vernière, I. Rochette, S. Trèche, and J.-P. Guyot, “Effect of fermentation by amylolytic lactic acid bacteria, in process combinations, on characteristics of rice/soybean slurries: A new method for preparing high energy density complementary foods for young children,” Food Chem., vol. 100, no. 2, pp. 623-631, 2007. |
[24]
.
Blending ratio had significant (P˂0.05) effect on crude fat content of blended product (
Table 2). The values ranged from 1.62 to 1.85%, the lowest being observed in an injera sample with a blending proportion of 50% sorghum, 25% barley, and 25% potato flours. The rest of the values 1.74, 1.81, and 1.85% did not show significant difference from one another. These results were in close agreement with the values which ranged from 1.67 to 2.20% of fat content for teff-cassava composite injera samples
| [33] | B. D. Beruk and T. D. Fasil, “Effect of blending ratio on proximate composition, physico-chemical property, and sensory acceptability of injera produced from red tef (Eragrostis tef) and cassava (Manihot esculenta),” Food Sci Qual Management, vol. 68, pp. 6-10, 2017. |
[33]
. Moreover, the results of crude fat in current study are also within the range of 0.74 to 2.70%
| [34] | L. Woldemariam, G. Mamo, and F. Woldeyes, “Effect of Barely (Hordeum Vulgare L.) and Potato (Solanum Tuberosum L.) Blending Ratios on Injera in North Shewa Zone, Ethiopia,” 2022. |
[34]
.
Similarly, the crude fat content values of the fermented injera samples were 1.69, 1.82, and 1.77% for fermentation times of 24, 48, and 72 hours, respectively. There was a significant difference (P˂0.05) between the highest and lowest values, while the intermediate value was not statistically different from either of the two values (
Table 2).
The crude protein content of all injeras samples, with all different proportion of sorghum-barley-potato flours and the control, showed no significant difference (P˃0.05) among themselves (
Table 2). The values were numerically between 10.51 and 11.32% and are almost in agreement with the 7.72 to 12.65%, reported by
| [35] | F. Dasa and B. Nguyen, “Relation among Proximate Compositions, Rheological Properties and Injera Making Quality of Millet Varieties,” Adv. Crop Sci. Technol., vol. 8, no. July, pp. 1-8, 2020. |
[35]
. Likewise, fermentation duration had significant (P˂0.05) effect on crude protein content of blended product. The shortest duration (24 hour) resulted in injeras of statistically (P<0.05) lower (10.14%) crude protein than the other samples of longer 48 and 72 hour fermentation duration. According to
| [36] | M. Debabandya, T. Manoj Kumar, D. Sumedha, and R. H. Sadvatha, “Sorghum Fermentation for Nutritional Improvement,” Adv. Food Sci. Eng., vol. 1, no. 4, pp. 175-195, 2017, https://doi.org/10.22606/afse.2017.14005 |
[36]
, the protein quality was increased due to the action fermentation process.
Crude fiber content of injeras had no significant difference (P˂0.05) due to blending ratio (
Table 2) except the fact that all products of composite flour had significantly higher crude fiber than the control sample of sole sorghum injera. The recorded data showed that the control sample had crude fiber of 1.36% whereas injeras of composite flour showed values of 1.54 to 1.58%. The results are within the range of 1.10 to 3.05% of crude fiber content for teff-cassava composite. Injera sample, which were reported by
| [37] | M. Banti, T. Atlaw, and B. Agza, “Injera Making Quality Evaluation of Tef and Cassava Composite Flour Injera Making Quality Evaluation of Tef and Cassava Composite Flour,” no. January 2020, 2021, https://doi.org/10.11648/j.bio.20200806.11 |
[37]
. Likewise, fermentation duration had shown no significant difference (P˃0.05) on crude fiber content of injera (
Table 2). The recorded values were 1.56, 1.48, and 1.49% for the samples of injera of dough fermented for 24, 48, and 72 hours, respectively.
Blending ratio resulted significant difference (P˂0.05) on ash content of injera (
Table 2). In this study the values ranged from 1.84% to 2.27%. Statistically the highest values were 2.13 and 2.27% with no statistical difference between them and observed in injera samples of B2 with blended proportion 70% sorghum, 20% barley, and 10% potato and of B3 with proportions of 50% sorghum, 25% barley, and 25% potato flours, respectively. The lowest value, 1.84%, was observed in the control sample (100% sorghum flour). This results were in range with the earlier data ranged from 1.85 to 3.69% recorded for amaranth-barley-teff composite injera which were reported by
| [8] | F. Woldemariam, A. Mohammed, T. Fikre Teferra, and H. Gebremedhin, “Optimization of amaranths-teff-barley flour blending ratios for better nutritional and sensory acceptability of injera,” Cogent Food Agric., vol. 5, no. 1, 2019, https://doi.org/10.1080/23311932.2019.1565079 |
[8]
and higher than the value of ash content of 0.23 to 1.54% for cassava-teff composite injera, as reported by
| [37] | M. Banti, T. Atlaw, and B. Agza, “Injera Making Quality Evaluation of Tef and Cassava Composite Flour Injera Making Quality Evaluation of Tef and Cassava Composite Flour,” no. January 2020, 2021, https://doi.org/10.11648/j.bio.20200806.11 |
[37]
. Fermentation duration also had significant difference (P˂0.05) on ash content with the highest value 2.19% recorded for 72 hour of fermented injera sample and the lowest value, 1.99%, for injera sample fermented for 24 hour.
The carbohydrate contents of sorghum-barley-potato flour injera product also exhibited significant difference (P˂0.05) due to blending ratio (
Table 2). The value ranged from 21.65 to 24.59%. The highest value is observed in control injera samples (100% sorghum flour) while the lower being in injera with a blending proportion of 50% sorghum, 25% barley, and 25% potato flours. The results of this study were higher than the finding of
| [38] | M. T. Awulachew and K. D. Kufi, “Mixing Ratios for Better Quality Optimization and Modeling of Teff, Sorghum and Fenugreek Flour Mixing Ratios for Better Quality Characteristics of injera by Using D-Optimal Mixture Design,” 2023, https://doi.org/10.20944/preprints202308.1709.v1 |
[38]
, who reported carbohydrate of teff-sorghum-maize composite injera, which ranged from 7.14 to 17.98%. On the other hand, the results of this study are lower than the result ranging from 75.26 to 83.54% of teff-cassava composite injera, which were reported by
| [37] | M. Banti, T. Atlaw, and B. Agza, “Injera Making Quality Evaluation of Tef and Cassava Composite Flour Injera Making Quality Evaluation of Tef and Cassava Composite Flour,” no. January 2020, 2021, https://doi.org/10.11648/j.bio.20200806.11 |
[37]
. Similarly, the carbohydrate content of injera of dough subjected to 24, 48, and 72 hours of fermentation was 24.98, 23.75, and 21.59%, respectively. As observed from recorded data there were significant difference (P˂0.05) between highest and lowest values.
The energy content of sorghum-barley-potato composite flour injera is presented in
Table 2. The recorded values ranged from 143.40 kcal/100 g of proportion B3 (50% sorghum, 25% barley and 25% potato) to numerically the highest value 158.62 kcal/100 g of injera sample with B1 blending proportion of 80% sorghum, 15% barley and 5% potato flours. Statistically significant differences were noted between the lowest and the rest of the values which were not statistically different from each other. The results of this study were higher than the value ranged from 110.36 to 141.92 kcal/100 g of teff-sorghum-maize composite injera presented by
| [38] | M. T. Awulachew and K. D. Kufi, “Mixing Ratios for Better Quality Optimization and Modeling of Teff, Sorghum and Fenugreek Flour Mixing Ratios for Better Quality Characteristics of injera by Using D-Optimal Mixture Design,” 2023, https://doi.org/10.20944/preprints202308.1709.v1 |
[38]
. Significant differences in energy content were noted associated with fermentation time with values of 155.37, 156.50, and 146.23 kcal/100 g of injeras fermented for 24, 48, and 72 hours, respectively. The significant difference (P˂0.05) occurred between the highest and lowest values.
3.1.2. Interaction Effect of Factors on Proximate Composition of Sorghum-Barley-Potato Composite Injera
The interactions between the factors of blending ratio and fermentation duration on proximate composition and energy content of injeras produced from sorghum-barley-potato blended flours are presented in
Table 3.
There were significant differences (P˂0.05) observed in moisture content due to interaction of blending ratio and Fermentation duration (
Table 3). The values ranged from 57.20 to 63.33%. The highest value was observed for injera sample with blended proportion 50% sorghum, 25% barley, and 25% potato flours, which had fermented for 24 hour and the lowest for injera sample with blended proportion (80% sorghum, 15% barley and 5% potato flours), which was fermented to 24 hour. The scored value for moisture content in the current study was in agreement with previous results ranging from 57.70 to 64.82% for teff-cassava composite injera, which reported by
| [31] | Manihot, “Effect of Blending Ratio on Proximate Composition, Physico-Chemical Property, and Sensory Acceptability of Injera Produced from Red Tef Effect of Blending Ratio on Proximate Composition, Physico-Chemical Property, and Sensory Acceptability of Injera P,” no. October, 2017. |
[31]
. It was also lower than 65.37-73.25%, for teff-sorghum-maize blended injera as presented by
| [39] | M. T. Awulachew, “Evaluation of Proximate Composition and Sensory Quality Acceptability of Ethiopian Flat Bread (Injera ) Prepared from Composite Flour, Blend of Maize, Teff and Sorghum,” vol. 4, no. 2, pp. 18-24, 2020, https://doi.org/10.11648/j.ijfet.20200402.12 |
[39]
.
Table 3. Interaction effect of blending ratio and fermentation duration on proximate composition of composite injera.
BR×FD | MC (wb %) | Crude fat (%) | CP (%) | CF (%) | Ash (%) | CHO (%) | TE (kcal/100 g) |
B0T1 | 59.07±0.90dec | 1.66±0.06bdc | 10.20±0.21dc | 1.29±0.02d | 1.80±0.02f | 25.99±0.91ba | 159.63±3.30bac |
B0T2 | 59.60±0.53bdec | 1.85±0.03bac | 10.52±0.12bdc | 1.38±0.01c | 1.84±0.04f | 24.80±0.37bac | 157.98±2.08bac |
B0T3 | 61.00±1.00bdac | 1.91±0.10ba | 10.81±0.45bdc | 1.42±0.02c | 1.87±0.03ef | 22.99±0.71bedc | 152.42±4.08bdec |
B1T1 | 57.20±1.31e | 1.69±1.17bdac | 10.24±0.12dc | 1.56±0.04b | 1.86±0.03ef | 27.46±1.19a | 165.97 ± 5.65a |
B1T2 | 58.10±1.15de | 1.91± 0.07ba | 12.78±0.06a | 1.57±0.03b | 2.12±0.08dc | 24.13±1.17bdc | 162.39± 4.75ba |
B1T3 | 61.53±2.00bac | 1.94± 0.07a | 11.53±0.49ba | 1.55±0.02b | 2.32±0.02a | 21.13±1.67ed | 148.11±8.37dec |
B2T1 | 59.17±1.26dec | 1.71±0.15bdac | 10.26±1.12dc | 1.78±0.02a | 2.00±0.07ed | 25.08±2.20bac | 156.75± 5.45bac |
B2T2 | 59.53±1.54bdec | 1.81±0.06bac | 10.97±0.61bdac | 1.56±0.05b | 2.15±0.03bdc | 23.98±0.85bdc | 156.04±6.21bdac |
B2T3 | 62.77±0.15ba | 1.72±0.08de | 11.19±0.08bac | 1.43±0.03c | 2.22±0.06bac | 20.68±0.11e | 142.91± 0.48de |
B3T1 | 63.33±0.95a | 1.62± 0.10dc | 9.85±0.11d | 1.62±0.10b | 2.29±0.01ba | 21.28±1.02ed | 139.12± 3.62e |
B3T2 | 61.2±0.80bdac | 1.73±0.06bdac | 11.40±0.18bac | 1.41±0.03c | 2.16±0.13bc | 22.10±0.70edc | 149.59±2.93bdec |
B3T3 | 62.60±0.50ba | 1.52±0.62d | 10.40±0.20bdc | 1.58±0.02b | 2.34±0.01a | 21.56±0.70ed | 141.48±1.97e |
CV (%) | 1.85 | 5.28 | 3.99 | 1.84 | 2.55 | 4.69 | 2.99 |
LSD | 3.28 | 0.28 | 1.27 | 0.08 | 0.16 | 3.23 | 13.45 |
All value is mean ± Standard deviation. Means with in a column with the different superscript letter are significantly different at P˂0.05. Where: CV = Coefficient of variance, LSD = Least significant difference, BR = Blending ratio, MC (%) = Moisture content, wb = Wet basis, CP (%) = Crude protein, CF (%) = Crude fiber, CHO (%) = Carbohydrate, TE = Total energy (Kcal/100 g), B0 = Control (100% sorghum flour), B1, B2, B3 = Blended ratios, T1 = 24 hour, T2 = 48 hour, T3 = 72 hour.
The interaction of the two factors had significant difference (P˂0.05) on crude fat content of injeras (
Table 3).
The recorded result of this study showed that the values ranged from 1.52 to 1.91%. The highest value was scored for injera sample of control (100% sorghum flour), which was fermented to 72 hour and the lowest for injera sample with blended proportion (50% sorghum, 25% barley and 25% potato flours), which was fermented to 72 hour. The range of current study for crude fat content was in agreement with previous results ranging from 1.67 to 2.20% for teff-cassava composite injera, which reported by
| [31] | Manihot, “Effect of Blending Ratio on Proximate Composition, Physico-Chemical Property, and Sensory Acceptability of Injera Produced from Red Tef Effect of Blending Ratio on Proximate Composition, Physico-Chemical Property, and Sensory Acceptability of Injera P,” no. October, 2017. |
[31]
.
Similarly, the interaction of blending ratio and fermentation duration had significant difference (P˂0.05) on crude protein of injeras (Table 3). The recorded result of this study ranged from 9.85 to 12.78%. The highest value was obtained for an injera sample with a blended proportion of 80% sorghum, 15% barley, and 5% potato flours, which was fermented for 48 hours.
The lowest value was observed for injera with a blend proportion of 50% sorghum, 25% barley, and 25% potato flours which was fermented for 24 hours. The results of current study was in range of 10.11-18.84% for crude protein in teff-lupine composite injera, which reported by
| [17] | L. Yegrem, S. Abera, and M. Temesgen, “Nutritional composition and sensory quality of injera prepared from tef (Eragrostis tef (Zucc) Trotter) complemented with lupine (Lupines spp.),” 2021, https://doi.org/10.1080/23311932.2020.1862469 |
[17]
and it also in agreement with 11.27-14.73% in teff-sorghum-maize composite injera, as presented by
| [39] | M. T. Awulachew, “Evaluation of Proximate Composition and Sensory Quality Acceptability of Ethiopian Flat Bread (Injera ) Prepared from Composite Flour, Blend of Maize, Teff and Sorghum,” vol. 4, no. 2, pp. 18-24, 2020, https://doi.org/10.11648/j.ijfet.20200402.12 |
[39]
. It was lower than the previous results, which ranged from 13.15 to 15.6% in cassava, wheat and soybean composite food products, which reported by
| [40] | M. E. Lyimo, D. M. Gimbi, and Shayo, “Nutritional evaluation of composite flour based on root and tuber crops and sensory acceptability of the developed products,” Proc. 13th ISTRC Symp., pp. 514-520, 2007. |
[40]
. The result in
Table 3 showed that the protein content in the injera sample was increased with an increased proportion of barley and potato flour. This was probably due to the presence of high protein content of amino acids especially, lysine which are limited quantities in cereal grain is found in potato
| [41] | V. Bártová, J. Bárta, A. Brabcová, Z. Zdráhal, and V. Horáčková, “Amino acid composition and nutritional value of four cultivated South American potato species,” J. Food Compos. Anal., vol. 40, pp. 78-85, 2015. |
[41]
.
The fiber content of injera had been significantly (P˂0.05) affected by interaction of blending ratio and fermentation duration (
Table 3). The recorded data ranged from 1.29 to 1.78%. The highest value was observed for an injera sample with a blend proportion of 70% sorghum, 20% barley, and 10% potato flours, which was fermented for 24 hours. The lowest value was observed for injeras of the control sample (100% sorghum flour), which was fermented for 24 hours. The range of current study was between 1.57 and 2.66%, which was presented by
| [31] | Manihot, “Effect of Blending Ratio on Proximate Composition, Physico-Chemical Property, and Sensory Acceptability of Injera Produced from Red Tef Effect of Blending Ratio on Proximate Composition, Physico-Chemical Property, and Sensory Acceptability of Injera P,” no. October, 2017. |
[31]
for teff-cassava composite injera. This was lower than 2.65-2.83%, which was reported by
| [40] | M. E. Lyimo, D. M. Gimbi, and Shayo, “Nutritional evaluation of composite flour based on root and tuber crops and sensory acceptability of the developed products,” Proc. 13th ISTRC Symp., pp. 514-520, 2007. |
[40]
for composite flour of weaning food. Fiber content of injera showed an increase trend with a parallel increase in proportion of barley flour. Because of this, barley consists of higher fiber content than all other cereal grains including sorghum
| [42] | S. Grando and H. G. Macpherson, “Food barley: importance, uses and local knowledge. Proceedings of the International Workshop on Food Barley Improvement, Hammamet, Tunisia, 14-17 January, 2002,” Food barley importance, uses local knowledge. Proc. Int. Work. Food Barley Improv. Hammamet, Tunis. 14-17 January, 2002, 2005. |
[42]
. In case of total ash, the interaction of blending ratio and fermentation duration had significant difference (P˂0.05) (
Table 3). The recorded data in the current study ranged from 1.80% to 2.34%. The highest score 2.32 and 2.34% was observed for an injera sample of B1T3 and B3T3, respectively. The lowest values are 1.80 and 1.84%, observed for an injera sample of B1T1 and B1T2, respectively. The ash content obtained in present study was in line with the ash value 1.79-2.22% of injera sample prepared from teff and buckwheat flour, which reported by
| [43] | S. M. Anberbir et al., “Effect of blending ratio and fermentation time on the physicochemical, microbiological, and sensory qualities of injera from teff, pearl millet, and buckwheat flours,” CyTA - J. Food, vol. 21, no. 1, pp. 217-236, 2023, https://doi.org/10.1080/19476337.2023.2188058 |
[43]
. The ash content of the product sample is raised as the blending of barley-potato flour proportion increases. This was probably due to the presence of high fiber content in barley flour because fiber was a major contributor to ash contents, meaning samples with higher fiber contents had higher ash content
| [44] | S. M. Chisenga, T. S. Workneh, G. Bultosa, and M. Laing, “Proximate composition, cyanide contents, and particle size distribution of cassava flour from cassava varieties in Zambia,” vol. 4, no. July, pp. 869-891, 2019, https://doi.org/10.3934/agrfood.2019.4.869 |
[44]
. Ash content is important parameters, which are used as indicators of mineral contents and measurement of quality of flours in the food industry.
The interaction of blending ratio and fermentation duration had a significant difference (P˂0.05) on carbohydrate content of injera (
Table 3). The recorded value in the current study ranged from 20.68 to 27.46%. The highest value was observed in a sample with a blended proportion of 80% sorghum, 15% barley, and 5% potato flours, which was fermented for 24 hours. The lowest value (20.68%) was recorded for a sample with a blend proportion of 70%sorghum, 20% barley, and 10% potato flours, which was fermented for 72 hours. The carbohydrate content obtained in this study was higher than the value ranged from 7.14-17.98% for teff sorghum and maize composite flour injera, which reported by
| [39] | M. T. Awulachew, “Evaluation of Proximate Composition and Sensory Quality Acceptability of Ethiopian Flat Bread (Injera ) Prepared from Composite Flour, Blend of Maize, Teff and Sorghum,” vol. 4, no. 2, pp. 18-24, 2020, https://doi.org/10.11648/j.ijfet.20200402.12 |
[39]
. The factor such as protein, fat and moisture contents were the major components affects the carbohydrates of food so that increase in those molecules would lead to significant decrease in carbohydrate
| [44] | S. M. Chisenga, T. S. Workneh, G. Bultosa, and M. Laing, “Proximate composition, cyanide contents, and particle size distribution of cassava flour from cassava varieties in Zambia,” vol. 4, no. July, pp. 869-891, 2019, https://doi.org/10.3934/agrfood.2019.4.869 |
[44].
The data of energy content exhibited significant differences (P˂0.05) due to the interaction of blending ratio and fermentation duration (
Table 3). The results ranged from 139.12 to 165.97 kcal/100 g. The highest energy content was observed in an injera sample of B1T1 and lowest was observed in B3T1 and B3T3. The energy content obtained in the current study was in line with the value ranged from 110.36 to 137.98 kcal/100 g for sorghum, teff and maize composite injera, which reported by
| [39] | M. T. Awulachew, “Evaluation of Proximate Composition and Sensory Quality Acceptability of Ethiopian Flat Bread (Injera ) Prepared from Composite Flour, Blend of Maize, Teff and Sorghum,” vol. 4, no. 2, pp. 18-24, 2020, https://doi.org/10.11648/j.ijfet.20200402.12 |
[39]
. Generally, as moisture content of formulated product is increased, the energy content becomes lower, similarly as fermentation duration is raised from 24 to 72 hours, the energy content becomes lower (
Table 3). The energy content of injera was decreased with an increase in barley-potato flour blending proportion, this may be due to consumption of basic nutrients such as carbohydrate, fat and protein by the fermentative microorganism
| [43] | S. M. Anberbir et al., “Effect of blending ratio and fermentation time on the physicochemical, microbiological, and sensory qualities of injera from teff, pearl millet, and buckwheat flours,” CyTA - J. Food, vol. 21, no. 1, pp. 217-236, 2023, https://doi.org/10.1080/19476337.2023.2188058 |
[43]
.
3.2. Mineral Contents of Sorghum-Barley-Potato Composite Flour Injera
3.2.1. Main Effects of Factors on Mineral Content of Sorghum-Barley-Potato Composite Flour Injera
The effect of blending ratio on sorghum-barley-potato composite flour injera has significant difference (P˂0.05) in mineral contents of zinc (
Table 4). The obtained result shows that the value is ranged from 6.52 to 7.36 mg/100 g. The highest score was observed for B1 (80:15:5, of sorghum, barley and potato flour respectively) and the lowest was recorded for control sample. These range was higher than value ranged from 1.74 to 3.12 mg/100 g for teff-fenugreek blended injera (84:16), which reported by
| [45] | T. Leykun, S. Admasu, and S. Abera, “Evaluation of the mineral content, phyto-chemicals profile and microbial quality of tef injera supplemented by fenugreek flour Evaluation of the mineral content, phyto-chemicals profile and microbial quality of tef injera supplemented by fenugreek flour,” J. Food Sci. Technol., no. February, 2020, https://doi.org/10.1007/s13197-020-04283-y |
[45]
and lower than the value (23.81 mg/100 g) of teff-sorghum-faba bean blended injera, which reported by
| [46] | Y. Mihretie, “The Mineral Content and Sensory Properties of Injera Made from the Faba Bean, Sorghum and Tef Flour Blend,” Int. J. Nutr., no. May, 2019, https://doi.org/10.14302/issn.2379 |
[46]
. The value 7.36 and 6.74 mg/100 g of B1 (80% sorghum, 15% barley, 5% potato) and B2 (70% sorghum, 20% barley, 10% potato) respectively are higher than value 6.52 mg/100 g of B0 (100%sorghum). This was shown that the zinc content observed in blended injera was higher than that of control (
Table 4). However; the effect of fermentation duration had not significant difference (P˃0.05) in zinc content. The zinc content became gradually increased due to reduction of ant nutritional factor present in the raw flour
| [46] | Y. Mihretie, “The Mineral Content and Sensory Properties of Injera Made from the Faba Bean, Sorghum and Tef Flour Blend,” Int. J. Nutr., no. May, 2019, https://doi.org/10.14302/issn.2379 |
[46]
.
Table 4. Main effect of blending ratio and fermentation duration on mineral content (mg/100g) of composite injera.
Blending ratio | Minerals (mg/100 g) |
Zn | Ca | Fe |
B0 | 6.52±0.63b | 16.44± 0.54b | 17.05±0.61a |
B1 | 7.36±0.71a | 17.51±0.76b | 18.79±1.32a |
B2 | 6.74±0.61ba | 19.22±1.07a | 17.74±1.90a |
B3 | 6.53±0.47b | 18.73±1.00a | 17.63±1.34a |
CV (%) | 8.99 | 4.84 | 7.70 |
LSD | 0.78 | 1.11 | 1.75 |
FD | | | |
T1 | 6.56±0.46a | 17.81±1.64a | 17.37±1.10a |
T2 | 6.80±0.74a | 18.13±1.32a | 17.57±1.41a |
T3 | 7.00±0.77a | 18.00±1.25a | 18.46±1.69a |
CV (%) | 9.92 | 7.85 | 7.96 |
LSD | 0.67 | 1.41 | 1.42 |
All values are mean ± standard deviation. Means within a column with different superscript letter are significantly different at P˂0.05. Where: CV = Coefficient of variance, LSD = Least significant difference, Zn = Zinc, Cal = Calcium, Fe = Iron, B1, B2, B3 = Blending ratios, FD = Fermentation duration, B0= 100% sorghum flour, 24, 48 and 72 hour were T1, T2 and T3, respectively.
There is significant difference (P˂0.05) between calcium contents of blending ratio (
Table 4). The value of the obtained result ranged from 16.44 to 19.22 mg/100 g. The highest value was observed for B2 (70% sorghum, 20% barley, 10% potato) and the lowest value was observed in the control sample. This result was higher than the range from 4.55 to 4.95 mg/100g of calcium content, which was reported by
| [47] | L. Moench, D. Processing, N. A. Mohammed, I. A. M. Ahmed, E. E. Babiker, and A. Materials, “Nutritional Evaluation of Sorghum Flour (Sorghum,” pp. 58-62, 2011. |
[47]
for sorghum injera. The observed data indicated that there was no significant difference (P˃0.05) in calcium content due to fermentation duration (
Table 4).
The effect of blending ratio has no significant difference (P˃0.05) on iron content. The recorded values are 17.05, 18.79, 17.74, and 17.63 mg/100g was observed for sample B0, B1, B2 and B3, respectively (
Table 4). The iron values 17.37, 17.57, and 18.46 mg/100 g were recorded for the sample subjected to 24, 48, and 72 hours, respectively. There was no significant difference (P˃0.05) in iron content of the samples subjected to fermentation duration (
Table 4).
3.2.2. Interaction Effect of Factors on Minerals of Sorghum-Barley-Potato Composite Flour Injera
Table 5 presents data showing the effects of the interactions between the two factors on the mineral contents of the processed injera.
Blending ratio interacted with fermentation duration shown no significant difference (P˃0.05) on the zinc content of processed injera. The significant difference (P˂0.05) was observed in calcium content, due to interaction between blending ratio and fermentation duration (
Table 5). The highest values were 18.00, 18.37, 18.58, 18.61, 19.39, 19.60 and 19.62 mg/100 g were recorded in samples of B3T2, B1T2, B3T3, B2T1, B2T3, and B2T2, respectively. The recorded data ranged between 15.93 mg/100 g and 19.62 mg/100 g. The range of calcium content in current study was higher than 4.75 mg/100 g of sorghum injera, which reported by
| [47] | L. Moench, D. Processing, N. A. Mohammed, I. A. M. Ahmed, E. E. Babiker, and A. Materials, “Nutritional Evaluation of Sorghum Flour (Sorghum,” pp. 58-62, 2011. |
[47]
and lower than 123.86-187.15 mg/100 g of sorghum, faba bean and teff blended injera, which reported by
| [46] | Y. Mihretie, “The Mineral Content and Sensory Properties of Injera Made from the Faba Bean, Sorghum and Tef Flour Blend,” Int. J. Nutr., no. May, 2019, https://doi.org/10.14302/issn.2379 |
[46]
.
The interaction of the two factors showed significant difference (P˂0.05) in iron content of injera as presented in
Table 5. The recorded data showed that the highest values were 17.40 mg/100g for B0T3, B2T1, B3T1 as well as 17.00, 17.94, 18.61, 18.74, 19.83 and 19.88 mg/100 g for sample of B0T2, B1T1, B1T2, B3T3, B1T3, and B2T3, respectively. The scored value for iron content in this study is ranging between 15.92 and 19.88 mg/100 g. These results were in agreement with, which ranged from 11.56-22.66 mg/100 g of iron content in teff-sorghum-faba bean blended injera, which was presented by
| [46] | Y. Mihretie, “The Mineral Content and Sensory Properties of Injera Made from the Faba Bean, Sorghum and Tef Flour Blend,” Int. J. Nutr., no. May, 2019, https://doi.org/10.14302/issn.2379 |
[46]
. It is lower than ranged 30.80-34.50 in fenugreek-teff blended injera, which is reported by
| [45] | T. Leykun, S. Admasu, and S. Abera, “Evaluation of the mineral content, phyto-chemicals profile and microbial quality of tef injera supplemented by fenugreek flour Evaluation of the mineral content, phyto-chemicals profile and microbial quality of tef injera supplemented by fenugreek flour,” J. Food Sci. Technol., no. February, 2020, https://doi.org/10.1007/s13197-020-04283-y |
[45]
.
Table 5. Effects of interaction between blending ratio and fermentation duration on mineral content (mg/100 g) of composite injera.
BRΧFD | Zn | Ca2+ | Fe3+ |
B0T1 | 6.29±0.46a | 15.93±0.38ba | 16.73± 061ba |
B0T2 | 6.43±0.70a | 16.47±0.42ba | 17.00±0.61a |
B0T3 | 6.83±0.80a | 16.93±0.35ba | 17.40± 0.61a |
B1T1 | 6.56±0.61a | 17.08±0.58ba | 17.94±1.29a |
B1T2 | 7.58±0.33a | 18.37± 0.48a | 18.61±1.01a |
B1T3 | 7.94± 0.10a | 17.08±0.35ba | 19.83±1.23a |
B2T1 | 6.69±0.46a | 18.61±1.50a | 17.40±0.46a |
B2T2 | 6.62± 0.89a | 19.62± 0.48a | 15.92±0.45ba |
B2T3 | 6.89±0.65a | 19.39±1.10a | 19.88±0.88a |
B3T1 | 6.69±0.46a | 19.60±1.61a | 17.40±1.41a |
B3T2 | 6.56±0.61a | 18.00±1.03a | 18.74±1.01a |
B3T3 | 6.35±0.43a | 18.58±0.87a | 16.73±1.01ba |
CV (%) | 8.55 | 4.19 | 5.58 |
LSD | 1.71 | 2.22 | 2.93 |
All values are mean ± standard deviation. Means with in a column with the different superscript letter are significantly different at P˂0.05. Where: CV = Coefficient of variance, LSD = Least significant difference, BR = Blending ratio, FD = Fermentation duration, T1 = 24 hour, T2 = 48 hour, T3 = 72 hour.
The mineral content in control injera was comparatively lower than that of blended. This was probably due to high anti-nutritional content in sorghum grain
| [47] | L. Moench, D. Processing, N. A. Mohammed, I. A. M. Ahmed, E. E. Babiker, and A. Materials, “Nutritional Evaluation of Sorghum Flour (Sorghum,” pp. 58-62, 2011. |
[47]
.
Table 5 indicated that the calcium and iron content had increased with the increment of fermentation time and blending ratio. This may be due to blending of barley and potato flour as well fermentation, which reduces the ant nutritional content such as phytates and tannin, so enhances mineral absorption
| [46] | Y. Mihretie, “The Mineral Content and Sensory Properties of Injera Made from the Faba Bean, Sorghum and Tef Flour Blend,” Int. J. Nutr., no. May, 2019, https://doi.org/10.14302/issn.2379 |
[46]
.
3.3. pH Value and Anti-Nutritional Factors of Sorghum-Barley-Potato Composite Injera
The sourness test of traditionally fermented Ethiopian injera was one of the sensory attributes impacted by pH value due to changes in lactic acid concentration during fermentation
.
3.3.1. Main Effect of Factors on pH and Anti-Nutritional Content of Sorghum-Barley-Potato Composite Injera
As shown in
Table 6, the recorded pH values ranged from 3.53 to 3.87 with the smallest value being of the control sample (100% sorghum) and significantly different from the other three values of products of the composite flours. No significant difference (P˃0.05) in pH value of injera was attributed to blending ratio. The range of pH value in this study agreed with the value of the previous study that ranged from 3.60 to 4.10 for teff-sorghum-fenugreek blended flour injera
| [3] | T. A. Melaku, “Investigating the effects of teff-sorghum-fenugreek flour blending ratios on quality attributes of injera,” 2022, Addis Ababa University. |
[3]
.
The fermentation duration showed a significant difference (P˂0.05) in pH value of injera. The injera sample fermented for 24 hours had higher (3.86) pH value than the 3.68 of both samples which were fermented for 48 and 72 hours. From this study injeras of longer fermentation time showed reduced pH values because longer fermentation leads to more acidic product (
Table 6).
Difference in blending ratio resulted in significant differences (P<0.05) on anti-nutritional factors of the composite flour injeras as presented in
Table 6. The tannin content, for example, ranged from 15.08 to 16.39 mg/100 g. The highest value was recorded for pure sorghum injera (control) and lowest values 15.08 mg/100 g and 15.29 mg/100 g were in injera samples of B3 and B2, respectively. The decrease in tannin content is associated with the decrease in sorghum proportion as sorghum grain is known to have more tannin than barley and potato.
There was a significant difference (P˂0.05) in tannin content due fermentation duration (
Table 6). The highest value (16.08 mg/100 g) was observed in an injera sample, which fermented for 24 hours and the lowest value (15.13 mg/100 g) was observed in those fermented for 72 hours. The recorded data showed that, as fermentation duration increased the tannin content decreased. According to the other researcher, fermentation significantly reduces the level of tannin
| [49] | Adane T, S. A, N. R, T. B, and G. Haki3, “Effect of Processing Method on the Proximate,” African J. Food, Agric. Nutr. Dev., vol. 13, no. 2, pp. 7383-7398, 2013. |
[49]
. Fermentation also significantly reduces phytic acid and tannin content of cereal grain
| [50] | W. H. Abdelhaleem, A. H. El Tinay, A. I. Mustafa, and E. E. Babiker, “Effect of fermentation, malt-pretreatment and cooking on antinutritional factors and protein digestibility of sorghum cultivars,” Pakistan J. Nutr., vol. 7, no. 2, pp. 335-341, 2008, https://doi.org/10.3923/pjn.2008.335.341 |
[50]
.
Blending ratio also showed significant differences (P˂0.05) on phytic acid content of composite flour injera (
Table 6). The control injera sample was observed to have the highest value (278.35 mg/100 g) phytic acid content in comparison to blended flour injera. The composite flour injeras exhibited significantly (P<0.05) reduced phytic acid content as the proportion of sorghum flour reduced, the lowest (223.08 mg/100 g) being of samples with the lowest (50%) sorghum level. In other words, as a blend proportion of barley and potato flour increased from 15 to 25% and from 5 to 25%, respectively, the phytic content decreased. This may be due to the higher phytic content in sorghum than in barley and potato.
Table 6. Main effects of blending ratio and fermentation duration on pH and anti-nutritional contents (mg/100 g) of composite injera.
BR | pH | Tannin | Phytic-acid |
B0 | 3.53±0.15b | 16.39±0.51a | 278.35±4.48a |
B1 | 3.77±0.05a | 15.76±0.42b | 258.85±6.01b |
B2 | 3.78±0.09a | 15.29±0.54c | 236.98±5.23c |
B3 | 3.87±0.14a | 15.08±0.55c | 223.08±4.59d |
CV (%) | 3.07 | 1.94 | 1.18 |
LSD | 0.15 | 0.39 | 3.79 |
FD | | | |
T1 | 3.86±0.12a | 16.08±0.58a | 253.52±22.86a |
T2 | 3.68±0.13b | 15.68±0.57ba | 249.65±22.22a |
T3 | 3.68±0.18b | 15.13±0.66b | 244.78±21.42a |
CV (%) | 3.91 | 3.84 | 8.89 |
LSD | 0.15 | 0.60 | 22.22 |
All values are mean ± standard deviation. Means within a column with different superscript letter are significantly different at P˂0.05. Where: CV = Coefficient of variation, LSD = Least significant difference, BR = Blending ratio, FD = Fermentation duration, B0 = Control sample, 24, 48 and 72 hours were T1, T2 and T3, respectively.
On the other hand, there were no a significant difference (P˃0.05) in phytic acid content of the injeras due to fermentation duration (
Table 6). The numerical values were 253.52, 249.65, and 244.78 mg/100 g for fermentation periods of 24, 48, and 72 hour, respectively.
3.3.2. Interaction Effect of Factors on pH Value and Anti-Nutritional Content of Sorghum-Barley-Potato Composite Injera
The pH value of injera exhibited significant differences (P˂0.05) due to the interaction effect between blending ratio and fermentation duration as shown in
Table 7. The recorded data ranged from 3.41, 3.46 to 4.03. The highest pH value was found in an injera sample prepared from blended proportions of 50% sorghum, 25% barley, and 25% potato flours, which fermented for 24 hours; while the lowest pH value was scored in sample, which fermented for 48 and 72 hours. Both factors of blending ratio and fermentation duration have their own impact on the pH of injeras. According to
| [38] | M. T. Awulachew and K. D. Kufi, “Mixing Ratios for Better Quality Optimization and Modeling of Teff, Sorghum and Fenugreek Flour Mixing Ratios for Better Quality Characteristics of injera by Using D-Optimal Mixture Design,” 2023, https://doi.org/10.20944/preprints202308.1709.v1 |
[38]
and
| [34] | L. Woldemariam, G. Mamo, and F. Woldeyes, “Effect of Barely (Hordeum Vulgare L.) and Potato (Solanum Tuberosum L.) Blending Ratios on Injera in North Shewa Zone, Ethiopia,” 2022. |
[34]
were found pH of injera sample ranges in 3.67 to 4.11 for teff, sorghum and fenugreek composite injera; and 2.9 to 3.83 for potato-barley composite injera, respectively, were in consistence with the current study. The samples with lowest pH value indicate that acid behavior of food, this was probably due to fermentable carbohydrates in formulated food products
| [38] | M. T. Awulachew and K. D. Kufi, “Mixing Ratios for Better Quality Optimization and Modeling of Teff, Sorghum and Fenugreek Flour Mixing Ratios for Better Quality Characteristics of injera by Using D-Optimal Mixture Design,” 2023, https://doi.org/10.20944/preprints202308.1709.v1 |
[38]
. According to
| [34] | L. Woldemariam, G. Mamo, and F. Woldeyes, “Effect of Barely (Hordeum Vulgare L.) and Potato (Solanum Tuberosum L.) Blending Ratios on Injera in North Shewa Zone, Ethiopia,” 2022. |
[34]
, the acidity of injera is decreased while raising potato flour proportion. This may be due to the decrease of fat content, with increased potato flour proportion in blended.
Interaction of blending ratio and fermentation duration caused significant difference (P˂0.05) on tannin content of the injera as presented in the
Table 7. In this study the tannin content ranged from 14.50 to 16.87 mg/100 g. The highest tannin was observed in the injera sample of the control (100% sorghum flour), which fermented for 24 hour; while the lowest value was observed in injera sample with made from 50% sorghum, 25% barley, and 25% potato flours, which fermented for 72 hour. Both sorghum proportion and fermentation time played a balanced influence in influencing the tannin content. That means reduction in sorghum proportion and prolonging fermentation time led to reduced tannin. The range of tannin content determined in this study was higher than the 0.01 to 7.41 mg/100 g of teff-fenugreek blended injera, which was reported by
| [45] | T. Leykun, S. Admasu, and S. Abera, “Evaluation of the mineral content, phyto-chemicals profile and microbial quality of tef injera supplemented by fenugreek flour Evaluation of the mineral content, phyto-chemicals profile and microbial quality of tef injera supplemented by fenugreek flour,” J. Food Sci. Technol., no. February, 2020, https://doi.org/10.1007/s13197-020-04283-y |
[45]
and the range 9.65 to 12.14 mg/100 g for teff-lupine blended injera which was reported by
| [17] | L. Yegrem, S. Abera, and M. Temesgen, “Nutritional composition and sensory quality of injera prepared from tef (Eragrostis tef (Zucc) Trotter) complemented with lupine (Lupines spp.),” 2021, https://doi.org/10.1080/23311932.2020.1862469 |
[17]
.
Similarly, the interaction of blending ratio and fermentation duration has resulted significant difference (P˂0.05) on the phytic acid content of composite flour injera (
Table 7). The recorded values ranged from 220.46 to 282.16 mg/100 g. The highest value was observed for injera of the control sample (100% sorghum flour), that was fermented to 24 hour while the lowest was for injera sample made from 50% sorghum, 25% barley, and 25% potato flour that was fermented for 72 hour. The range of phytic acid for pure sorghum injera in this study was comparable with the earlier study, which ranged from 282.45 to 290.95 mg/100 g of sorghum injera, which was reported by
| [47] | L. Moench, D. Processing, N. A. Mohammed, I. A. M. Ahmed, E. E. Babiker, and A. Materials, “Nutritional Evaluation of Sorghum Flour (Sorghum,” pp. 58-62, 2011. |
[47]
. This indicated that phytic acid content reduces with increase of fermentation duration and decrease in sorghum flour proportion. In other words, as an increase in blending proportion of barley and potato flours was combined with prolonged fermentation, the phytic acid content became radically decreased (
Table 7).
Table 7. Interaction effect of blending ratio and fermentation duration on pH values and ant-nutritional contents of composite injera.
BRΧFD | pH values | Tannin content (mg/100 g) | Phytic acid (mg/100 g) |
B0T1 | 3.73±0.01ed | 16.87±0.02a | 282.16±1.38a |
B0T2 | 3.46±0.03f | 16.50±0.20ba | 279.56±4.04ba |
B0T3 | 3.41±0.07f | 15.80±0.36bdc | 273.33±2.08bc |
B1T1 | 3.81±0.04cbd | 16.17±0.31bac | 265.27±2.61dc |
B1T2 | 3.74±0.02ed | 15.63±0.32bedc | 257.96±4.73de |
B1T3 | 3.74±0.04ed | 14.50±0.50f | 241.33±4.73f |
B2T1 | 3.88±0.03b | 15.73±0.25bdc | 253.33±3.22e |
B2T2 | 3.78±0.04ced | 15.40±0.36fedc | 237.60±0.70gf |
B2T3 | 3.69±0.07e | 14.73±0.46fe | 232.00±5.68gh |
B3T1 | 4.03±0.01a | 15.53±0.31edc | 225.30±0.76ih |
B3T2 | 3.71±0.01e | 15.20±0.20fe | 223.47±0.92ih |
B3T3 | 3.87±0.03cb | 15.47±0.31edc | 220.46±0.84i |
CV (%) | 0.87 | 2.04 | 1.17 |
LSD | 0.10 | 0.94 | 8.65 |
All value was mean ± standard deviation. Means within a column with the different superscript letter are significantly different at P˂0.05. Where: CV = Coefficient of variance, LSD = Least significant difference, B0 = Control, T1 = 24 hour, T2 = 48 hour, T3 = 72 hour.
3.4. Fermentation Duration Became Longer, the Tannin and Phytic Acid Content Decreased | [50] | W. H. Abdelhaleem, A. H. El Tinay, A. I. Mustafa, and E. E. Babiker, “Effect of fermentation, malt-pretreatment and cooking on antinutritional factors and protein digestibility of sorghum cultivars,” Pakistan J. Nutr., vol. 7, no. 2, pp. 335-341, 2008, https://doi.org/10.3923/pjn.2008.335.341 |
[50]
3.4.1. Sensory Evaluation of Composite Flour Injera
Main effect of factors on sensory acceptability of sorghum-barley-potato composite flour injera.
Seven-point hedonic scale was used to evaluate the acceptability of injeras in sensory attributes. The results of sensory evaluation such as color, taste, texture, roll-ability, eye evenness, eye distribution, underneath appearance and overall acceptability of injera sample were judged by panelists and the data are shown in
Table 8.
Difference in blending ratio had resulted in a significant difference (P˂0.05) on the color acceptability scores of blended injeras. The value was ranged from 5.37 of the control sample to 5.90 found in injera sample made from 80% sorghum, 15% barley and 5% potato flours as well as 6.01 found in injera samples made from 50% sorghum, 25% barley, and 25% potato flours. It appears that high scores for color acceptability of B1 and B3 injeras were equal with like moderately (6.00) level in the 7-point hedonic scale. The lowest value (5.37) approximately equal with the slightly like (5.00) scale for injera of control sample (100% sorghum flour). Similarly, fermentation duration had a significant difference (P˂0.05) on color acceptability of injera. The recorded values ranged from 5.65 to 5.87, the highest value being injera samples fermented for 72 hours and the lowest value of injera samples fermented for 48 hours.
Table 8. Main effects of blending ratio and fermentation duration on sensory acceptability of composite injera.
BR | Color | Taste | Texture | Roll ability | Eye evenness | Eye distribution | Underneath appearance | Overall acceptability |
B0 | 5.37±0.63c | 5.54±0.55a | 5.38±0.53b | 5.47±0.59b | 5.38±0.53b | 5.36±0.54c | 5.37±0.53b | 5.45±0.57b |
B1 | 5.90±0.46ba | 5.57±0.58a | 5.68±0.58a | 5.64±0.55ba | 5.64±0.55a | 5.68±0.43ba | 5.70±0.52a | 5.69±0.47a |
B2 | 5.72±0.55b | 5.44±0.53a | 5.46±0.49b | 5.69±0.56a | 5.64±0.52a | 5.74±0.48a | 5.60±0.50a | 5.56±0.51a |
B3 | 6.01±0.36a | 5.58±0.51a | 5.71±0.51a | 5.55±0.54ba | 5.63±0.54a | 5.82±0.50a | 5.60±0.54a | 5.65±0.50a |
CV (%) | 8.86 | 9.85 | 9.50 | 9.98 | 9.59 | 8.60 | 9.38 | 9.18 |
LSD | 0.19 | 0.20 | 0.21 | 0.22 | 0.23 | 0.18 | 0.17 | 0.16 |
FD | | | | | | | | |
T1 | 5.72±0.63ba | 5.57±0.58a | 5.61±0.62a | 5.52±0.60b | 4.86±0.58c | 5.24±0.54b | 5.55±0.59a | 5.57±0.57a |
T2 | 5.65±0.56b | 5.57±0.52a | 5.63±0.51a | 5.53±0.54b | 5.84±0.53b | 5.64±0.55ba | 5.54±0.52a | 5.57±0.49a |
T3 | 5.87±0.48a | 5.46±0.54b | 5.42±0.47ba | 5.71±0.53a | 6.02±0.52a | 5.87±0.39a | 5.62±0.49a | 5.63±0.49a |
CV (%) | 9.67 | 9.84 | 9.68 | 9.68 | 9.96 | 8.81 | 9.60 | 9.30 |
LSD | 0.17 | 0.10 | 0.15 | 0.14 | 0.16 | 0.20 | 0.18 | 0.11 |
All values are mean ± standard deviation. Values in the same column with different superscript letter are significantly different (P˂0.05). Where: BR = Blending ratio, FD = Fermentation duration, CV = Coefficient of variance, LSD = Least significant difference, B0 = Control sample (100% sorghum flour), T1 = 24 hour, T2 = 48 hour, T3 = 72 hour.
On the other hand, blending ratio had no significant difference (P˃0.05) on acceptability of taste of injeras (
Table 8) with the scored values ranged between 5.44 and 5.58. However, fermentation duration had significant difference (P˂0.05) on the taste acceptability of injera. The highest value (5.57) which is above like slightly (5.00) scale and below like moderately (6.00) scale was observed in an injera sample fermented for 24 and 48 hours. Statistically lower score (5.46) was recorded for samples of longest (72 hour) fermentation.
The acceptability scores for the texture of injera were significantly (P˂0.05) affected by blending ratio. Statistically the highest values 5.71 and 5.68 were observed for injera sample with blended proportion of 50% sorghum, 25% barley, and 25% potato flours and for those samples with blended proportion of 80% sorghum, 15% barley, and 5% potato flours. Statistically the lower value 5.38 found in injera of control (100% sorghum flour) and 5.46 of injera sample made from 70% sorghum, 20% barley, and 10% potato flour. Likely wise, the acceptability score for texture of injera were 5.61, 5.63, and 5.42 recorded for injera samples fermented at 24, 48 and 72 hours, respectively with no statistical difference between first two.
The acceptability of injera roll ability was significantly (P˂0.05) affected by blending ratios (
Table 8). The scored result in the current study ranged from 5.47 to 5.69. The lowest value was observed in injera samples made from control flour and highest in injera samples made from 70% sorghum, 20% barley, and 10% potato flours. Both maximum and minimum values were below moderately like (6.00) scale and above like slightly (5.00) scale. Similarly, fermentation duration had a significant difference (P˂0.05) on the acceptability of injera roll ability (
Table 8). The highest value (5.71) was observed in an injera sample which fermented to 72 hours whereas the 24 and 48 hour fermentation did not show significant difference (P>0.05) with values of 5.52 and 5.53, respectively. As fermentation duration of injera increased, the acceptability of roll ability also increased.
Regarding the acceptability of eye evenness of injera there was a significant difference (P˂0.05) between that of flour blends and control sample (100% sorghum flour), with the latter having significantly lower score of 5.38 than the 5.63 and 5.64 of the composite flour injeras. All scores were above 5.00 which shows slight liking in the scale and lower than 6.00 which shows moderate liking. The data showed that products of composite flour were more preferred by panelists than that of the control sample in this parameter. Similarly, there was significant difference (P˂0.05) on eye evenness acceptability of injera, due to fermentation duration (
Table 8).
The highest value (6.02) was observed in samples which were fermented for 72 hours and scores dropped to 4.86 and 5.86 for those of 24 and 48 hours of fermentation duration, respectively.
Regarding the acceptability of eye distribution of injera, there was a significant difference (P˂0.05) between that of flour blends and control sample (100% sorghum flour), the latter having significantly (P<0.05) lower score of 5.36 than the 5.68, 5.74 and 5.82 of the three composite products.
The three blends of flours didn’t show significant difference among their scores. This indicated that the panelists had more preference for the eye distribution of the injeras of the composite flours than that of the control sample.
Similarly, the fermentation duration had significantly (P˂0.05) affected the acceptability of eye distribution of injera (
Table 8). Significantly lower score of 5.24 was recorded for the shortest fermentation time, while the 48 and 72 hour fermentations resulted in scores of 5.64 and 5.87, respectively.
Regarding the acceptability of the underneath appearance of injera, it was significantly (P˂0.05) affected by blending ratios. The recorded values were 5.37, 5.70, 5.60, and 5.60 with the lowest value belonging to the control sample and statistically different from the others which showed no difference among themselves and indicating that the blending ratio had no influence on the parameter.
Similarly, fermentation duration had no significant effect (P˃0.05) on the acceptability of underneath appearance of injera. The recorded values were 5.55, 5.54, and 5.64 for injeras of dough fermented for 24, 48, and 72 hours, respectively (
Table 8)
The overall acceptability scores of injeras of composite flours showed no significant difference (P>0.05) due to blending ratio (
Table 8) except the fact that they are all significantly (P<0.05) higher than that of the control sample. The values of the composite flour products were 5.69, 5.56 And 5.65 for blending proportions of B1 (80% sorghum, 15% barley and 5% potato flours), B2 (70% sorghum, 20% barley and 10% potato flours) and B3 (50% sorghum, 25% barley and 25% potato flour), respectively; whereas that of the control sample (100% sorghum flour) was 5.45. On the other hand, there were no significant differences (P˃0.05) in overall acceptability of injera due to fermentation duration.
3.4.2. Interaction Effect of Factors on Sensory Acceptability of Sorghum-Barley-Potato Composite Flour Injera
The interaction between blending ratio and fermentation duration had significant differences (P˂0.05) on acceptability scores of color of the injeras (
Table 9). The recorded data showed that the highest mean values 5.79, 5.84, 5.91, 5.92, 6.06 and 6.16 were scored for product samples of B3T3, B2T1, B1T1, B2T3, B1T2, and B3T1, respectively; whereas the lowest value 4.98 was scored for sample of B0T1. All highest scores for color acceptability were lie in like moderately (6.00) scale 7-hedonic point and lowest one was preferred as like slightly (5.00) according to panelist preference. The color acceptability of injera in the current study ranged between 4.98 and 6.16.
Table 9 showed the parallel increase in color acceptability of the product sample with increased blending proportion of barley and potato flour. One can conclude that balanced influence was manifested by the two factors on color acceptability of injeras in their interaction. The acceptability of color in the current study was in line with the previous result, which ranged from 4.87 to 6.29 found in teff, sorghum and fenugreek composite injera, which reported by
| [38] | M. T. Awulachew and K. D. Kufi, “Mixing Ratios for Better Quality Optimization and Modeling of Teff, Sorghum and Fenugreek Flour Mixing Ratios for Better Quality Characteristics of injera by Using D-Optimal Mixture Design,” 2023, https://doi.org/10.20944/preprints202308.1709.v1 |
[38]
.
Table 9. Interaction effect of blending ratio and fermentation duration on sensory acceptability of composite injera.
Interaction | Color | Taste | Texture | Roll-ability | Eye evenness | Eye distribution | Underneath appearance | Overall acceptability |
B0T1 | 4.98±0.42e | 4.84±0.45b | 5.04±0.35dc | 5.15±0.58d | 5.09±0.49dc | 4.98±0.28c | 5.04±0.41c | 4.58±0.46c |
B0T2 | 5.37±0.53d | 5.75±0.51a | 5.51±0.59cb | 5.59±0.56a | 5.36±0.45cba | 5.35±0.38cb | 5.33±0.45cb | 5.54±0.39a |
B0T3 | 5.78±0.64ba | 5.67±0.54a | 5.50±0.48cb | 5.67±0.54a | 5.70±0.49a | 5.77±0.39a | 5.75±0.47a | 5.81±0.53a |
B1T1 | 5.91±0.53a | 5.70±0.63a | 5.89±0.56ba | 5.67±0.59ba | 5.74±0.55a | 5.85±0.36a | 5.75±0.54a | 5.70±0.54a |
B1T2 | 6.06±0.29a | 5.56±0.56a | 5.76±0.51bac | 5.43±0.54cba | 5.79±0.51a | 5.88±0.50a | 5.85±0.43a | 5.88±0.30a |
B1T3 | 5.44±0.44cb | 5.44±0.54a | 5.38±0.56dcb | 5.83±0.44a | 5.40±0.52ba | 5.88±0.45a | 5.50±0.53a | 5.48±0.46ba |
B2T1 | 5.84±0.54a | 5.62±0.54a | 5.54±0.57ba | 5.57±0.57ba | 5.85±0.46a | 5.85±0.40a | 5.84±0.47a | 5.69±0.50a |
B2T2 | 5.40±0.56cb | 5.36±0.51ba | 5.61±0.46a | 5.48±0.57cba | 5.36±0.47cba | 5.41±0.46cba | 5.37±0.48cba | 5.31±0.54b |
B2T3 | 5.92±0.43a | 5.33±0.52ba | 5.23±0.34dcb | 6.02±0.38a | 5.72±0.53a | 5.95±0.39a | 5.59±0.46a | 5.68±0.38a |
B3T1 | 6.16±0.19a | 5.75±0.52a | 5.96±0.50a | 5.69±0.53a | 5.80±0.49a | 5.68±0.57a | 5.58±0.57a | 5.88±0.38a |
B3T2 | 5.79±0.51a | 5.59±0.45a | 5.57±0.51a | 5.63±0.52a | 5.49±0.57a | 5.48±0.50ba | 5.59±0.58a | 5.53±0.52a |
B3T3 | 5.57±0.51cba | 4.35±0.51c | 5.58±0.44a | 5.32±0.51dc | 5.60±0.51a | 5.90±0.33a | 5.63±0.48a | 5.08±0.52cb |
CV (%) | 8.02 | 9.50 | 8.85 | 9.42 | 9.02 | 7.78 | 8.82 | 8.36 |
LSD | 0.39 | 0.45 | 0.42 | 0.44 | 0.43 | 0.37 | 0.41 | 0.40 |
All values are mean ± standard deviation. All values in the same column with different superscript letters were significantly different at P˂0.05. Where: CV = Coefficient of variance, LSD = Least significant difference, B0 = Control sample (100% sorghum flour), T1 = 24 hour, T2 = 48 hour, T3 = 72 hour.
The taste acceptability scores of the injeras exhibited significant differences (P˂0.05) due to interaction between blending ratio and fermentation duration as shown in
Table 9.
The recorded data varied between 4.35 and 5.75 on a scale of 7 points. The highest values 5.67, 5.70, 5.56, 5.44, 5.59 were recorded for B0T3, B1T1, B1T2, B1T3, B2T1, B3T2, respectively; as well as 5.75 for B0T2 and B3T1.
The lowest value was scored for product samples made from 50% sorghum, 25% barley, and 25% potato flour and fermented for 72 hours.
Regarding the acceptability scores of the texture of injera, significant (P˂0.05) differences were noted due to interaction of blending ratio and fermentation duration (
Table 9). The recorded data showed that the values ranged from 5.04 to 5.96. The highest values 5.57, 5.58, 5.96 and 5.61 were scored for B3T2, B3T3, B3T1, and B2T2 of the injera sample, respectively. These were preferred as moderately like scale (6.00) points in a scale of 7. The lowest value was scored for control sample injera of 100% sorghum flour fermented for 24 hours and it was in like slightly (5.00) scale as preferred by panelists.
The blending ratio and fermentation duration had also significant differences (P˂0.05) on acceptability scores of injera roll ability (
Table 9). The values ranged from 5.15 to 6.02. The highest values 5.59, 5.67, 5.83, 6.02, 5.69, and 5.63 being of injera sample of B0T2, B0T3, B1T3, B2T3, B3T1, and B3T2, respectively. These values indicated a moderate liking scale of 6.00 points in a scale of 7. The lowest value was observed for injeras of the control sample (100% sorghum flour), which was fermented for 24 hours. The score is slightly liked (5.00) according to panelists’ preference.
Similarly the acceptability of injera eye evenness and eye-distribution had been significantly (P˂0.05) affected by blending ratio and fermentation duration (
Table 9). The highest values 5.70, 5.74, 5.79, 5.85, 5.72, 5.80, 5.49, and 5.60 were recorded for injera sample of B0T3, B1T1, B1T2, B2T1, B2T3, B3T1, B3T2, and B3T3, respectively. These all scores were preferred by panelists as moderately liked. On the other hand, the lowest value (5.09) was observed for injera of the control sample (100% sorghum flour), which was fermented for 24 hours. It indicated a slightly liking level in the scale. All the scores indicated a positive response. Likely wise, the recorded scores for eye distribution acceptability of injera ranged from 4.98 to 5.95. The highest values were 5.77, 5.85, 5.85, 5.95, 5.68, and 5.90 scored for injera sample of B0T3, B1T1, B2T1, B2T3, B3T1 and B3T3, as well as 5.88 for B1T2 and B1T3. On the other hand, the lowest value was recorded for injera of the control sample (100% sorghum) which was fermented for 24 hours.
The interaction of blending ratio and fermentation duration exhibited significant differences (P˂0.05) on the scores of underneath appearance of the injeras (
Table 9). Numerically the highest values 5.50, 5.84, 5.59, 5.58, 5.59, 5.63, and 5.85 were scored for injera sample of B1T3, B2T1, B2T3, B3T1, B3T2 B3T3 and B1T2 respectively, as well as 5.75 for B0T3 and B1T1. Combinations of the two factors had resulted in scores with no significant difference from that of the highest score. The lowest of the low scores was 5.04 and was recorded for the injera of control sample (100% sorghum flour) which was fermented for 24 hours.
Finally, the overall acceptability of composite flour injeras were significantly (P˂0.05) affected by blending ratios and fermentation duration (
Table 9). Even though numerically the highest value was 5.88 that was recorded for product sample with combination of two blend proportions (B3 and B1) combined with two different fermentation times (T1 and T2) there are 8 more combinations of the two factors that resulted in injeras receiving overall acceptability scores with no significant difference from the highest values. Statistically the lowest values were 4.58 of injeras of combinations of B0T1. All of overall acceptability scores, indicated that all the products of sorghum blended with barley-potato flour received varied levels of acceptability above slight liking (5.00) scale level of acceptability in 7 hedonic scales. Generally, combination of sorghum-barley-potato flour resulted in higher acceptability scores at all fermentation durations (
Table 9).
The sensory quality evaluation has demonstrated that injera made from blending of sorghum with barley and potato flour at different blending ratio had an excellent preference score as expected and very good injera quality was obtained. This showed that injera made from different blending ratio of barley-potato flour could be used as a substitute to sorghum with reasonably fair cost and better nutritional value. In addition to this, using available cereals and roots like potato for injera making with sorghum that give consumers preferred acceptable quality is crucial to achieve food and nutritional security.
In the present study the quality and acceptability of sorghum based injera are dependent on the variety of blending ratio and fermentation time used in the experiment. Other research also indicated that the varietal difference has an impact on the quality and acceptability of injera as reported by
| [51] | A. Abraha and F. Abay, “Effect of Different Cereal Blends on the Quality of Injera a Staple Food in the Highlands of Ethiopia,” vol. 9, no. 2, pp. 232-241, 2017. |
[51]
.
The sensory quality evaluation in the current study also showed that injera made from sorghum blending with different ratios of barley and potato flour, those fermented to different duration exhibited excellent injera quality.
| [52] | B. Gebrekidan and B. Gebrehiwot, “Sorghum injera preparations and quality parameters,” in Proceedings of the International Symposium on Sorghum Grain Quality, ICRISAT Center Patancheru, India held on, 1981, pp. 55-65. |
[52]
, reported that poor quality injera with less eye distribution was found in sorghum injera, this may indicate that the poor quality in sorghum injera was due to sticky texture, bitter taste and high tannin content. As a result, the poor quality of sorghum injera had improved by combination of barley and potato flour. According to the other author, the significant difference was observed in acceptance of injera made from teff, sorghum, barley, and maize flour combination
| [53] | Z. Hadis, K. George, V. I. Street, P. O. Box, and A. Ababa, “Estimation of thermo-physical properties of selected Ethiopian indigenous foods and industrialization of Tef Injera, traditional bread,” vol. 26, no. 4, pp. 265-270, 2020. |
[53]
.
4. Summary, Conclusions and Recommendations
4.1. Summary
This study was conducted to investigate the proximate composition, mineral content, anti-nutritional content, pH, as well as the effect of blending ratio and fermentation duration on mineral, proximate composition, pH, tannin, phytic acid, and sensory acceptability of composite injeras. Three blending ratio of sorghum-barley-potato were B1, B2, and B3 (80:15:5, 70:20:10, and 50:25:25 respectively), likewise three fermentation durations (24, 48 and 72 hours) were considered for the study. The control was injera made from 100% sorghum flour.
Blending ratio and fermentation duration were observed to have a significant difference (P˂0.05) on various properties of injera product. The current study showed that blending of sorghum with barley and potato flour increased moisture content, crude fiber, total ash, zinc, calcium, and pH value, but decreased in crude fat, utilizable carbohydrate, energy content, tannin and phytic acid content. Both factors were affecting nutritional content, pH, tannin, and sensory acceptability of sorghum-barley-potato injera products. However, blending ratio was a dominant factor affecting phytic acid, zinc and calcium content of injera product, as well as crude protein was dominantly affected by fermentation time. As fermentation duration increased anti-nutritional factors such as phytic acid and tannin values were decreased.
Calcium content was significantly (P˂0.05) affected by the interaction of blending ratio and fermentation duration. The calcium content in this study ranged between 15.93 and 19.39 mg/100 g were observed in control samples that fermented for 24 hours and injera samples having 70% sorghum, 20% barley, and 10% potato flours, which fermented for 72 hours. Similarly, the interaction of blending ratio and fermentation duration had significance difference (P˂0.05) on iron content of injera and recorded value was ranged from 15.92 to 19.88 mg/100 g. These were observed in samples having 70% sorghum, 20% barley, and 10% potato flours, which fermented for 72 and 48 hours, respectively.
The pH value of injera had a significant difference (P˂0.05) due to the interaction between blending ratios and fermentation duration. The highest value (4.03) was observed in samples having 50% sorghum, 25% barley and 25% potato flours, which fermented for 24 hour and lowest values (3.41, 3.46) were observed in the control samples (100% sorghum flour), which fermented for 48 and 72 hours. Similarly, the ant nutrient of injera product such as tannin and phytic acid content were significantly (P˂0.05) affected by the interaction of blending ratios and fermentation duration. The highest values of 16.87 and 282.16 mg/100 g were scored for condensed tannin and phytic acid content, respectively, so they were found in control samples (100% sorghum flour) which fermented for 24 hours.
The interaction of blending ratio and fermentation duration had also a significant difference (P˂0.05) on the sensory acceptability of injera product. The scores for blended injeras ranged from 4.98 to 6.16 for color, 4.35 to 5.75 for taste, 5.04 to 5.96 for texture, 5.15 to 6.02 for roll ability, 5.09 to 5.85 for eye evenness, 4.98 to 5.95 for eye distribution, 5.04 to 5.85 for underneath appearance and 4.58 to 5.88 for overall acceptability of injera product.
4.2. Conclusions
Injera is an Ethiopian staple food, which is consumed widely in all parts of the country. Particularly, sorghum based injera consumed on daily bases, in Hararghe, Oromia region Ethiopia. However, sorghum injera is sticky, friable/ crumbles, and powdery when stored so the study was conducted to investigate the effect of blending ratio of barley and potato flour and fermentation duration on quality of sorghum based injera. The sorghum, barley, and potato flour was used as ingredients. The blending ratio and dough fermentation duration had significantly affected the proximate composition, mineral content, pH value, anti-nutritional factors, and sensory acceptability of sorghum-barley-potato composite injera. For example, zinc, calcium, iron, moisture, fat, protein, fiber, ash, carbohydrate, total energy, pH content, color, taste, texture, roll-ability, eye evenness, eye distribution, injera underneath and overall acceptability of composite injera was increased. However, tannin and phytic acid content was decreased. From the blended product, B1T3 (80% sorghum flour blended with 15% barley and 5% potato flour, which fermented for 72 hour), when compared with the control injera sample and it was best product in nutritional and overall sensory attributes because the nutritional content and anti-nutritional contents were improved with only slight effect on overall acceptability. The limitation of this study was firstly concerned with finance, because of money assigned by government for research work was not enough to finalize my work, but I have invested additional money from my own to finish research work. Secondly, the shortage of experimental instrument and the laboratory equipment with old version as well as the current condition in the country were the major constraint while performing this research.
4.3. Recommendations
(1) Study on optimization conditions such as fermentation temperature, baking temperature and time.
(2) Additional studies are recommended for pH content of batter and other engineering properties such as rheological properties of batter and thermal properties of injera.
(3) Study storage condition, shelf life, selection of packaging material, which enable good handling and sauce absorption index of sorghum-barley-potato composite injera is recommended for the coming studies.