Abstract
This study leverages the implementation of China's pilot Emissions Trading Scheme (ETS) policies as a quasi-natural experiment. Utilizing panel data from 284 prefecture-level and above cities in China spanning 2003 to 2017, we employ a multi-period difference-in-differences (DID) approach to empirically investigate the carbon reduction effects, underlying mechanisms, and heterogeneity associated with the ETS pilots. The findings reveal that: (1) The ETS effectively reduces both the total carbon emissions and carbon intensity in the pilot regions through dual channels of aggregate control and efficiency improvement. This conclusion remains robust after a series of rigorous tests. (2) The ETS achieves carbon reduction in pilot cities through the combined action of market mechanisms and administrative interventions. While the role of market mechanisms is relatively limited, administrative interventions contribute significantly. (3) The carbon reduction effects of the ETS exhibit significant heterogeneity. From the perspective of urban resource endowment, non-resource-based cities outperform resource-based cities in carbon reduction effectiveness. Regarding allowance allocation methods, regions employing a hybrid approach combining free allocation with auction and fixed-price sales demonstrate superior carbon reduction outcomes compared to those using solely free allocation or a combination of free allocation and auction. In terms of carbon price, the ETS policy demonstrates greater effectiveness in reducing total carbon emissions in high-carbon-price regions than in low- and medium-carbon-price regions, but its effectiveness in reducing carbon intensity is weaker in high-price regions compared to low- and medium-price regions. This study provides empirical evidence and policy insights for China to tailor the implementation of its ETS to local conditions, thereby advancing the achievement of its "dual carbon" goals (carbon peaking and carbon neutrality) and fostering green transition development.
Keywords
Emissions Trading Scheme Policy, Carbon Emission Reduction, Difference-in-Differences Method
1. Introduction
With the increasingly severe global climate change, governments, enterprises, and residents worldwide have become more aware of the importance of addressing climate change, regarding it as a common cause of all mankind. A growing number of countries, regions, cities, and enterprises have made net-zero emission or carbon neutrality commitments. On September 22, 2020, General Secretary Xi Jinping announced at the 75th United Nations General Assembly General Debate that China will strive to peak carbon dioxide emissions by 2030 and achieve carbon neutrality by 2060
| [1] | Guo Chaoxian. Carbon Neutralization in 2060 Causes Fundamental Changes in China's Economic System [J]. Journal of Beijing University of Technology (Social Sciences Edition), 2021, 21(5): 64-77. |
[1]
.
Cities, as the main areas of various greenhouse gas emissions, play a crucial role in decarbonization transformation in addressing climate change. In October 2011, the General Office of the National Development and Reform Commission issued the "Notice on Carrying out Pilot Work on Carbon Emission Rights Trading" (Fagai Ban Qihou [2011] No. 2601), approving seven provinces and cities to carry out carbon emission rights trading pilots. Shenzhen, Beijing, Shanghai, Tianjin, and Guangdong Province officially launched carbon emission rights trading in 2013; Chongqing and Hubei Province in 2014; and Fujian Province in 2016. Theoretically, the carbon price should be equal to the marginal cost of carbon emission reduction. However, due to significant differences in emission reduction costs across regions, industries, and technologies, and the difficulty in quantifying emission reduction costs, short-to-medium-term carbon prices are mainly determined by the market supply and demand of carbon quotas among enterprises. In practice, there are still many controversies regarding whether China's carbon emission rights trading pilot policy has effectively achieved the expected effect of driving carbon emission reduction and whether the market mechanism has fully played its role, which requires further discussion.
2. Literature Review
The theoretical basis of carbon emission rights trading originates from the emission rights trading theory based on Coase's theorem. The emission rights trading theory regards environmental pollution as a property right granted by the government to enterprises, and believes that externalities can be solved through market transactions of pollution rights
. Under carbon emission rights trading, enterprises adjust their production behaviors according to received market signals and the law of value, improve production efficiency, strengthen green structural transformation, and participate in market competition. Some theoretical literatures use ex-ante data simulation to demonstrate the effectiveness of carbon emission rights trading under equilibrium models
,
4].
The launch of carbon market pilots in seven regions from 2013 to 2014 provides a good quasi-natural experimental basis for testing the effectiveness of China's carbon market. In terms of empirical testing, scholars have generally focused on carbon emissions, economic effects, energy consumption, industrial structure, etc.
| [5] | Li Ronghua, Du Hao. Emission reduction effects and regional differences of carbon emission trading pilot projects under "double carbon" targets [J]. Economics and Management Research, 2023, 44(11): 25-44.
https://doi.org/10.13502/j.cnki.issn1000-7636.2023.11.002 |
| [6] | Luxi Li, Shi Wu, Yuan Tian. Carbon emissions trading and green technology innovation [J]. Statistics and Information Forum, 2024, 39(06): 89-99. |
| [7] | Chen Xiangyang, Dale. "Incremental Regulation" or "Stock Optimization"--Impact of Carbon Trading System on Overcapacity of Urban Secondary Industry in China [J]. Journal of China University of Geosciences (Social Sciences Edition), 2023, 23(05): 16-30.
https://doi.org/10.16493/j.cnki.42-1627/c.20230823.002 |
| [8] | Sun Jingbing, Gu Zhenyang. Will Carbon Emission Trading Mechanism Force Industrial Structure Transformation and Upgrading? Based on the perspective of manufacturing industry and producer service industry collaborative agglomeration [J]. Ecological Economics, 2023, 39(05): 59-68. |
[5-8]
. From the perspective of impacts on micro-enterprise performance, studies have focused on enterprise carbon emission reduction effects, enterprise R&D innovation, market value of listed companies, etc.
| [9] | Hoffmann V. EU ETS and Investment Decisions. European Management Journal, 2007(6): 464-474.
https://doi.org/10.1016/j.emj.2007.07.008 |
| [10] | Song Deyong, Zhu Wenbo, Wang Banban. Micro Empirical Study of Carbon Trading Pilot Covering Enterprises in China: Carbon Emissions Trading, Quota Allocation Methods and Green Innovation of Enterprises. China Population, Resources and Environment, 2021(1): 37-47. |
| [11] | Hu Haoran, Song Yanqun. Market-incentive environmental regulation and enterprise risk-taking: a case study of carbon emission trading pilot policy [J]. Contemporary Economic Science: 1-16.
https://doi.org/10.20069/j.cnki.DJKX.202404006 |
| [12] | Hu Yufeng, Ding Youqiang. Can carbon emission trading mechanism balance enterprise benefit and green efficiency? China Population, Resources and Environment, 2020(3): 56-64. |
[9-12]
. Regarding the impact on regional carbon emissions and carbon emission intensity, most scholars support the positive effect of carbon trading on carbon emission reduction and carbon emission efficiency, while some scholars argue that the pilot policy has not effectively reduced carbon emission intensity
,
14]. There are still controversies in research conclusions, which require further discussion.
Regarding the mechanism by which the carbon trading system promotes carbon emission reduction, scholars have focused on possible channels such as GDP growth, enterprise output, capital market valuation, and technological innovation. Most studies have focused on industrial structure. Carbon emission rights trading can cause changes in industrial structure and differences in industrial structure between regions, thereby producing differentiated emission reduction effects. Some scholars have proposed from the perspective of energy structure that carbon emission rights trading can force enterprises to adjust their energy structure and improve energy efficiency, thereby reducing carbon emissions
,
16]. In terms of technological progress, some scholars believe that carbon emission rights trading drives low-carbon transformation of industrial economy by encouraging enterprise technological innovation, encouraging regions to actively increase carbon sinks, and guiding capital to flow to green and low-carbon sectors
,
18].
In summary, existing research results are quite rich, but there are still deficiencies and challenges. First, few scholars have considered the overall policy effect of carbon emission rights trading policy on both the carbon absorption side and the carbon emission side from the perspective of carbon neutrality. Second, existing literatures focusing on China mostly examine the policy effect of carbon emission rights trading pilots at the provincial level, lacking relevant empirical evidence at the city level; on this basis, most literatures studying the impact of carbon trading pilots on regional carbon emission reduction use provincial panel data, provincial industrial panel data, etc., which cannot well satisfy the parallel trend assumption required by the DID model and have endogeneity problems. Third, due to the low development level of the current carbon trading market and poor availability of micro-data, existing studies have insufficiently examined the mechanism by which the carbon emission rights trading pilot policy drives energy conservation and emission reduction. Fourth, existing studies on the heterogeneity of the emission reduction effect of carbon emission rights trading policy are relatively simplistic. In view of this, the possible marginal contributions of this paper are: First, based on city-level data, considering both total carbon emission reduction and efficiency, to examine the emission reduction effect of carbon emission rights trading policy from multiple perspectives; second, based on the perspective of the role of market mechanisms and administrative intervention, to demonstrate the mechanism and policy effect of the carbon market in promoting carbon emission reduction; third, to incorporate carbon emission rights quota allocation models and carbon prices into heterogeneity analysis, and explore the emission reduction effect of carbon emission rights trading policy under different carbon emission rights quota allocation models and carbon prices.
3. Research Design and Data Sources
3.1. Model Construction
Since the eight pilot regions launched carbon markets at different times, this paper uses the multi-period difference-in-differences method to estimate the impact of carbon markets on regional carbon emissions and carbon intensity. On the basis of controlling other factors unchanged, the multi-period DID method can test whether there are significant differences in carbon emissions and carbon intensity between pilot regions and non-pilot regions before and after the launch of the carbon market. The corresponding multi-period DID model is as follows:
(1)
In the equation, subscripts i and t denote region and year, respectively; is the dependent variable, representing either regional carbon emissions or carbon intensity; is the core explanatory variable, namely the multi-period difference-in-differences (DID) term, where indicates the treatment group status and indicates the post-treatment period; represents control variables affecting carbon emissions or carbon intensity that vary across regions i and over time t; denotes region fixed effects, controlling for time-invariant region-specific factors affecting carbon emissions or carbon intensity; denotes time fixed effects, controlling for time-varying factors common to all regions; and is the error term. If the carbon market significantly reduces local carbon emissions or carbon intensity, is expected to be statistically significantly negative.
3.2. Variable Selection
3.2.1. Dependent Variables
The dependent variables in this paper are regional carbon emissions and carbon intensity, both in logarithmic form (lny1, lny2). In the process of low-carbon development, the goal is to reduce carbon emissions while achieving economic growth, realizing a win-win situation between carbon emission reduction and economic development. The carbon emission intensity indicator can not only take into account both carbon emission reduction and economic growth, but also is more in line with China's national conditions. Therefore, the emission reduction level of pilot regions is measured from both the total amount and efficiency of carbon emission reduction.
3.2.2. Explanatory Variable
The core explanatory variable in this paper is , indicating whether city i implemented an emissions trading scheme (ETS) in year t. Its estimated coefficient is used to measure the implementation effect of the ETS policy.
The assignment rule for is: When i represents prefecture-level cities within Beijing, Tianjin, Shanghai, Chongqing, as well as Guangdong, Hubei, and Fujian provinces, takes the value 1, constituting the treatment group. When i represents other regions, takes the value 0, constituting the control group.
The assignment rule for is: When i represents prefecture-level cities under the jurisdiction of Beijing, Shanghai, Tianjin, and Guangdong and t≥2013; or when i represents prefecture-level cities under the jurisdiction of Chongqing and Hubei and t≥2014; or when i represents prefecture-level cities under the jurisdiction of Fujian and t≥2016, takes the value 1. Conversely, takes the value 0.
3.2.3. Control Variables
Referring to the studies of Cao and Su (2023)
| [20] | Cao Xiang, Su Xiner. Does carbon trading pilot policy promote carbon neutral technological innovation? [J]. China Population, Resources and Environment, 2023, 33(07): 94-104. |
[20]
, Dong and Wang (2021)
| [19] | Dong Zhiqing, Wang Hui. Validity test of market-based environmental regulation policy: empirical evidence from the perspective of carbon emission trading policy [J]. Statistical Research, 2021, 38(10): 4 8-61.
https://doi.org/10.19343/j.cnki.11-1302/c.2021.10.005 |
[19]
, and Xu and Cui (2020)
, the following control variables are selected: (1) Urban economic density, specifically the ratio of real GDP to urban area (gdp); (2) Urbanization level, specifically the ratio of urban permanent popu ation to total permanent population (pop); (3) Industrial structure, specifically the proportion of the secondary industry (sec) and the proportion of the tertiary industry (ter); (4) Energy structure, specifically the ratio of coal consumption to total energy consumption (es); (5) Market scale, specifically the logarithm of total retail sales of social consumer goods (consump) and the logarithm of the number of industrial enterprises above designated size (enterprise); (6) Degree of opening up, specifically the logarithm of the ratio of actually used foreign capital to GDP in the current year (fdi); (7) Innovation level, specifically the logarithm of the number of patents granted in the region in the current year (inv).
3.3. Data Sources
Considering that the national carbon trading market for the power industry was officially established in December 2017, to meet the premise assumption of the DID model, this paper sets the sample period to end in 2017. Considering the availability and continuity of data, panel data of 284 prefecture-level and above cities in China from 2003 to 2017 are selected as the research sample. Among the above variables, carbon emission data are derived from the county-level carbon emission inventory of the China Emission Accounts and Datasets (CEADs), and CO2 emissions are estimated by unifying the scale of DMSP/OLS and NPP/VIIRS satellite images using the Particle Swarm Optimization-Back Propagation (PSO-BP) algorithm
. This data takes into account the significant ability of vegetation to sequester and reduce CO2 emissions, and further calculates the carbon sequestration of terrestrial vegetation at the county level, thereby estimating more accurate net carbon emissions, which is closer to the connotation of carbon neutrality. City-level data are aggregated from county-level data. Data related to carbon emission rights trading pilot policies such as carbon prices and trading volume are derived from the Wind database; patent data are from CNRDS (China Research Data Services Platform); other data are from the "China City Statistical Yearbook" over the years.
4. Empirical Results and Analysis
4.1. Baseline Regression Results
Table 1 reports the baseline regression results of equation (
1). All regression results control for year fixed effects and city fixed effects. Columns (1), (2), (3), and (4) of
Table 1 all report cluster standard errors at the city level. Columns (1) and (2) do not add control variables, while columns (3) and (4) add control variables. It can be seen from
Table 1 that when only year fixed effects and city fixed effects are controlled, the DID coefficients affecting carbon emissions and carbon intensity are significantly negative at the 1% level, with coefficient values of -0.107 and -0.134, respectively. After adding control variables, the DID coefficients affecting carbon emissions and carbon intensity are still significantly negative at the 1% level, with coefficient values of -0.087 and -0.084, respectively. Therefore, the carbon market reduces both carbon emissions and carbon intensity in pilot regions.
Table 1. Baseline Regression Results.
| (1) | (2) | (3) | (4) |
| Carbon emissions | Carbon intensity | Carbon emissions | Carbon intensity |
| lny1 | lny2 | lny1 | lny2 |
treati×postit | -0.107*** | -0.134*** | -0.087*** | -0.084*** |
| (0.018) | (0.025) | (0.015) | (0.022) |
Control variables | No | No | Yes | Yes |
Constant term | Yes | Yes | Yes | Yes |
Year fixed effects | Yes | Yes | Yes | Yes |
City fixed effects | Yes | Yes | Yes | Yes |
Observations | 4,260 | 4,260 | 4,002 | 4,002 |
R2 | 0.988 | 0.943 | 0.990 | 0.958 |
4.2. Robustness Tests
4.2.1. Parallel Trend Test
The premise of the effectiveness of the multi-period DID method is that the treatment group and the control group have a consistent trend before the policy implementation. This paper refers to the research methods of Zhang, Tong, and Li (2019)
and Wu, Qi, and Xian (2021)
| [24] | Wu Yinyin, Qi Jie, Xian Qin. Study on Carbon Emission Reduction Effect of Carbon Market in China--Based on Synergy of Market Mechanism and Administrative Intervention [J]. China Industrial Economics, 2021(8): 114-132.
https://doi.org/10.19581/j.cnki.ciejournal.2021.08.007 |
[24]
to test the parallel trend assumption based on event study. The specific model is as follows:
(2)
If city i is in the k-th year after or before the implementation of the carbon emission rights trading pilot policy, is 1; otherwise, it is 0; represents the impact of carbon emission rights trading on carbon emission reduction in pilot regions. This paper takes 7 years before the implementation of the carbon emission rights trading pilot policy as the comparison benchmark, considering 6 years before the pilot policy implementation, the year of implementation, and 4 years after implementation. Other variables are defined the same as in model (1).
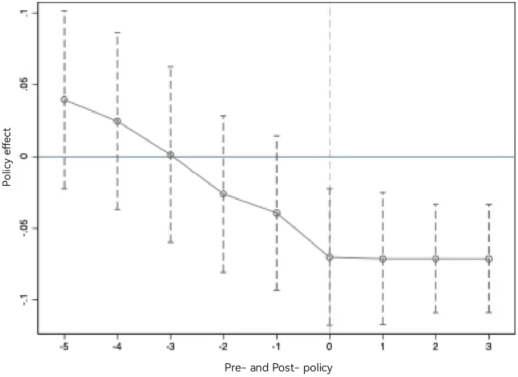
The results of the parallel trend test are shown in
Figure 1. The corresponding coefficients of carbon emissions from 1 year to 5 years before the implementation of the carbon emission rights trading pilot policy are not significant, indicating that there is no significant difference between the treatment group and the control group from 1 year to 5 years before the implementation of the pilot policy; the corresponding coefficients of carbon emissions from 1 year to 3 years after the implementation of the pilot policy are significant, indicating that there is a significant difference between the treatment group and the control group from 1 year to 3 years after the implementation of the pilot policy, satisfying the parallel trend assumption.
However, there is a certain negative correlation trend before the implementation of the carbon emission rights trading pilot policy, which may be due to the existence of an expected effect of the policy in pilot regions
,
26]. In the stage before the official operation of the carbon market, although the formulation and discussion of relevant policies have not been transformed into specific regulatory measures and are still in the stage of policy design and discussion, enterprises may adjust their production methods and models in advance based on psychological expectations of future policy implementation, especially high-carbon emission enterprises pay close attention to carbon market policy information. Such anticipatory adaptive behaviors may lead to a reduction in enterprises' carbon emissions in advance. Regarding the explanation of the trend before the implementation of the carbon emission rights trading pilot policy, there may be other factors. The pilot policies were mainly implemented in 2013 and 2014, and the previous year was 2012 and 2013. During this period, which was the early stage of the "12th Five-Year Plan", China officially set the carbon intensity reduction target as a binding indicator, and economically developed regions such as Beijing, Shanghai, and Shenzhen may have taken the lead in low-carbon transformation. Thus, this trend may not reflect the expected policy effect of the carbon market, but the role of the "12th Five-Year Plan" policy in promoting low-carbon economic transformation in economically developed regions. Since the empirical model constructed in this paper has not included variables such as energy conservation and emission reduction targets of various regions during the "12th Five-Year Plan" period, this trend does not exclude the impact of the "12th Five-Year Plan" and requires further research and data analysis for verification.
Figure 1. Results of Parallel Trend Test.
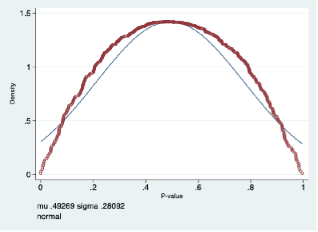
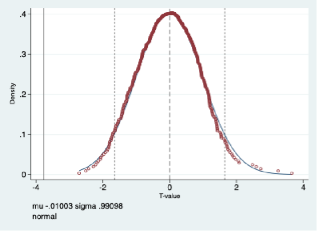
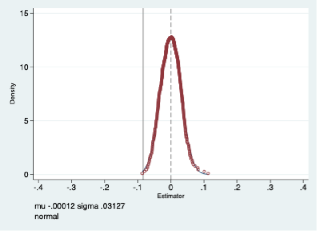
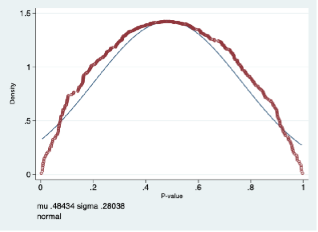
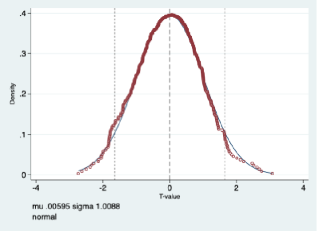
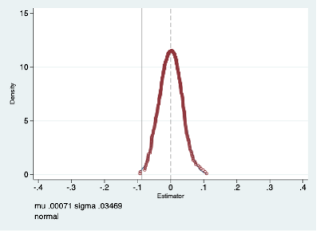
4.2.2. Placebo Test
To enhance the credibility of the baseline regression results, this paper uses the non-parametric permutation test method for placebo test. When using multi-year data for DID empirical analysis, there may be standard error bias caused by serial correlation, which may lead to excessive rejection of the null hypothesis in regression tests
| [27] | La Ferrara, E., A. Chong, and S. Duryea. Soap Operas and Fertility: Evidence from Brazil [J]. American Economic Journal: Applied Economics, 2012, 4(4): 1-31. |
[27]
. The operation of the placebo test in this paper is as follows: conduct a placebo test by randomly assigning pilot cities and randomly selecting the implementation time of the carbon emission rights trading policy. Each time, 8 provincial regions and their corresponding random policy time points are selected, and the cities corresponding to the selected 8 provincial regions are taken as the virtual treatment group, and the remaining cities as the virtual control group. The entire process is repeated 500 times. The regression results are shown in Appendix I, which pass the placebo test.
4.2.3. Eliminating the Impact of Other Policies
Policies such as the emission rights trading pilot starting in 2007 and the low-carbon city pilot starting in 2010 may affect carbon emissions and carbon intensity in pilot regions
, thereby interfering with the identification of the policy effect of the carbon market pilot. This paper conducts multi-period DID regression tests after excluding city samples of emission rights trading pilots. The regression results are shown in
Table 2: after excluding the emission rights trading pilot policy, the regression coefficients are significantly negative at the 1% and 5% levels, indicating that the baseline regression results of this paper are robust. This paper only retains city samples of low-carbon city pilots for multi-period DID regression tests. The regression results are shown in
Table 3: after excluding the impact of the low-carbon city pilot policy, the regression coefficients are significantly negative at the 1% level, indicating that the baseline regression results of this paper are robust.
Table 2. Regression Results After Excluding the Impact of Emission Rights Trading Pilot Policy.
| (1) | (2) | (3) | (4) |
| lny1 | lny2 | lny1 | lny2 |
DID | -0.114*** | -0.091*** | -0.082*** | -0.064** |
| (0.025) | (0.030) | (0.020) | (0.027) |
Control variables | No | No | Yes | Yes |
Constant term | Yes | Yes | Yes | Yes |
Year fixed effects | Yes | Yes | Yes | Yes |
City fixed effects | Yes | Yes | Yes | Yes |
Sample size | 2,625 | 2,625 | 2,427 | 2,427 |
R2 | 0.985 | 0.936 | 0.988 | 0.955 |
Table 3. Regression Results After Excluding the Impact of Low-Carbon City Pilot Policy.
| (1) | (2) | (3) | (4) |
| lny1 | lny2 | lny1 | lny2 |
DID | -0.123*** | -0.125*** | -0.111*** | -0.076*** |
| (0.023) | (0.031) | (0.019) | (0.026) |
Control variables | No | No | Yes | Yes |
Constant term | Yes | Yes | Yes | Yes |
Year fixed effects | Yes | Yes | Yes | Yes |
City fixed effects | Yes | Yes | Yes | Yes |
Sample size | 1,830 | 1,830 | 1,734 | 1,734 |
R2 | 0.989 | 0.945 | 0.991 | 0.962 |
4.2.4. Excluding Samples of the 2008 Financial Crisis
The 2008 financial crisis had an adverse impact on the overall economy. To exclude the possibility of policy evaluation bias caused by its impact on regression results, this paper excludes samples during the financial crisis and retains samples from 2009 onwards for re-conducting baseline regression. The regression results are shown in
Table 4: after excluding the impact of the financial crisis, the regression coefficients are significantly negative at the 1% level, and the carbon emission rights trading policy can still significantly reduce carbon emissions and carbon intensity, further indicating that the research results are robust.
Table 4. Regression Results After Excluding Samples of the 2008 Financial Crisis.
| (1) | (2) | (3) | (4) |
| lny1 | lny2 | lny1 | lny2 |
DID | -0.056*** | -0.125*** | -0.056*** | -0.070*** |
| (0.013) | (0.018) | (0.012) | (0.016) |
Control variables | No | No | Yes | Yes |
Constant term | Yes | Yes | Yes | Yes |
Year fixed effects | Yes | Yes | Yes | Yes |
City fixed effects | Yes | Yes | Yes | Yes |
Sample size | 2,556 | 2,556 | 2,436 | 2,436 |
R2 | 0.993 | 0.962 | 0.994 | 0.976 |
5. Mechanism Tests
5.1. Test of "Market Mechanism"
Due to the current imperfections in the development of China’s carbon market, the market mechanism may exhibit functional deficiencies. As a result, the observed carbon emission reduction effects in pilot areas may not be solely attributable to carbon trading. To assess the extent to which emission reductions are achieved through the market mechanism, this study draws on the methodologies of Cao et al. (2021)
| [29] | Cao J., Ho M. S., Ma R., et al. When Carbon Emission Trading Meets a Regulated Industry:Evidence from the Electricity Sector of China [J]. Journal of Public Economics, 2021, 200: 104470. https://doi.org/10.1016/j.jpubeco.2021.104470 |
[29]
and Wu et al. (2021)
| [24] | Wu Yinyin, Qi Jie, Xian Qin. Study on Carbon Emission Reduction Effect of Carbon Market in China--Based on Synergy of Market Mechanism and Administrative Intervention [J]. China Industrial Economics, 2021(8): 114-132.
https://doi.org/10.19581/j.cnki.ciejournal.2021.08.007 |
[24]
, designing the following test equation for the "market mechanism":
(3)
In equation (
3),
represents the relevant the market mechanism indicators, specifically carbon price, market liquidity and relative market transaction scale, the logarithm of annual average carbon price, the logarithm of annual trading days and the proportion of carbon trading volume in carbon emission are selected respectively to measure;
corresponds to
in equation (
1), the interaction term between
and
essentially functions as an enhanced carbon trading variable that incorporates more comprehensive information.; After adding the interaction term of
and
, the coefficient
captures the carbon market effect under the condition that the market mechanism does not exist at all, and the coefficient
reflects the heterogeneous carbon emission reduction effect brought by the carbon trading pilot; Within the model, the coefficient
serves as the key coefficient to judge whether the market mechanism is effective; The definitions of other symbols remain consistent with those in Equation (
1).
Tables 5 and 6 present the empirical results for the analysis of the "market mechanism": Column (1) of
Table 5 and Column (1) of
Table 6 report the regression results for carbon emissions and carbon emission intensity, respectively, where the market mechanism is operationalized by carbon price. In both model specifications, the interaction term between the DID variable and carbon price is significantly negative at the 1% level. This finding indicates that the market mechanism, as proxied by the carbon price, exerts a significant inhibitory effect on carbon emissions. Columns (2) of
Tables 5 and 6 display the regression results when market liquidity serves as the measure of the market mechanism. In these specifications, the interaction term between the DID variable and market liquidity is statistically insignificant for both carbon emissions and carbon intensity, suggesting that the market mechanism, as measured by liquidity, does not have a significant effect. Columns (3) of
Tables 5 and 6 provide the regression results using relative market transaction size as the proxy for the market mechanism. The interaction term is statistically insignificant in the model for carbon emissions but exhibits a significant positive relationship with carbon intensity at the 5% level. This implies that the market mechanism, when measured by relative transaction size, does not effectively drive emission reductions.
In conclusion, the observed reductions in carbon emissions within pilot regions can be partially attributed to the market mechanism anchored in carbon trading. Specifically, a higher carbon price is associated with a more pronounced emission reduction effect. In contrast, neither market liquidity nor relative market trading volume demonstrates a significant role in enhancing the effectiveness of the carbon market in driving emission reductions. Overall, the empirical evidence suggests that the market mechanism operating within China’s pilot carbon markets exerts a limited impact on emission reduction. This finding indicates that the observed declines in carbon emissions are likely driven not solely by carbon trading but also by complementary non-market mechanisms.
Table 5. Regression results of carbon price, market liquidity and relative market transaction size on carbon emissions.
| (1) | (2) | (3) |
| Carbon price | Market liquidity | Relative market transaction size |
| lny1 | lny1 | lny1 |
DID | | | -0.087*** |
| | | (0.017) |
Market1 | -0.054*** | | |
| (0.011) | | |
Market2 | | 0.006 | |
| | (0.005) | |
Market3 | | | -0.029 |
| | | (0.443) |
Control variable | Yes | Yes | Yes |
Constant term | Yes | Yes | Yes |
Year fixed effect | Yes | Yes | Yes |
Urban fixed effect | Yes | Yes | Yes |
Number of samples | 151 | 151 | 4,002 |
R2 | 0.999 | 0.999 | 0.990 |
Table 6. Regression results of carbon price, market liquidity and relative market transaction size on carbon intensity.
| (1) | (2) | (3) |
| Carbon price | Market liquidity | Relative market transaction size |
| lny2 | lny2 | lny2 |
DID | | | -0.099*** |
| | | (0.022) |
Market1 | -0.060*** | | |
| (0.012) | | |
Market2 | | -0.003 | |
| | (0.008) | |
Market3 | | | 1.018** |
| | | (0.415) |
Control variable | Yes | Yes | Yes |
Constant term | Yes | Yes | Yes |
Year fixed effect | Yes | Yes | Yes |
Urban fixed effect | Yes | Yes | Yes |
Number of samples | 151 | 151 | 4,002 |
R2 | 0.997 | 0.997 | 0.958 |
5.2. Test of "Administrative Intervention" Mechanism
The test equation of "administrative intervention" in this paper is designed as follows:
(4)
In Equation (
4),
denotes the relevant indicators of administrative intervention, drawing on the methodological approach of Shao et al.(2022)
| [30] | Shao Shuai, Xu Le, Zhang Shaoyi. Can carbon emissions trading help achieve the "double carbon" goal? Evidence of heterogeneity from energy supply side and consumption side [J]. Journal of Lanzhou University (Social Sciences Edition), 2022, 50(04): 27-40.
https://doi.org/10.13885/j.issn.1000-2804.2022.04.004 |
[30]
, the selected indicators include the proportion of state-owned enterprises and the proportion of fiscal expenditure, which are respectively the proportion of state-owned fixed assets of industrial enterprises above designated size, fiscal expenditure after deducting education and science as a proportion of GDP; After incorporating the interaction term of
and
into the model, the coefficient
reflects the carbon market effect under the hypothetical scenario of complete absence of administrative intervention. In contrast, the coefficient
captures the heterogeneous carbon emission reduction effect induced by administrative intervention measures; Within this analytical framework, the coefficient
is the key coefficient to judge whether administrative intervention is effective; The definitions of other symbols remain consistent with those in Equation (
1).
Table 7 presents the empirical results of "administrative intervention." Specifically, Columns (1) and (3) of
Table 7 respectively report the regression results for carbon emission and carbon emission intensity when administrative intervention is measured by the proportion of state-owned enterprises. In these specifications, the interaction term between the DID variable and the proportion of state-owned enterprises is significantly negative at the 5% level for both carbon emissions and carbon intensity, which means that administrative intervention measured by the proportion of state-owned enterprises is effective. Columns (2) and (4) of
Table 7 display the regression results for carbon emission and carbon emission intensity when administrative intervention is proxied by the proportion of fiscal expenditure respectively. In these models, the coefficients are statistically insignificant, which means that administrative intervention measured by the proportion of fiscal expenditure is ineffective.
In summary, the carbon emission reduction effect of pilot carbon markets is partially mediated by administrative intervention mechanisms. Specifically, a higher proportion of state-owned enterprises is associated with a more pronounced enhancement of the carbon market’s emission reduction efficacy.
Table 7. Regression results of proportion of state-owned enterprises and fiscal expenditure on carbon emissions and carbon intensity.
| (1) | (2) | (3) | (4) |
| Proportion of state-owned enterprises | Fiscal expenditure as a percentage | Proportion of state-owned enterprises | Fiscal expenditure as a percentage |
| lny1 | lny1 | lny2 | lny2 |
DID | 0.017 | 0.291 | 0.060 | 0.606 |
| (0.046) | (0.314) | (0.062) | (0.427) |
Govern1 | -0.274** | | -0.378** | |
| (0.122) | | (0.167) | |
Govern2 | | -0.026 | | -0.046 |
| | (0.022) | | (0.029) |
Control variable | Yes | Yes | Yes | Yes |
Constant term | Yes | Yes | Yes | Yes |
Year fixed effect | Yes | Yes | Yes | Yes |
Urban fixed effect | Yes | Yes | Yes | Yes |
Number of samples | 4,002 | 4,002 | 4,002 | 4,248 |
R2 | 0.990 | 0.990 | 0.958 | 0.968 |
6. Heterogeneity Analysis
6.1. Heterogeneity of Urban Resource Endowment
The carbon emission reduction effects of carbon markets are associated with urban resource endowments. Resource-based cities tend to rely on high-carbon energy sources and heavy industries, excessive consumption of such resources not only contributes to environmental pollution but also exposes these cities to more severe challenges in emission reduction, posing an obstacle to sustainable development. The National Plan for the Sustainable Development of Resource-Based Cities (2013–2020) (Guofa〔2013〕No. 45) designates a list of 126 resource-based cities. Drawing on this classification, this study categorizes cities into resource-based and non-resource-based types. To examine the heterogeneous impacts of carbon trading policies across different urban resource endowments, the policy interaction term in the baseline regression model is sequentially decomposed for subgroup analysis.
Table 8 presents the regression results for carbon emissions and carbon emission intensity across cities with different resource endowments. Specifically, for both resource-based and non-resource-based cities, the estimated coefficient of the policy interaction term is significantly negative at the 1% level, which indicates that no matter what kind of resource endowment, carbon trading pilot policies can significantly reduce carbon emissions, reduce carbon emission intensity, and achieve better carbon reduction and increase sinks. Additionally, a Chow test was conducted to examine differences in regression coefficients between groups. The p-values derived from
Table 8 are all significant at the 1% level, confirming the presence of strong inter-group heterogeneity associated with urban resource endowment. An analysis of the specific coefficients reveals that the effects of reducing carbon emissions and carbon emission intensity are more pronounced in non-resource-based cities than in resource-based cities. This observed discrepancy may be attributed to the heavy dependence of resource-based cities on fossil energy, an irrational industrial structure dominated by secondary industries, and path-dependent characteristics in urban development. For instance, the reinforcement of existing technologies diminishes incentives for developing new technologies, while enterprises are reluctant to incur additional costs for adopting new technologies, collectively placing greater pressure on the low-carbon development of resource-based cities.
Table 8. Heterogeneity test of urban resource endowment.
| (1) | (2) | (3) | (4) |
| Resource-based city | Non-resource city | Resource-based city | Non-resource city |
| lny1 | lny1 | lny2 | lny2 |
DID | -0.121*** | -0.137*** | -0.142*** | -0.155*** |
| (0.023) | (0.023) | (0.051) | (0.024) |
Control variable | Yes | Yes | Yes | Yes |
Constant term | Yes | Yes | Yes | Yes |
Year fixed effect | Yes | Yes | Yes | Yes |
Urban fixed effect | Yes | Yes | Yes | Yes |
Number of samples | 1,584 | 2,418 | 1,584 | 2,481 |
R2 | 0.849 | 0.860 | 0.587 | 0.631 |
Chow test | 68.37 | 56.92 |
P-Value | 0.0000*** | 0.0000*** |
6.2. Heterogeneity of Quota Allocation Model
The allocation method of carbon emission rights exerts a significant influence on the supply structure of carbon allowances, which in turn affects carbon trading prices. Simultaneously, it is closely related to the liquidity of the carbon emission rights trading market and the enthusiasm of entities to fulfill greenhouse gas emission reduction obligations. Therefore, the allocation mode serves as the foundation of provincial carbon trading policies and plays a decisive role in determining their implementation effectiveness. The carbon trading market in China has been developed mainly by the free allocation method, supplemented by paid allocation, among which paid allocation methods include bidding auctions, pricing sales and so on. Currently, the allocation mode of carbon emission right quota of the carbon trading policy in each province is relatively different. The allocation mode of Shanghai City, Tianjin City, Chongqing City and Fujian Province only adopts the free allocation mode; the allocation mode of Guangdong Province includes free allocation and bidding auction; the allocation mode of Beijing City, Shenzhen City and Hubei Province includes free allocation, bidding auction and fixed price sale
| [31] | Xiong Ling, Qi Shaozhou, Shen Bo. Characteristics, design problems and improvement countermeasures of quota allocation mechanism for carbon trading pilot projects in China [J]. Journal of Wuhan University (Philosophy and Social Sciences Edition), 2016, 69(3): 56-64.
https://doi.org/10.14086/j.cnki.wujss.2016.03.007 |
[31]
. Based on these distinct allocation models, the policy interaction term in the baseline regression model is sequentially decomposed to examine the heterogeneous impacts of carbon trading policies under the three quota allocation frameworks.
Table 9 and
Table 10 report the regression results of carbon emissions and carbon emission intensity under different allocation modes: the interactive term estimation coefficients of the three allocation modes are significantly negative at the level of 1%, which indicates that no matter which allocation mode combination, the carbon trading pilot policy can significantly reduce carbon emissions, reduce carbon emission intensity and achieve better carbon emission reduction and sink increase effects. To further examine inter-group differences, a supplementary Chow test was conducted. The p-values obtained from
Table 9 and
Table 10 are significant at the 1% level, which indicates that the difference between groups under the heterogeneity of quota allocation mode was strong. A comparison of coefficient magnitudes reveals that the carbon emission reduction effect is most pronounced in regions employing a combined allocation mode that integrates free allocation, bidding auctions, and fixed-price sales, outperforming the other two modes. The possible reason is that although the free allocation method does not increase the burden of enterprises too much, it can ensure the participation of enterprises to a certain extent, but it is easy to lead to excessive quota issuance, market distortion and fairness problems; In contrast, the paid mode such as auction mechanism can realize higher economic efficiency, which is more conducive to promoting the marketization of the carbon price, improving the enthusiasm of greenhouse gas emission reduction obligation subjects, and promoting the liquidity of carbon emission rights trading market.
Table 9. Heterogeneity test for quota allocation model (carbon emissions).
| Free distribution model | Free distribution, bidding auction | Free allotment, auction and fixed price sale |
| (1) | (2) | (3) |
| lny1 | lny1 | lny1 |
DID | -0.180*** | -0.063*** | -0.196*** |
| (0.030) | (0.018) | (0.022) |
Control variable | Yes | Yes | Yes |
Constant term | Yes | Yes | Yes |
Year fixed effect | Yes | Yes | Yes |
Urban fixed effect | Yes | Yes | Yes |
Number of samples | 180 | 294 | 180 |
R2 | 0.920 | 0.868 | 0.899 |
Chow test | | 6.13 | |
P-Value | | 0.0001*** | |
Table 10. Heterogeneity test of quota allocation model (carbon emission intensity).
| Free distribution model | Free distribution, bidding auction | Free allotment, auction and fixed price sale |
| (1) | (2) | (3) |
| lny2 | lny2 | lny2 |
DID | -0.229*** | -0.147*** | -0.239*** |
| (0.030) | (0.019) | (0.025) |
Control variable | Yes | Yes | Yes |
Constant term | Yes | Yes | Yes |
Year fixed effect | Yes | Yes | Yes |
Urban fixed effect | Yes | Yes | Yes |
Number of samples | 180 | 294 | 180 |
R2 | 0.807 | 0.788 | 0.871 |
Chow test | | 14.23 | |
P-Value | | 0.0000*** | |
6.3. Carbon Price Heterogeneity
The implementation effect of carbon trading policy is closely related to the transaction price of carbon emissions. Considering the difference in carbon price in different pilot cities, the average transaction price of 8 pilot provinces is divided into three categories: high carbon price, medium carbon price and low carbon price. High carbon price areas include Beijing City and Shanghai City, medium carbon price areas include Guangdong Province, Hubei Province and Tianjin City and Chongqing City, and low carbon price areas include Fujian Province and Shenzhen City. According to the above carbon price differences, the policy interaction terms in the benchmark regression model are sequentially decomposed to investigate the differential effects of carbon trading policies under three carbon prices.
Table 11 reports the regression results of carbon emissions under different types of carbon prices: the interaction estimation coefficients for low carbon price regions and medium carbon price regions are not significant, and the interaction estimation coefficients for high carbon price regions are significant at th2e 10% level, indicating that the higher the carbon price, the stronger the effect of carbon trading pilot policies on reducing carbon emissions. This may be because, on the one hand, the high economic pressures facing companies can prompt them to invest more in research and development to seek technologies and processes with lower carbon emissions; on the other hand, the government's role in the carbon trading market includes maintaining carbon prices stable and promoting them gradually within reasonable and effective ranges
| [32] | Wei Lili, Ren Liyuan. Can carbon emissions trading promote green technology innovation in enterprises: a perspective based on carbon price [J]. Lanzhou Journal, 2021(7): 91-110. |
[32]
. When carbon prices are high, the government can more actively intervene in the market, strengthen management and guidance, and effectively promote the implementation of carbon trading policies, thus enhancing the effectiveness of carbon trading policies in reducing carbon emissions.
Table 11. Heterogeneity test for carbon prices (carbon emissions).
| Low carbon price region | Medium carbon price region | High carbon price region |
| (1) | (2) | (3) |
| lny1 | lny1 | lny1 |
DID | -0.059 | -0.012 | -0.278* |
| (0.051) | (0.023) | (0.041) |
Control variable | Yes | Yes | Yes |
Constant term | Yes | Yes | Yes |
Year fixed effect | Yes | Yes | Yes |
Urban fixed effect | Yes | Yes | Yes |
Number of samples | 150 | 506 | 30 |
R2 | 0.929 | 0.886 | 0.829 |
Table 12 presents the regression results of carbon emission intensity under different types of carbon prices: the interaction estimation coefficients of low carbon price and medium carbon price regions are significant at the 1% level, and the interaction estimation coefficients of high carbon price regions are significant at 10%, which indicates that the higher the carbon price, the weaker the effect of carbon trading policy on reducing carbon emission intensity. A potential explanation for this pattern lies in the relatively higher economic development levels and larger economic scales observed in high carbon price regions. By definition, carbon emission intensity declines when the growth rate of carbon dioxide emissions is lower than the growth rate of GDP. In high carbon price regions, the relatively faster GDP growth may exert an offsetting influence on the overall carbon emission intensity effect. Consequently, while carbon trading policies can effectively reduce absolute carbon emissions through higher carbon prices, their impact on carbon emission intensity may be mitigated by the countervailing effects of rapid economic growth.
Table 12. Heterogeneity test of carbon price (carbon emission intensity).
| Low carbon price region | Medium carbon price region | High carbon price region |
| (1) | (2) | (3) |
| lny2 | lny2 | lny2 |
DID | -0.124*** | -0.126*** | -0.239* |
| (0.022) | (0.016) | (0.025) |
Control variable | Yes | Yes | Yes |
Constant term | Yes | Yes | Yes |
Year fixed effect | Yes | Yes | Yes |
Urban fixed effect | Yes | Yes | Yes |
Number of samples | 150 | 506 | 30 |
R2 | 0.940 | 0.911 | 0.983 |
7. Conclusions and Policy Recommendations
Based on the panel data of 284 prefecture-level cities and above in China from 2003 to 2017, this paper empirically examines the emission reduction effects, mechanisms and heterogeneity of trading pilot projects by using the multi-period double difference method. The research results are as follows: (1) Carbon emissions trading can effectively reduce the total carbon emissions and carbon emission intensity in the pilot areas in terms of total volume and efficiency. This conclusion is still valid after passing a series of robustness tests;(2) Carbon emissions rights trading can effectively achieve carbon emission reduction in pilot cities through market mechanisms and administrative intervention, of which the role of market mechanisms is relatively limited, and administrative intervention plays a certain role;(3) The emission reduction effects of carbon emissions trading are heterogeneous. From the perspective of urban resource endowment, the carbon emission reduction effect of non-resource-based cities is better than that of resource-based cities. From the perspective of quota allocation mode, the carbon emission reduction effect of the region adopting the comprehensive mode of free allocation, bidding auction and fixed price sale is better than that of the region adopting the single free allocation mode and the comprehensive mode of free allocation and bidding auction. From the perspective of carbon price, the effect of the carbon trading pilot policy in high carbon price areas on reducing carbon emissions is better than that in low carbon price and medium carbon price areas, and the effect on reducing carbon emission intensity is weaker than that in low carbon price and medium carbon price areas.
According to the above conclusions, this paper puts forward the following suggestions: (1) The government should intensify efforts to promote the carbon trading system, with the long-term goal of establishing a unified national carbon market that incorporates participation from diverse industries. (2) The carbon trading market must leverage the positive role of market mechanisms to prevent market failures and price distortions. Concurrently, the government should employ macroeconomic controls effectively, ensuring a balanced approach between administrative intervention and market mechanisms. A clear and scientifically defined boundary should be established between government oversight and market operations.(3) Increased financial assistance should be directed toward resource-based cities to reduce their developmental reliance on fossil fuels. This can be achieved by optimizing industrial structures and providing funding for corporate R&D and innovation, thereby breaking path dependence.(4) The quota allocation system under carbon trading policies should be refined by increasing the proportion of valuable quotas, such as auctioned allowances. A hybrid allocation model integrating multiple methods should be adopted to enhance efficiency and fairness.(5) The carbon trading policy must accelerate improvements to its price mechanism, ensuring that carbon prices effectively signal the cost of emissions reduction. A well-designed pricing structure will strengthen the incentive for enterprises to adopt low-carbon practices.
Abbreviations
DID | Differences-in-Differences |
GDP | Gross Domestic Product |
PSO-BP | Particle Swarm Optimization - Backpropagation |
ETS | Emissions Trading Scheme |
Conflicts of Interest
The authors declare no conflicts of interest.
Appendix
Placebo test results are shown in
Figures 2-7.
Figure 2. Placebo test-kernel density estimates of coefficients (carbon emissions).
Figure 3. Placebo test-kernel density estimates for t values (carbon emissions).
Figure 4. Placebo test-kernel density estimation plot for P values (carbon emissions).
Figure 5. Placebo test-kernel density estimates of coefficients (carbon intensity).
Figure 6. Placebo test-kernel density estimates for t values (carbon intensity).
Figure 7. Placebo test-kernel density estimation plot for P values (carbon intensity).
References
| [1] |
Guo Chaoxian. Carbon Neutralization in 2060 Causes Fundamental Changes in China's Economic System [J]. Journal of Beijing University of Technology (Social Sciences Edition), 2021, 21(5): 64-77.
|
| [2] |
Coase R. H. The Problem of Social Cost [J]. Journal of Law and Economics, 1960, 3: 1-44.
https://doi.org/10.1086/466560
|
| [3] |
Zhou Sheng Lu. Environmental and Economic Impact Analysis of Carbon Emissions Trading in Shanghai City Based on CGE Model [J]. Progress in Climate Change Research, 2015(2): 144-152.
|
| [4] |
Zhang Cheng, Shi Dan, Li Pengfei. Potential effectiveness of interprovincial carbon emissions trading in China [J]. Finance and Trade Economics, 2017(2): 93-108.
|
| [5] |
Li Ronghua, Du Hao. Emission reduction effects and regional differences of carbon emission trading pilot projects under "double carbon" targets [J]. Economics and Management Research, 2023, 44(11): 25-44.
https://doi.org/10.13502/j.cnki.issn1000-7636.2023.11.002
|
| [6] |
Luxi Li, Shi Wu, Yuan Tian. Carbon emissions trading and green technology innovation [J]. Statistics and Information Forum, 2024, 39(06): 89-99.
|
| [7] |
Chen Xiangyang, Dale. "Incremental Regulation" or "Stock Optimization"--Impact of Carbon Trading System on Overcapacity of Urban Secondary Industry in China [J]. Journal of China University of Geosciences (Social Sciences Edition), 2023, 23(05): 16-30.
https://doi.org/10.16493/j.cnki.42-1627/c.20230823.002
|
| [8] |
Sun Jingbing, Gu Zhenyang. Will Carbon Emission Trading Mechanism Force Industrial Structure Transformation and Upgrading? Based on the perspective of manufacturing industry and producer service industry collaborative agglomeration [J]. Ecological Economics, 2023, 39(05): 59-68.
|
| [9] |
Hoffmann V. EU ETS and Investment Decisions. European Management Journal, 2007(6): 464-474.
https://doi.org/10.1016/j.emj.2007.07.008
|
| [10] |
Song Deyong, Zhu Wenbo, Wang Banban. Micro Empirical Study of Carbon Trading Pilot Covering Enterprises in China: Carbon Emissions Trading, Quota Allocation Methods and Green Innovation of Enterprises. China Population, Resources and Environment, 2021(1): 37-47.
|
| [11] |
Hu Haoran, Song Yanqun. Market-incentive environmental regulation and enterprise risk-taking: a case study of carbon emission trading pilot policy [J]. Contemporary Economic Science: 1-16.
https://doi.org/10.20069/j.cnki.DJKX.202404006
|
| [12] |
Hu Yufeng, Ding Youqiang. Can carbon emission trading mechanism balance enterprise benefit and green efficiency? China Population, Resources and Environment, 2020(3): 56-64.
|
| [13] |
Wen Y., Hu P., Li J., et al. Does China’s Carbon Emissions Trading Scheme Really Work? A Case Study of the Hubei Pilot [J]. Journal of Cleaner Production, 2020, 277: 124-51.
https://doi.org/10.1016/j.jclepro.2020.124151
|
| [14] |
Hu, Y., S. Ren, Y. Wang, and X. Chen. Can Carbon Emission Trading Scheme Achieve Energy Conservation and Emission Reduction? Evidence from the Industrial Sector in China [J]. Energy Economics.2019.
https://doi.org/10.1016/j.eneco.2019.104590
|
| [15] |
Liu Zhihua, Xu Jianwei. Impact of carbon market pilot on provincial carbon emission equity and its mechanism: an empirical study based on multi-period DID, spatial DID and mediation effect [J]. Journal of Natural Resources, 2024, 39(03): 697-711.
|
| [16] |
Luo Liangwen, Lei Zhujiahua. Synergies of Pollution and Carbon Reduction in China Carbon Market Policy [J]. Resource Science, 2024, 46(01): 53-68.
|
| [17] |
Wang Weidong, Wang Dong, Luna. Research on Carbon Emissions Trading Promoting Low Carbon Technology Innovation Mechanism in China [J]. China Population, Resources and Environment, 2020, 30(2): 41-48.
|
| [18] |
He Yanni. The Impact and Mechanism of Carbon Trading Market on Enterprise Innovation Strategy [J]. China Population, Resources and Environment, 2022, 32(07): 37-48.
|
| [19] |
Dong Zhiqing, Wang Hui. Validity test of market-based environmental regulation policy: empirical evidence from the perspective of carbon emission trading policy [J]. Statistical Research, 2021, 38(10): 4 8-61.
https://doi.org/10.19343/j.cnki.11-1302/c.2021.10.005
|
| [20] |
Cao Xiang, Su Xiner. Does carbon trading pilot policy promote carbon neutral technological innovation? [J]. China Population, Resources and Environment, 2023, 33(07): 94-104.
|
| [21] |
Xu Jia, Cui Jingbo. Low-carbon cities and green technology innovation in enterprises [J]. China Industrial Economics, 2020(12): 178-196.
https://doi.org/10.19581/j.cnki.ciejournal.2020.12.008
|
| [22] |
Chen J D, Gao M, Cheng S L, et al. County-level CO2 emissions and sequestration in China during 1997—2017 [J]. Scientific Data, 2020, 7: 391.
https://doi.org/10.1038/s41597-020-00736-3
|
| [23] |
Zhang Guojian, Tong Menghua, Li Hui. Economic Growth Effects and Policy Effectiveness Evaluation of Poverty Alleviation Reform Pilot Areas [J]. China Industrial Economics, 2019(08): 136-154.
https://doi.org/10.19581/j.cnki.ciejournal.2019.08.008
|
| [24] |
Wu Yinyin, Qi Jie, Xian Qin. Study on Carbon Emission Reduction Effect of Carbon Market in China--Based on Synergy of Market Mechanism and Administrative Intervention [J]. China Industrial Economics, 2021(8): 114-132.
https://doi.org/10.19581/j.cnki.ciejournal.2021.08.007
|
| [25] |
Cui, J., J. Zhang, and Y. Zheng. Carbon Pricing Induces Innovation: Evidence from China’s Regional Carbon Market Pilots [J]. AEA Papers and Proceedings, 2018, (108): 453-457.
https://doi.org/10.1257/pandp.20181027
|
| [26] |
Zhang, Y., W. Shi, and L. Jiang. Does China’s Carbon Emissions Trading Policy Improve the Technology Innovation of Relevant Enterprises [J]. Business Strategy and the Environment, 2020b, 29(3): 872-885.
https://doi.org/10.1002/bse.2404
|
| [27] |
La Ferrara, E., A. Chong, and S. Duryea. Soap Operas and Fertility: Evidence from Brazil [J]. American Economic Journal: Applied Economics, 2012, 4(4): 1-31.
|
| [28] |
Lin Pengsheng, Li Shuo. Administrative instruments and market mechanisms: Comparison of carbon emission reduction effects of climate policies in China [J/OL]. World Economy, 2024(06): 149-175.
https://doi.org/10.19985/j.cnki.cassjwe.2024.06.006
|
| [29] |
Cao J., Ho M. S., Ma R., et al. When Carbon Emission Trading Meets a Regulated Industry:Evidence from the Electricity Sector of China [J]. Journal of Public Economics, 2021, 200: 104470.
https://doi.org/10.1016/j.jpubeco.2021.104470
|
| [30] |
Shao Shuai, Xu Le, Zhang Shaoyi. Can carbon emissions trading help achieve the "double carbon" goal? Evidence of heterogeneity from energy supply side and consumption side [J]. Journal of Lanzhou University (Social Sciences Edition), 2022, 50(04): 27-40.
https://doi.org/10.13885/j.issn.1000-2804.2022.04.004
|
| [31] |
Xiong Ling, Qi Shaozhou, Shen Bo. Characteristics, design problems and improvement countermeasures of quota allocation mechanism for carbon trading pilot projects in China [J]. Journal of Wuhan University (Philosophy and Social Sciences Edition), 2016, 69(3): 56-64.
https://doi.org/10.14086/j.cnki.wujss.2016.03.007
|
| [32] |
Wei Lili, Ren Liyuan. Can carbon emissions trading promote green technology innovation in enterprises: a perspective based on carbon price [J]. Lanzhou Journal, 2021(7): 91-110.
|
Cite This Article
-
APA Style
Li, H., Lei, Y., Li, N., Wang, N., Liu, K. (2026). Research on the Impact of Carbon Emission Trading Policy on Carbon Emissions: An Empirical Examination Based on 284 Prefecture-level Cities in China. International Journal of Environmental Protection and Policy, 14(1), 1-17. https://doi.org/10.11648/j.ijepp.20261401.11
 Copy
|
Copy
|
 Download
ACS Style
Li, H.; Lei, Y.; Li, N.; Wang, N.; Liu, K. Research on the Impact of Carbon Emission Trading Policy on Carbon Emissions: An Empirical Examination Based on 284 Prefecture-level Cities in China. Int. J. Environ. Prot. Policy 2026, 14(1), 1-17. doi: 10.11648/j.ijepp.20261401.11
Copy
|
Download
AMA Style
Li H, Lei Y, Li N, Wang N, Liu K. Research on the Impact of Carbon Emission Trading Policy on Carbon Emissions: An Empirical Examination Based on 284 Prefecture-level Cities in China. Int J Environ Prot Policy. 2026;14(1):1-17. doi: 10.11648/j.ijepp.20261401.11
Copy
|
Download
-
@article{10.11648/j.ijepp.20261401.11,
  author = {Hao Li and Yuxiao Lei and Nuo Li and Nuo Wang and Kexin Liu},
  title = {Research on the Impact of Carbon Emission Trading Policy on Carbon Emissions: An Empirical Examination Based on 284 Prefecture-level Cities in China},
  journal = {International Journal of Environmental Protection and Policy},
  volume = {14},
  number = {1},
  pages = {1-17},
  doi = {10.11648/j.ijepp.20261401.11},
  url = {https://doi.org/10.11648/j.ijepp.20261401.11},
  eprint = {https://article.sciencepublishinggroup.com/pdf/10.11648.j.ijepp.20261401.11},
  abstract = {This study leverages the implementation of China's pilot Emissions Trading Scheme (ETS) policies as a quasi-natural experiment. Utilizing panel data from 284 prefecture-level and above cities in China spanning 2003 to 2017, we employ a multi-period difference-in-differences (DID) approach to empirically investigate the carbon reduction effects, underlying mechanisms, and heterogeneity associated with the ETS pilots. The findings reveal that: (1) The ETS effectively reduces both the total carbon emissions and carbon intensity in the pilot regions through dual channels of aggregate control and efficiency improvement. This conclusion remains robust after a series of rigorous tests. (2) The ETS achieves carbon reduction in pilot cities through the combined action of market mechanisms and administrative interventions. While the role of market mechanisms is relatively limited, administrative interventions contribute significantly. (3) The carbon reduction effects of the ETS exhibit significant heterogeneity. From the perspective of urban resource endowment, non-resource-based cities outperform resource-based cities in carbon reduction effectiveness. Regarding allowance allocation methods, regions employing a hybrid approach combining free allocation with auction and fixed-price sales demonstrate superior carbon reduction outcomes compared to those using solely free allocation or a combination of free allocation and auction. In terms of carbon price, the ETS policy demonstrates greater effectiveness in reducing total carbon emissions in high-carbon-price regions than in low- and medium-carbon-price regions, but its effectiveness in reducing carbon intensity is weaker in high-price regions compared to low- and medium-price regions. This study provides empirical evidence and policy insights for China to tailor the implementation of its ETS to local conditions, thereby advancing the achievement of its "dual carbon" goals (carbon peaking and carbon neutrality) and fostering green transition development.},
 year = {2026}
}
Copy
|
Download
-
TY  - JOUR
T1  - Research on the Impact of Carbon Emission Trading Policy on Carbon Emissions: An Empirical Examination Based on 284 Prefecture-level Cities in China
AU  - Hao Li
AU  - Yuxiao Lei
AU  - Nuo Li
AU  - Nuo Wang
AU  - Kexin Liu
Y1  - 2026/01/20
PY  - 2026
N1  - https://doi.org/10.11648/j.ijepp.20261401.11
DO  - 10.11648/j.ijepp.20261401.11
T2  - International Journal of Environmental Protection and Policy
JF  - International Journal of Environmental Protection and Policy
JO  - International Journal of Environmental Protection and Policy
SP  - 1
EP  - 17
PB  - Science Publishing Group
SN  - 2330-7536
UR  - https://doi.org/10.11648/j.ijepp.20261401.11
AB  - This study leverages the implementation of China's pilot Emissions Trading Scheme (ETS) policies as a quasi-natural experiment. Utilizing panel data from 284 prefecture-level and above cities in China spanning 2003 to 2017, we employ a multi-period difference-in-differences (DID) approach to empirically investigate the carbon reduction effects, underlying mechanisms, and heterogeneity associated with the ETS pilots. The findings reveal that: (1) The ETS effectively reduces both the total carbon emissions and carbon intensity in the pilot regions through dual channels of aggregate control and efficiency improvement. This conclusion remains robust after a series of rigorous tests. (2) The ETS achieves carbon reduction in pilot cities through the combined action of market mechanisms and administrative interventions. While the role of market mechanisms is relatively limited, administrative interventions contribute significantly. (3) The carbon reduction effects of the ETS exhibit significant heterogeneity. From the perspective of urban resource endowment, non-resource-based cities outperform resource-based cities in carbon reduction effectiveness. Regarding allowance allocation methods, regions employing a hybrid approach combining free allocation with auction and fixed-price sales demonstrate superior carbon reduction outcomes compared to those using solely free allocation or a combination of free allocation and auction. In terms of carbon price, the ETS policy demonstrates greater effectiveness in reducing total carbon emissions in high-carbon-price regions than in low- and medium-carbon-price regions, but its effectiveness in reducing carbon intensity is weaker in high-price regions compared to low- and medium-price regions. This study provides empirical evidence and policy insights for China to tailor the implementation of its ETS to local conditions, thereby advancing the achievement of its "dual carbon" goals (carbon peaking and carbon neutrality) and fostering green transition development.
VL  - 14
IS  - 1
ER  -
Copy
|
Download