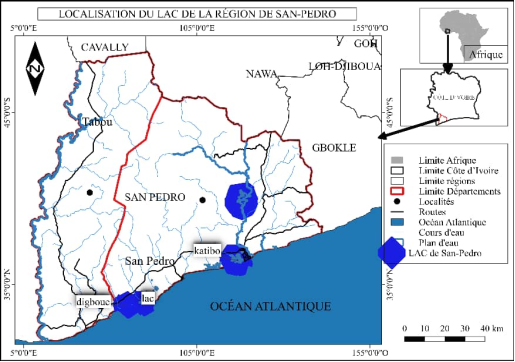
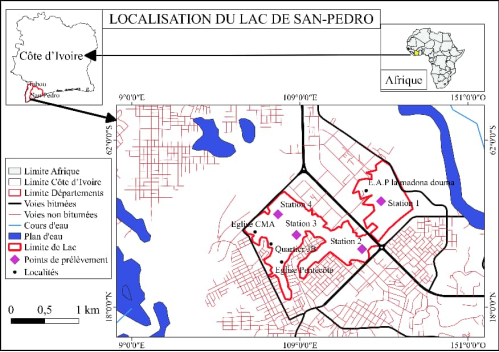
Heavy metal contamination of aquatic ecosystems is a major environmental and public health issue, particularly in rapidly urbanizing regions of developing countries. This study assessed the polymetallic pollution of Lake San-Pedro (Côte d’Ivoire) during the rainy season, focusing on the spatial distribution and severity of contamination. A total of 12 surface water samples—three point samples per station—were collected from four stations selected based on their exposure to industrial, domestic, and urban discharges. Samples were analyzed using inductively coupled plasma mass spectrometry (ICP-MS) to determine the concentrations of nine heavy metals. Key physicochemical parameters were also measured, and the Heavy Metal Pollution Index (HPI) was applied to quantify the overall contamination level. The results revealed elevated concentrations of iron (1.10-1.93 mg/L), aluminum (0.36-1.33 mg/L), and nickel (0.03-0.38 mg/L), all significantly exceeding World Health Organization (WHO) guidelines. HPI values at all stations were well above the critical threshold of 100, indicating severe heavy metal pollution. High turbidity and elevated organic loads were observed across several sites, suggesting substantial degradation of water quality. Statistical analysis (one-way ANOVA) confirmed significant spatial differences (p < 0.05) in the concentrations of Al, Fe, Ni, Pb, and Cr, with stations 1 and 2—located near major anthropogenic activities—showing the highest contamination levels. These findings highlight the urgent need for integrated watershed management measures, including wastewater treatment, pollution source control, and routine monitoring of water quality. This study provides key data to support the protection and sustainable use of Lake San-Pedro’s aquatic resources.
| Published in | International Journal of Environmental Monitoring and Analysis (Volume 13, Issue 5) |
| DOI | 10.11648/j.ijema.20251305.13 |
| Page(s) | 263-275 |
| Creative Commons |
This is an Open Access article, distributed under the terms of the Creative Commons Attribution 4.0 International License (http://creativecommons.org/licenses/by/4.0/), which permits unrestricted use, distribution and reproduction in any medium or format, provided the original work is properly cited. |
| Copyright |
Copyright © The Author(s), 2025. Published by Science Publishing Group |
Heavy Metals, Water Pollution, ICP-MS, HPI Index, Lake San-Pedro
Station | Temperature (°C) | pH | EC (µS/cm) | Turbidity (NTU) |
|---|---|---|---|---|
Station 1 | 30,55 | 7,11 | 1192,00 | 44,03 |
Station 2 | 30,87 | 8,05 | 1257,00 | 95,60 |
Station 3 | 30,87 | 7,18 | 915,00 | 118,67 |
Station 4 | 31,33 | 7,04 | 995,00 | 19,64 |
Minimum | 30,55 | 7,04 | 915,00 | 19,64 |
Maximum | 31,33 | 8,05 | 1257,00 | 118,67 |
Mean | 30,91 | 7,35 | 1089,75 | 69,49 |
Standard Deviation | 0,32 | 0,47 | 161,19 | 45,58 |
WHO Limits | 20-25 | 6,5-8,5 | ˂ 500 | ˂ 5 |
Stations | Cl- | TH | TAC | DO |
|
|
| COD | BOD5 |
|
|---|---|---|---|---|---|---|---|---|---|---|
Station 1 | 261,33 | 17,09 | 19,42 | 6,83 | 5,33 | 19,46 | 0,07 | 125,33 | 13,33 | 1,62 |
Station 2 | 287,41 | 17,43 | 23,11 | 7,03 | 7,20 | 22,85 | 0,10 | 144,00 | 21,67 | 1,24 |
Station 3 | 198,61 | 16,21 | 13,71 | 7,01 | 8,97 | 29,24 | 0,08 | 116,67 | 28,33 | 1,27 |
Station 4 | 149,04 | 24,26 | 23,07 | 7,48 | 0,98 | 20,17 | 0,02 | 22,67 | 2,50 | 1,14 |
Minimum | 149,04 | 16,21 | 13,71 | 6,83 | 0,98 | 19,46 | 0,02 | 22,67 | 2,50 | 1,14 |
Maximum | 287,41 | 24,26 | 23,11 | 7,48 | 8,97 | 29,24 | 0,10 | 144,00 | 28,33 | 1,62 |
Mean | 224,10 | 18,75 | 19,83 | 7,09 | 5,62 | 22,93 | 0,07 | 102,17 | 16,46 | 1,32 |
Standard deviation | 62,39 | 3,71 | 4,43 | 0,28 | 3,43 | 4,45 | 0,03 | 54,21 | 11,15 | 0,21 |
Normes | ˂ 250 | - | 1,6-16,4 | ˃ 7 | ˂500 | ˂ 50 | ˂0,2 | - | - | ˂0,05 |
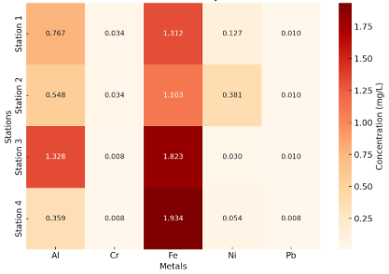
Stations | Al | Cr | Fe | Ni | Cu | Zn | Cd | Pb | Hg |
|---|---|---|---|---|---|---|---|---|---|
Station 1 | 0,767 | 0,034 | 1,312 | 0,127 | 0,026 | 0,111 | 0,001 | 0,010 | 0,000 |
Station 2 | 0,548 | 0,034 | 1,103 | 0,381 | 0,022 | 0,122 | 0,001 | 0,010 | 0,000 |
Station 3 | 1,328 | 0,008 | 1,823 | 0,030 | 0,020 | 0,107 | 0,001 | 0,010 | 0,000 |
Station 4 | 0,359 | 0,008 | 1,934 | 0,054 | 0,019 | 0,129 | 0,001 | 0,008 | 0,000 |
Minimum | 0,359 | 0,008 | 1,103 | 0,030 | 0,019 | 0,107 | 0,001 | 0,008 | 0,000 |
Maximum | 1,328 | 0,034 | 1,934 | 0,381 | 0,026 | 0,129 | 0,001 | 0,010 | 0,000 |
Mean | 0,751 | 0,021 | 1,543 | 0,148 | 0,022 | 0,117 | 0,001 | 0,010 | 0,000 |
Standard deviation | 0,419 | 0,015 | 0,399 | 0,161 | 0,003 | 0,010 | 0,000 | 0,001 | 0,000 |
Normes | 0,200 | 0,050 | 0,300 | 0,020 | 2,000 | 3,000 | 0,003 | 0,010 | 0,006 |
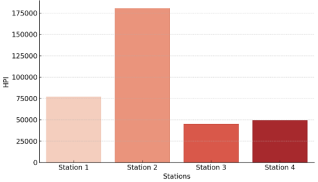
Station | HPI | Pollution risk |
|---|---|---|
Station 1 | 77 138,1 | High pollution |
Station 2 | 180 642,9 | High pollution |
Station 3 | 45 210,9 | High pollution |
Station 4 | 49 483,5 | High pollution |
Mean | 88 118,8 | High heavy metal pollution |
Metal | F-value | p-value | Significant difference (p < 0.05) |
|---|---|---|---|
Aluminium (Al) | 9.24 | 0.0031 | Yes |
Iron (Fe) | 7.88 | 0.0049 | Yes |
Nickel (Ni) | 12.65 | 0.0014 | Yes |
Chromium (Cr) | 6.57 | 0.0093 | Yes |
Copper (Cu) | 2.13 | 0.1398 | No |
Zinc (Zn) | 1.74 | 0.2021 | No |
Lead (Pb) | 5.17 | 0.0215 | Yes |
Cadmium (Cd) | 1.12 | 0.3622 | No (constant values) |
Mercury (Hg) | - | ND | No (not detected) |
ANOVA | A One-way Analysis of Variance |
HPI | Heavy Metal Pollution Index |
ICP-MS | Inductively Coupled Plasma Mass Spectrometry |
WHO | World Health Organization |
| [1] | Ali H., Khan E. and Ilahi I., Environmental chemistry and ecotoxicology of hazardous heavy metals: Environmental persistence, toxicity, and bioaccumulation. Journal of Chemistry, 2019, Article ID 6730305. |
| [2] | World Health Organization (WHO). Chemical hazards in drinking water: Priority list and guidance document. Geneva: WHO Press, 2022. |
| [3] | Giri S. and Singh A. K. Risk assessment, statistical source identification and seasonal fluctuation of dissolved heavy metals in the Subarnarekha River, India. Journal of Hazardous Materials, 265, 305-314, 2014. |
| [4] | Dongo K., Seka A. M., Kouassi A. M. and Coulibaly, L. F. Caractérisation de la pollution physico-chimique des eaux de surface dans le district d’Abidjan (Côte d’Ivoire). International Journal of Biological and Chemical Sciences, 7(1), 279-293, 2013. |
| [5] | Gohourou P. M. Environmental diagnosis of Lake San-Pedro (Côte d'Ivoire): An aquatic ecosystem threatened by urbanization. Revue Ivoirienne des Sciences et Technologies, 37, 14-26, 2021. |
| [6] | Potin-Gautier M. and Paucaut F. Analytical techniques for the environment: From sampling to decision-making. Lavoisier, 2010. |
| [7] | Wang J., Wu Y., Chen Y., Gao Y., Li S. and Zhang D. Advances in ICP-MS for environmental analysis: A review on recent developments and applications. TrAC Trends in Analytical Chemistry, 136, 116178, 2021. |
| [8] | Singh A., Prasad S. M. and Singh V. P. Assessment of heavy metal contamination in aquatic environments. Applied Water Science, 7, 2157-2166, 2017. |
| [9] | Rodier J., Legube B., Merlet N. and Coll. Water analysis: Natural waters, wastewater, seawater (9th ed.). Dunod, 2009. |
| [10] | Lemoalle, J. (2006). The role of physico-chemical factors in the functioning of tropical aquatic ecosystems. IRD Editions. |
| [11] | Dongo K., Kouadio E. K., Goula B. T. A., Soro G. E. and Seka A. M. Pollution de l’eau de la lagune Ébrié par les rejets anthropiques à Abidjan, Côte d’Ivoire. International Journal of Biological and Chemical Sciences, 7(6), 2561-2575, 2013. |
| [12] | World Health Organization (WHO). Guidelines for drinking-water quality: Fourth edition incorporating the first and second addenda. Geneva: WHO Press, 2018. |
| [13] | Yadav S. K., Srivastava R. K., Mishra R. K. and Prasad S. M. Water quality assessment using pH and its implications on aquatic life and ecosystem. Environmental Monitoring and Assessment, 192(5), Article 1-11, 2020. |
| [14] | Avila C., Martínez-Alcántara B., Rodríguez-Castillo R., López-Pérez J. and Marti E. Agricultural runoff and its impact on the physico-chemical quality of surface waters: A review. Environmental Pollution, 319, 121023, 2023. |
| [15] | Farjalla V. F., Marinho C. C., Faria B. M., Esteves F. A., Bozelli R. L., Roland F. and Enrich-Prast A. Influence of dissolved organic carbon on bacterial metabolism in tropical aquatic ecosystems. Frontiers in Microbiology, 5, 643, 2014. |
| [16] | Merghem H., Touhami I. and Bensalah H. Organic pollution and water quality indicators in anthropized environments. Revue des Sciences de l’Eau, 29(4), 349-360, 2016. |
| [17] | Randrianantoandro A., Rakotoarisoa N. H. and Ramilijaona O. R. Impact of salinity on agricultural productivity in coastal areas. Cahiers Agricultures, 23(2), 91-98, 2014. |
| [18] | State Secretariat for Industry and Construction (SIIC). Environmental Code of Côte d’Ivoire: Standards for industrial liquid discharges. Government of Côte d’Ivoire, 2008. |
| [19] | Gao W., Liu Y., Zhang Y. and Chen Z. Thermal pollution in freshwater ecosystems: Drivers, effects, and mitigation. Water Research, 221, 118771, 2022. |
| [20] | Di Cesare A., Corno G., Ghiglione J. F. and Fontaneto D. Microbial blooms and cyanotoxin production in eutrophic lakes: Emerging risks for public health. Environmental Research, 178, 108692, 2019. |
| [21] | Festy B., Andrieu H., De Marsily G. and Chastel, O. Eutrophication of aquatic environments: Issues and perspectives. Techniques de l’Ingénieur, J3720, 2003. |
| [22] | El-Mahmoudi A. S., Aboushi M. S. and Bencheikh M. Pollution chimique des eaux de surface par les rejets industriels dans les pays en développement. Water Science and Technology, 71(3), 331–340, 2015. |
| [23] | Varol M. Environmental and health risk assessment of trace metal contamination in water and sediment of a large reservoir in Turkey. Chemosphere, 258, 127340, 2020. |
| [24] | Nogha P. A. Evaluation of organic water pollution in urban industrial zones. PhD Thesis, University of Yaoundé I, 2005. |
| [25] | Prasad B., & Mondal K. K., The impact of urban wastewater on water quality and fish diversity of the Yamuna River in the city of Agra, India. Environmental Monitoring and Assessment, 141(1-3), 287-291, 2008. |
| [26] | Edet, A. E., & Offiong, O. E., Evaluation of heavy metal contamination and pollution index for groundwater in a developing region. Journal of Environmental Science and Health, Part A, 55(2), 130-140, 2020. |
| [27] | Keumean N., Biemi J., Srohourou B., Kouadio K. E., & Djakouré S., Impacts of gold mining on water quality in the Ivorian mining context. International Journal of Environmental Monitoring and Analysis, 1(4), 126-135, 2013. |
| [28] | Singh A. K., Mallick J., Tiwari A. K., Rai S., & Singh R., Drinking water quality assessment using HPI and correlation methods: A case study of the Ganges river basin, India. Environmental Monitoring and Assessment, 190(9), 543, 2018. |
| [29] | Hayzoun H. Origin and impact of suspended solids in surface waters: Case of the Sebou Basin (Morocco). Afrique Science, 10(2), 20-34, 2014. |
| [30] | Ghazali A. and Zaid M. Impact of turbidity on the microbiological quality of surface waters. Revue des Sciences de l’Eau, 26(4), 367-378, 2013. |
| [31] | Bhardwaj R., Gupta A., & Garg J. K., Evaluation of heavy metal contamination using Environmetrics and indexing approach for River Yamuna, Delhi stretch, India. Water Science, 31(1), 52-66, 2017. |
| [32] | Zhang C., Liu X., Wang Z., & Guo L., Assessment of heavy metal pollution in the surface water of reservoirs in a densely populated region of China. Environmental Science and Pollution Research, 27(12), 13432-13445, 2020. |
| [33] | Liao X., Yang Y., Wang C., & Yang L., Bioaccumulation and trophic transfer of heavy metals in a freshwater ecosystem: A case study from the Taihu Lake Basin, China. Ecotoxicology and Environmental Safety, 168, 222-229, 2019. |
| [34] | Ali H., Khan E., & Ilahi I., Environmental chemistry and ecotoxicology of hazardous heavy metals: Environmental persistence, toxicity, and bioaccumulation. Journal of Chemistry, 2019, 6730305, 2019. |
| [35] | Mehmood M. A., Ahmad S., Rehman F., Ahmed S., Zafar M., Iqbal M., & Rashid N., A critical review on sustainable techniques for heavy metals removal from industrial wastewater using bioremediation. Environmental Science and Pollution Research, 28(6), 5644-5660, 2021. |
| [36] | Li H., Zhang J., Yu Y., Yang B., Li S., Wang Q., & Zhang Z., Spatial distribution and source apportionment of heavy metals in surface water and sediments of a typical industrial river. Environmental Science and Pollution Research, 27(6), 6312-6325, 2020. |
| [37] | Kumar V., Parihar R. D., Sharma A., Bakshi P., Sidhu G. P. S., Bali A. S., Karaouzas I., Bhardwaj R., Thukral A. K., Gyasi-Agyei Y., & Rodrigo-Comino J., Heavy metal pollution in surface waters: Assessment and monitoring strategies. Environmental Research, 177, 108538, 2019. |
| [38] | Zhang Q., Ma X., Li Z., Liu Y., Xu T., & Han Y., Spatial heterogeneity of heavy metals in river sediments and associated ecological risks in an industrialized basin. Science of the Total Environment, 766, 142576, 2021. |
| [39] | Giri S., Singh A. K., Tiwari A. K., & Mahato M. K., Diffuse sources of heavy metals in a tropical river basin: An assessment through spatial analysis. Environmental Monitoring and Assessment, 190(9), 557, 2018. |
| [40] | Singh J., Singh R., Kumar P., & Sarswat A., Occurrence and spatial variability of cadmium in aquatic ecosystems impacted by agriculture: A review. Chemosphere, 263, 128029, 2021. |
| [41] | Chen C., & Wang X., Mercury contamination in freshwater ecosystems: Distribution, sources, and risks. Environmental Pollution, 246, 400-410, 2019. |
| [42] | Rajput V., Singh A., Arif M., Singh S., Sonkar A., Raza M., Kumar A., & Mishra V., Application of statistical tools for environmental risk assessment of heavy metals in aquatic systems: A review. Environmental Science and Pollution Research, 29(8), 11801-11817, 2022. |
| [43] | Suresh G., & Ravichandran M., Role of sediments in the biogeochemical cycling of heavy metals in freshwater lakes. Journal of Environmental Management, 261, 110236, 2020. |
| [44] | Wu F., Zhang R., Gao, Y., Chen H., Feng C., Wu H., Zhao X., & Giesy J. P., Bioaccumulation and toxicological effects of heavy metals in freshwater fish: A meta-analysis. Science of the Total Environment, 754, 142372, 2021. |
APA Style
Camille, N. M., Mawa, K., Abdoulaye, D., Jeanne, O. M., Laurent, Y. (2025). Polymetallic Contamination Assessment of Lake San-Pedro: Characterization by ICP-MS and Heavy Metal Pollution Index (HPI). International Journal of Environmental Monitoring and Analysis, 13(5), 263-275. https://doi.org/10.11648/j.ijema.20251305.13
ACS Style
Camille, N. M.; Mawa, K.; Abdoulaye, D.; Jeanne, O. M.; Laurent, Y. Polymetallic Contamination Assessment of Lake San-Pedro: Characterization by ICP-MS and Heavy Metal Pollution Index (HPI). Int. J. Environ. Monit. Anal. 2025, 13(5), 263-275. doi: 10.11648/j.ijema.20251305.13
@article{10.11648/j.ijema.20251305.13,
  author = {Nongbe Medy Camille and Kone Mawa and Diabagate Abdoulaye and Ohou Marie Jeanne and Yao Laurent},
  title = {Polymetallic Contamination Assessment of Lake San-Pedro: Characterization by ICP-MS and Heavy Metal Pollution Index (HPI)
},
  journal = {International Journal of Environmental Monitoring and Analysis},
  volume = {13},
  number = {5},
  pages = {263-275},
  doi = {10.11648/j.ijema.20251305.13},
  url = {https://doi.org/10.11648/j.ijema.20251305.13},
  eprint = {https://article.sciencepublishinggroup.com/pdf/10.11648.j.ijema.20251305.13},
  abstract = {Heavy metal contamination of aquatic ecosystems is a major environmental and public health issue, particularly in rapidly urbanizing regions of developing countries. This study assessed the polymetallic pollution of Lake San-Pedro (Côte d’Ivoire) during the rainy season, focusing on the spatial distribution and severity of contamination. A total of 12 surface water samples—three point samples per station—were collected from four stations selected based on their exposure to industrial, domestic, and urban discharges. Samples were analyzed using inductively coupled plasma mass spectrometry (ICP-MS) to determine the concentrations of nine heavy metals. Key physicochemical parameters were also measured, and the Heavy Metal Pollution Index (HPI) was applied to quantify the overall contamination level. The results revealed elevated concentrations of iron (1.10-1.93 mg/L), aluminum (0.36-1.33 mg/L), and nickel (0.03-0.38 mg/L), all significantly exceeding World Health Organization (WHO) guidelines. HPI values at all stations were well above the critical threshold of 100, indicating severe heavy metal pollution. High turbidity and elevated organic loads were observed across several sites, suggesting substantial degradation of water quality. Statistical analysis (one-way ANOVA) confirmed significant spatial differences (p < 0.05) in the concentrations of Al, Fe, Ni, Pb, and Cr, with stations 1 and 2—located near major anthropogenic activities—showing the highest contamination levels. These findings highlight the urgent need for integrated watershed management measures, including wastewater treatment, pollution source control, and routine monitoring of water quality. This study provides key data to support the protection and sustainable use of Lake San-Pedro’s aquatic resources.
},
 year = {2025}
}
TY  - JOUR
T1  - Polymetallic Contamination Assessment of Lake San-Pedro: Characterization by ICP-MS and Heavy Metal Pollution Index (HPI)

AU  - Nongbe Medy Camille
AU  - Kone Mawa
AU  - Diabagate Abdoulaye
AU  - Ohou Marie Jeanne
AU  - Yao Laurent
Y1  - 2025/09/25
PY  - 2025
N1  - https://doi.org/10.11648/j.ijema.20251305.13
DO  - 10.11648/j.ijema.20251305.13
T2  - International Journal of Environmental Monitoring and Analysis
JF  - International Journal of Environmental Monitoring and Analysis
JO  - International Journal of Environmental Monitoring and Analysis
SP  - 263
EP  - 275
PB  - Science Publishing Group
SN  - 2328-7667
UR  - https://doi.org/10.11648/j.ijema.20251305.13
AB  - Heavy metal contamination of aquatic ecosystems is a major environmental and public health issue, particularly in rapidly urbanizing regions of developing countries. This study assessed the polymetallic pollution of Lake San-Pedro (Côte d’Ivoire) during the rainy season, focusing on the spatial distribution and severity of contamination. A total of 12 surface water samples—three point samples per station—were collected from four stations selected based on their exposure to industrial, domestic, and urban discharges. Samples were analyzed using inductively coupled plasma mass spectrometry (ICP-MS) to determine the concentrations of nine heavy metals. Key physicochemical parameters were also measured, and the Heavy Metal Pollution Index (HPI) was applied to quantify the overall contamination level. The results revealed elevated concentrations of iron (1.10-1.93 mg/L), aluminum (0.36-1.33 mg/L), and nickel (0.03-0.38 mg/L), all significantly exceeding World Health Organization (WHO) guidelines. HPI values at all stations were well above the critical threshold of 100, indicating severe heavy metal pollution. High turbidity and elevated organic loads were observed across several sites, suggesting substantial degradation of water quality. Statistical analysis (one-way ANOVA) confirmed significant spatial differences (p < 0.05) in the concentrations of Al, Fe, Ni, Pb, and Cr, with stations 1 and 2—located near major anthropogenic activities—showing the highest contamination levels. These findings highlight the urgent need for integrated watershed management measures, including wastewater treatment, pollution source control, and routine monitoring of water quality. This study provides key data to support the protection and sustainable use of Lake San-Pedro’s aquatic resources.

VL  - 13
IS  - 5
ER  -
Laboratory of Environmental Sciences and Technologies, Jean Lorougnon Guédé University, Daloa, Côte d’Ivoire; National Laboratory for Quality Testing, Metrology and Analyses, Abidjan, Côte d’Ivoire
National Laboratory for Quality Testing, Metrology and Analyses, Abidjan, Côte d’Ivoire; Laboratory of Constitution and Reaction of Matter, Félix Houphouët-Boigny University, Abidjan, Côte d’Ivoire
Laboratory of Environmental Sciences and Technologies, Jean Lorougnon Guédé University, Daloa, Côte d’Ivoire
Laboratory of Environmental Sciences and Technologies, Jean Lorougnon Guédé University, Daloa, Côte d’Ivoire
National Laboratory for Quality Testing, Metrology and Analyses, Abidjan, Côte d’Ivoire
Information