The undesirable change in any gaseous substance present in ambient air in such concentration that may tends to be injurious to human beings and other living creature, plant, property. These substances which are responsible for such undesirable changes called air pollutants. A developmental activity like urbanization leads to potent impact on our surrounding environment, many cities around the world become more congested, concerns increase over the level of urban air pollution being generated and in particular its impact on localized human health. An attempt has been made in this study on yearly basis, pertaining to air quality standards of Bikaner city as one prominent city in the state of Rajasthan. Bikaner is the city which lies in desertic region of western Rajasthan is prominently as one of the air pollutant area affected generally by fine dust particles due to composition of soil as gypsum ingredient, despite that agricultural practices are also on large scale other factors like mining in adjoining areas, natural dust storm, three highways passes through and railway network is stretching within city is matter of concern. The study reveals that many times city has become declared as worst polluted city in India especially in context to suspended particulate matters. Some strategic location has been choosen for study which extrapolate the cause condition relationship between air pollution and their both fugitive and nonfugitive sources. The help has been taken from regional office of pollution control board as well as free samplings undertaken by researcher by using high volume sampler. The purpose of study is reveal the data in consonance of previous study that how these pollution datas are keep going in simulation for further mitigative measures and studies.
| Published in | International Journal of Environmental Monitoring and Analysis (Volume 13, Issue 1) |
| DOI | 10.11648/j.ijema.20251301.13 |
| Page(s) | 28-38 |
| Creative Commons |
This is an Open Access article, distributed under the terms of the Creative Commons Attribution 4.0 International License (http://creativecommons.org/licenses/by/4.0/), which permits unrestricted use, distribution and reproduction in any medium or format, provided the original work is properly cited. |
| Copyright |
Copyright © The Author(s), 2025. Published by Science Publishing Group |
Particulate Matter, Anthropogenic Activities, Emission Standards, Gaseous Pollutants, QGIS Map
S.No. | Name of the Location | Address of the locations | Type of locations | Co-ordinates of location |
|---|---|---|---|---|
1 | Regional Office, RSPCB | SPL-33, Bichhwal industrial area, Bikaner | Industrial | 28.06638358N 73.33637305E |
2 | RSMML Office | 02 Gandhi Scheme, Bikaner | Mixed | 28.04009683N 73.33556174E |
3 | AEN PHED PDR | LaxamiNathjiGhati Road, Hammalon Ki Badi, Bikaner | Residential | 28.00320887N 73.30124107E |
Pollutants | Time Weighted Average | Concentration in Ambient Air | Methods of Measurement | |
|---|---|---|---|---|
Industrial, Residential, Rural and other Areas | Ecologically Sensitive Area (Notified by CentralGovernment) | |||
Sulphur Dioxide (SO2), µg/m3 | Annual * | 50 | 20 | -Improved West and Gaeke Method |
24 Hours ** | 80 | 80 | -Ultraviolet Fluorescence | |
Nitrogen Dioxide (NO2), µg/m3 | Annual* 24 | 40 | 30 | -Jacob&Hochheiser Method |
Hours ** | 80 | 80 | -Gas Phase Chemiluminescence | |
Particulate Matter (Size less than 10µm) or PM10, µg/m3 | Annual* 24 | 60 | 60 | -Gravimetric -TEOM -Beta attenuation |
Hours ** | 100 | 100 | ||
*Annual Arithmetic mean of minimum 104 measurements in a year at a particular site taken twice a week 24 hourly at uniform intervals. ** 24 hourly or 8 hourly or 1 hourly monitored values, as applicable, shall be complied with 98% of the time in a year. 2% of the time, they may exceed the limits but not on two consecutive days of monitoring. | ||||
MonthParameter | Jan-23 | Feb-23 | March-23 | April-23 | May-23 | June-23 | July-23 | Aug-23 | Sept-23 | Oct-23 | Nov-23 | Dec-23 |
|---|---|---|---|---|---|---|---|---|---|---|---|---|
PM10 µg/m3 | 153 | 180 | 169 | 160 | 136 | 168 | 149 | 202 | 175 | 186 | 277 | 229 |
SO2µg/m3 | 5.75 | 5.46 | 5.35 | 5.25 | 5.29 | 5.18 | 5.13 | 5.08 | 4.58 | 5.2 | 5.2 | 5.17 |
NO2µg/m3 | 27.79 | 24.75 | 23.98 | 22.34 | 24.23 | 25.54 | 23.07 | 22.43 | 20.39 | 24.89 | 30.43 | 34.03 |
MonthParameter | Jan-23 | Feb-23 | March-23 | April-23 | May-23 | June-23 | July-23 | Aug-23 | Sept-23 | Oct-23 | Nov-23 | Dec-23 |
|---|---|---|---|---|---|---|---|---|---|---|---|---|
PM10 µg/m3 | 145 | 133 | 110 | 161 | 143 | 126 | 115 | 146 | 129 | 115 | 202 | 135 |
SO2µg/m3 | 5.13 | 5.41 | 4.97 | 5.42 | 5.44 | 5.31 | 5.29 | 5.19 | 5.2 | 5.27 | 5.2 | 5.2 |
NO2µg/m3 | 25.03 | 24.58 | 22.57 | 23.71 | 24.56 | 25.18 | 24.35 | 24.7 | 23.22 | 24.86 | 29.95 | 33.06 |
MonthParameter | Jan-23 | Feb-23 | March-23 | April-23 | May-23 | June-23 | July-23 | Aug-23 | Sept-23 | Oct-23 | Nov-23 | Dec-23 |
|---|---|---|---|---|---|---|---|---|---|---|---|---|
PM10 µg/m3 | 142 | 129 | 109 | 166 | 215 | 111 | 116 | 123 | 113 | 105 | 292 | 213 |
SO2µg/m3 | 5.26 | 5.63 | 5.29 | 5.21 | 5.39 | 5.66 | 5.58 | 5.3 | 5.44 | 5.13 | 4.56 | 5.14 |
NO2µg/m3 | 25.98 | 24.01 | 23.39 | 22.82 | 24.48 | 25.33 | 23.94 | 24.05 | 23.64 | 24.89 | 29.64 | 33.48 |
Month Parameter | Jan-23 | Feb-23 | March-23 | April-23 | May-23 | June-23 | July-23 | Aug-23 | Sept-23 | Oct-23 | NOV-23 | Dec-23 |
|---|---|---|---|---|---|---|---|---|---|---|---|---|
PM10 µg/m3 | 146.89 | 147.15 | 130.16 | 166.49 | 167.25 | 133.95 | 127.28 | 157.44 | 145.73 | 133.55 | 258.95 | 191.91 |
SO2µg/m3 | 5.39 | 5.5 | 5.4 | 5.29 | 5.37 | 5.39 | 5.33 | 5.19 | 5.26 | 5.2 | 5.18 | 5.17 |
NO2µg/m3 | 26.28 | 24.44 | 24.21 | 22.95 | 24.43 | 25.34 | 23.76 | 23.73 | 23.27 | 24.88 | 31.21 | 33.53 |
S.No. | Parameter | Yearly (2023) Avg data | Monthly Mini. Avg. | Monthly Max. Avg. |
|---|---|---|---|---|
1. | PM10 µg/m3 | 158.89 | 127.28 | 258.95 |
2. | SO2µg/m3 | 5.30 | 5.17 | 5.5 |
3. | NO2µg/m3 | 25.66 | 22.95 | 33.53 |
SPM | Suspended Particulate Matter |
GPS | Global Positioning Satellite |
QGIS | Quantum Geographical Information System |
NAQI | National Ambient Air Quality Index |
SOX | Sulphur Oxide |
NOX | Nitrogen Oxide |
CO | Carbon Monoxide |
PM | Particulate Matter |
NAMP | National Air Quality Programme |
RSPCB | Rajasthan State Pollution Control Board |
RSMML | Rajasthan State Mines and Mineral Limited |
CPCB | Central Pollution Control Board |
AEN, PHED | Assist Engineer, Public Health Engineering Department |
| [1] | Choking cities. 04 March 2016 Available from |
| [2] |
Air quality. 05 March 2016 Available from Major causes of pollution. 04 March 2016 Available from
http://www.yourarticlelibrary.com/air-pollution/major-causesof-air-pollution-in-india/44769/ |
| [3] | Air pollution. 05 March 2013 Available from |
| [4] | Jain R. Air pollution and health. TERI. Discussion Paper by The Energy and Resources Institute: New Delhi; 2015. p. 1–24. |
| [5] |
Air pollution in India. 05 march 2016 Available from
http://www.mapsofindia.com/my-india/india/what-kind-of-airare-we-breathing-air-pollution-in-india |
| [6] | Air quality trends. National ambient air quality monitoring programme. CPCB. 2006 Sep. |
| [7] | Air Pollution Control in the Transportation Sector. 2007 Third Phase Research Report of the Urban Environmental Management Project. Badhwar, N., R. C. Trivedi and B. Sengupta (2006) Air Quality status and trends in India, Ind J. Air Pollut. Cont. 6, p. 71-79. |
| [8] | Chalka, S. S. Verma and K. C. Sharma. 2006 Distribution of major air pollutions in urban enviornment of Ajmer, Rajasthan. Indian Journal of Environmental Sciences, 10(2), p. 107-111. |
| [9] | Gary A. Shukla P. R., Bhattacharya S., Dadwal V. K. 2001 Sub-region (district) and sector level SO, and NOx emissions for India; assessment of inventories and mitigaton flexibility, Atmospheric Environment, Vol. 35, p. 703-713. |
| [10] | Goyal P., Sidhartha. 2003 Present scenario of air quality in Delhi; a case study of CNG implementation, Atmospheric Environment, Vol. 37, p.5423-5431. |
| [11] | Jayaraman, G. N. 2007Air quality and respiratory health in Delhi. Environ. Monit. Assess |
| [12] | Kumar Rakesh, Joseph Abba Elizabeth 2006 Air Pollution concentrations of PM2.5. PM10 and NO2 at ambient and kerbsite and their Correlation in Metro city-Mumbai, Environmental Monitoring and Assessment, Vol 119, p. 191-199. |
| [13] | KP Singh, S Gupta, SP Shukla, 2012Linear and nonlinear modeling approaches for urban air quality prediction, Science of the Total Enviornment-Elsevier, Vol. 426, p. 244-255. |
| [14] | Tyagi Rajpal, Neetu Tomar, R. S. Tyagi & S. K. Tyagi 2014 Monitoring of particulate matter (SPM, RSPM and dust fall) in ambient air of Ghaziabad and Meerut area of national capital region, india impact, international journal of research in applied natural and social sciences, vol. 2. 13-22. |
APA Style
Dular, A. K., Sharma, Y. (2025). A GIS Based Study for Air Quality Monitoring of Bikaner City, Rajasthan. International Journal of Environmental Monitoring and Analysis, 13(1), 28-38. https://doi.org/10.11648/j.ijema.20251301.13
ACS Style
Dular, A. K.; Sharma, Y. A GIS Based Study for Air Quality Monitoring of Bikaner City, Rajasthan. Int. J. Environ. Monit. Anal. 2025, 13(1), 28-38. doi: 10.11648/j.ijema.20251301.13
@article{10.11648/j.ijema.20251301.13,
  author = {Anil Kumar Dular and Yash Sharma},
  title = {A GIS Based Study for Air Quality Monitoring of Bikaner City, Rajasthan},
  journal = {International Journal of Environmental Monitoring and Analysis},
  volume = {13},
  number = {1},
  pages = {28-38},
  doi = {10.11648/j.ijema.20251301.13},
  url = {https://doi.org/10.11648/j.ijema.20251301.13},
  eprint = {https://article.sciencepublishinggroup.com/pdf/10.11648.j.ijema.20251301.13},
  abstract = {The undesirable change in any gaseous substance present in ambient air in such concentration that may tends to be injurious to human beings and other living creature, plant, property. These substances which are responsible for such undesirable changes called air pollutants. A developmental activity like urbanization leads to potent impact on our surrounding environment, many cities around the world become more congested, concerns increase over the level of urban air pollution being generated and in particular its impact on localized human health. An attempt has been made in this study on yearly basis, pertaining to air quality standards of Bikaner city as one prominent city in the state of Rajasthan. Bikaner is the city which lies in desertic region of western Rajasthan is prominently as one of the air pollutant area affected generally by fine dust particles due to composition of soil as gypsum ingredient, despite that agricultural practices are also on large scale other factors like mining in adjoining areas, natural dust storm, three highways passes through and railway network is stretching within city is matter of concern. The study reveals that many times city has become declared as worst polluted city in India especially in context to suspended particulate matters. Some strategic location has been choosen for study which extrapolate the cause condition relationship between air pollution and their both fugitive and nonfugitive sources. The help has been taken from regional office of pollution control board as well as free samplings undertaken by researcher by using high volume sampler. The purpose of study is reveal the data in consonance of previous study that how these pollution datas are keep going in simulation for further mitigative measures and studies.},
 year = {2025}
}
TY  - JOUR
T1  - A GIS Based Study for Air Quality Monitoring of Bikaner City, Rajasthan
AU  - Anil Kumar Dular
AU  - Yash Sharma
Y1  - 2025/02/17
PY  - 2025
N1  - https://doi.org/10.11648/j.ijema.20251301.13
DO  - 10.11648/j.ijema.20251301.13
T2  - International Journal of Environmental Monitoring and Analysis
JF  - International Journal of Environmental Monitoring and Analysis
JO  - International Journal of Environmental Monitoring and Analysis
SP  - 28
EP  - 38
PB  - Science Publishing Group
SN  - 2328-7667
UR  - https://doi.org/10.11648/j.ijema.20251301.13
AB  - The undesirable change in any gaseous substance present in ambient air in such concentration that may tends to be injurious to human beings and other living creature, plant, property. These substances which are responsible for such undesirable changes called air pollutants. A developmental activity like urbanization leads to potent impact on our surrounding environment, many cities around the world become more congested, concerns increase over the level of urban air pollution being generated and in particular its impact on localized human health. An attempt has been made in this study on yearly basis, pertaining to air quality standards of Bikaner city as one prominent city in the state of Rajasthan. Bikaner is the city which lies in desertic region of western Rajasthan is prominently as one of the air pollutant area affected generally by fine dust particles due to composition of soil as gypsum ingredient, despite that agricultural practices are also on large scale other factors like mining in adjoining areas, natural dust storm, three highways passes through and railway network is stretching within city is matter of concern. The study reveals that many times city has become declared as worst polluted city in India especially in context to suspended particulate matters. Some strategic location has been choosen for study which extrapolate the cause condition relationship between air pollution and their both fugitive and nonfugitive sources. The help has been taken from regional office of pollution control board as well as free samplings undertaken by researcher by using high volume sampler. The purpose of study is reveal the data in consonance of previous study that how these pollution datas are keep going in simulation for further mitigative measures and studies.
VL  - 13
IS  - 1
ER  -
Department of Environmental Science, Maharaja Ganga Singh University, Bikaner, India
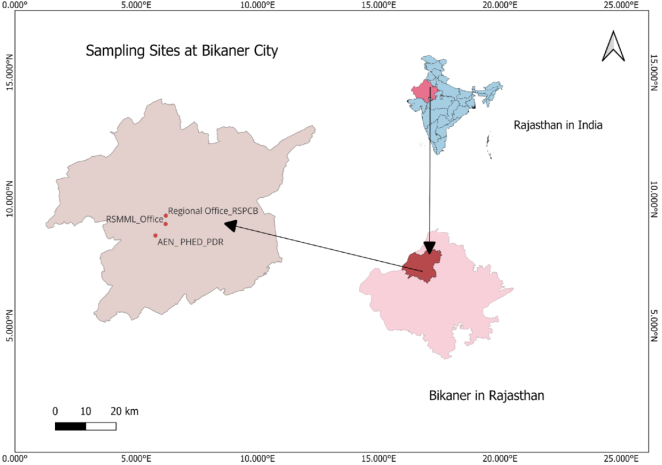
Figure 1.
Monitoring sites under NAMP in Bikaner City.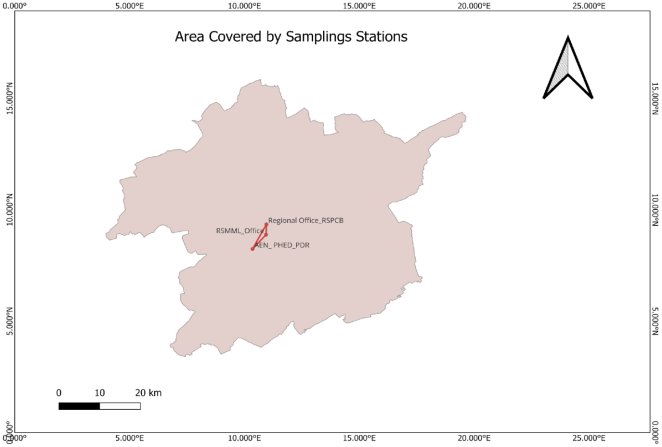
Figure 2.
Map of NAMP Stations.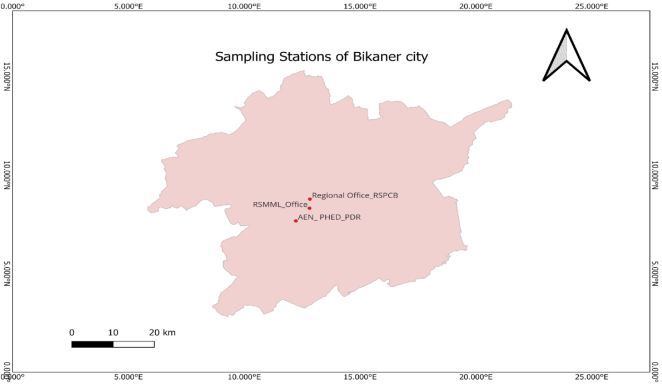
Figure 3.
Map of NAMP Stations.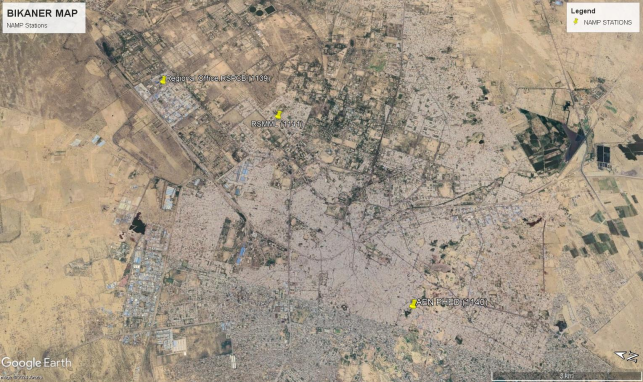
Figure 4. Google Earth Map of NAMP Sites Bikaner City![]()
![]() .
.
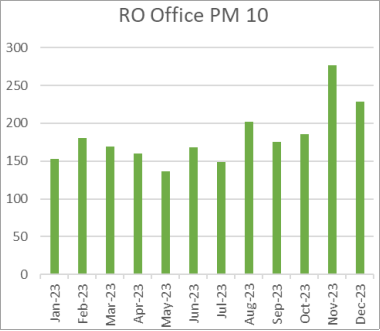
Figure 5. Concentration of PM10 µg/m3 at Regional Office, RSPCB, Bikaner.
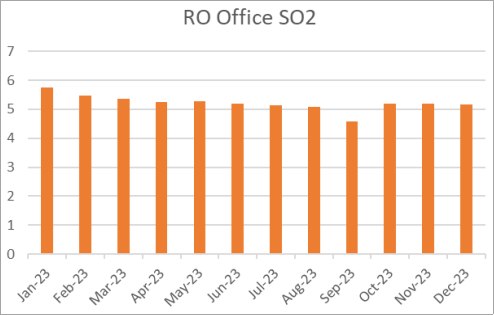
Figure 6. Concentration of SO2 µg/m3 at Regional Office, RSPCB, Bikaner.
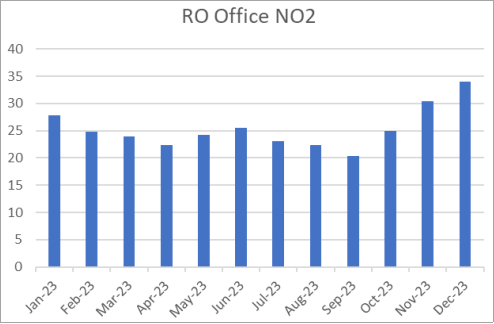
Figure 7. Concentration of NO2 µg/m3 at Regional Office, RSPCB, Bikaner.
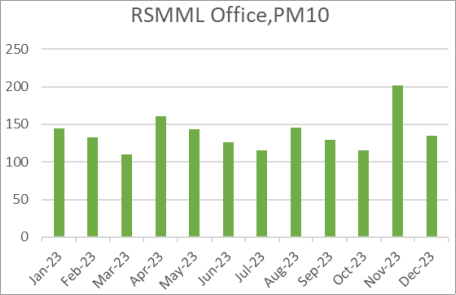
Figure 8. Concentration of PM10 µg/m3 at RSMML Office, 02 Gandhi Scheme, Bikaner.
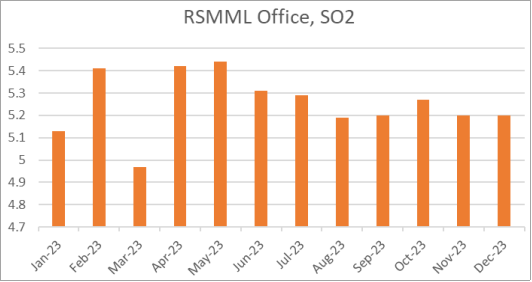
Figure 9. Concentration of SO2 µg/m3 at RSMML Office, 02 Gandhi Scheme, Bikaner.
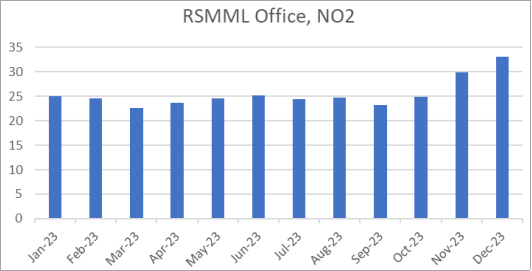
Figure 10. Concentration of NO2 µg/m3 at RSMML Office, 02 Gandhi Scheme, Bikaner.
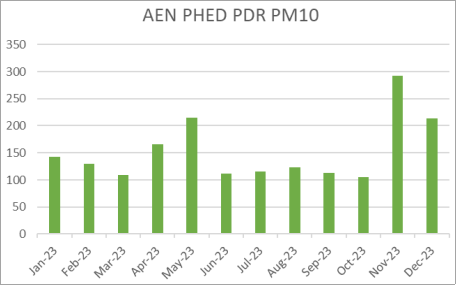
Figure 11. Concentration of PM10 µg/m3 at AEN PHED PDR, Bikaner.
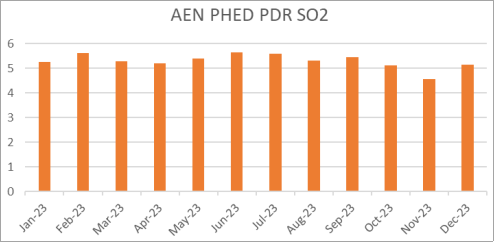
Figure 12. Concentration of SO2 µg/m3 at AEN PHED PDR, Bikaner.
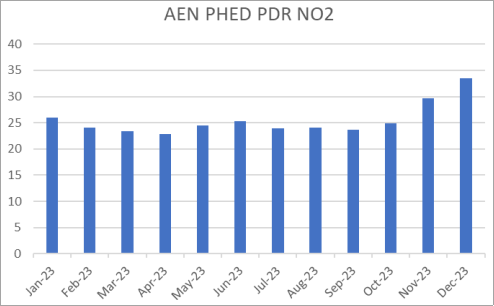
Figure 13. Concentration of NO2 µg/m3 at AEN PHED PDR, Bikaner.
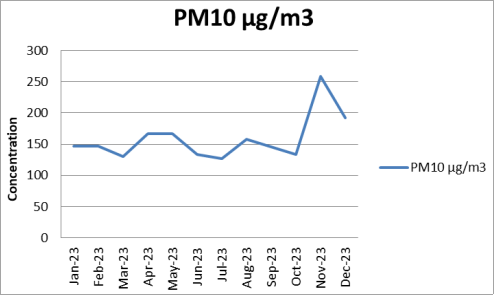
Figure 14. Monthly Average Graph of Particulate Matter (PM10) in Bikaner City 2023.
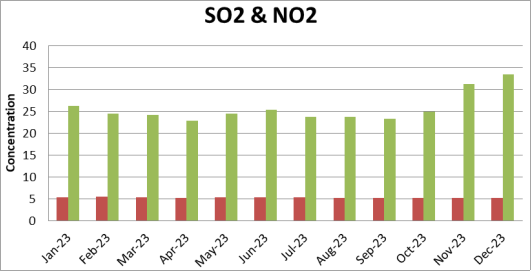
Figure 15. Monthly Average of Sulphur Di-oxide (SO2) and Nitrogen Di-oxide (NO2) Concentration in µg/m3 in Bikaner City in 2023.
Information

