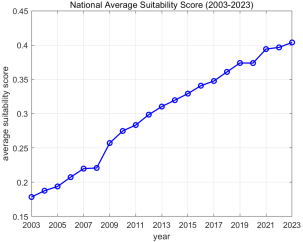
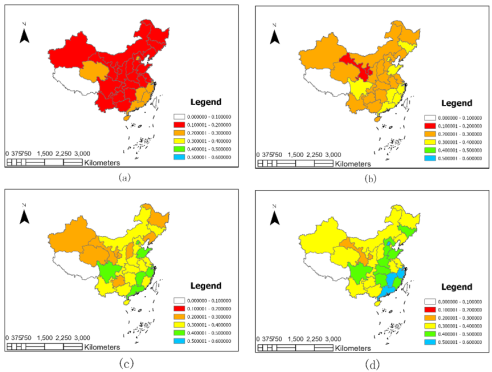
To address the issues of insufficient granularity and ambiguous identification of key driving factors in the evaluation of the Human Settlement-Environment-Energy (HSEE) coupling system, this study takes 30 Chinese provinces as research objects and constructs an interpretable coupling evaluation model based on "information entropy + artificial intelligence" using panel data from 2003 to 2023. Using classic AI algorithms (BP neural network, PCA, and SVM) combined with the entropy weight method, the model was constructed. The entropy weight method and PCA respectively calculated the system suitability scores, and the robustness was validated by the Spearman correlation test (r = 0.9392). Indicator importance was identified via BP neural network, SVM, and the Garson algorithm, and comprehensive weights were determined using the rank average method. The results show that: during the study period, the national average system suitability continuously increased with an average annual growth rate of 3.8%; eastern coastal provinces significantly outperformed western and northeastern regions; per capita water resources, per capita local fiscal revenue, and residential consumption level are the core driving factors; infrastructure indicators exhibit diminishing marginal returns; energy consumption and environmental protection indicators show nonlinear differentiation characteristics. This study integrates objective weighting and machine learning interpretability to provide a standardized methodological framework for evaluating the HSEE coupling system, offering data support for regional human settlement quality improvement and sustainable development policy making.
| Published in | International Journal of Energy and Environmental Science (Volume 11, Issue 3) |
| DOI | 10.11648/j.ijees.20261103.11 |
| Page(s) | 47-54 |
| Creative Commons |
This is an Open Access article, distributed under the terms of the Creative Commons Attribution 4.0 International License (http://creativecommons.org/licenses/by/4.0/), which permits unrestricted use, distribution and reproduction in any medium or format, provided the original work is properly cited. |
| Copyright |
Copyright © The Author(s), 2026. Published by Science Publishing Group |
Human Settlement-Environment-Energy Coupling System, Information Entropy, Garson, Artificial Intelligence Algorithms
Target Layer | System Layer | NO. | Indicator Layer | Indicator Type |
|---|---|---|---|---|
Human Settlement-Environment-Energy Coupling System Suitability | Human Settlement Subsystem | I1 | Climate Comfort (UTCI) (℃) | Positive |
I2 | Number of Medical and Health Institutions (units) | Positive | ||
I3 | Per Capita Disposable Income of Residents (RMB) | Positive | ||
I4 | Number of Beds in Medical and Health Institutions (units) | Positive | ||
I5 | Education Level (%) | Positive | ||
I6 | Per Capita Local Fiscal Revenue (RMB/person) | Positive | ||
I7 | Resident Consumption Level (RMB) | Positive | ||
I8 | Population Density (persons/km²) | Negative | ||
I9 | Per Capita GDP (RMB) | Positive | ||
I10 | Urban Registered Unemployment Rate (%) | Negative | ||
Environment Subsystem | I11 | Per Capita Residential Floor Space (m²) | Positive | |
I12 | Per Capita Park Green Area (m²) | Positive | ||
I13 | Green Coverage Rate of Built-up Areas (%) | Positive | ||
I14 | Harmless Treatment Rate of Domestic Waste (%) | Positive | ||
I15 | Sewage Treatment Rate (%) | Positive | ||
I16 | Number of Urban Road Lighting Lamps (thousand units) | Positive | ||
I17 | Forest Coverage Rate (%) | Positive | ||
I18 | Per Capita Urban Road Area (m²) | Positive | ||
I19 | Population Affected by Natural Disasters (10,000 persons) | Negative | ||
I20 | Number of Wastewater Treatment Facilities (sets) | Positive | ||
Energy Subsystem | I21 | Total Water Consumption (10⁸ m³) | Negative | |
I22 | Per Capita Water Resources (m³/person) | Positive | ||
I23 | Total COD Emissions (tons) | Negative | ||
I24 | CO₂ Emissions (10⁶ tons) | Negative | ||
I25 | Total Energy Consumption (10,000 tons of SCE) | Negative | ||
I26 | Total Ammonia Nitrogen Emissions (10,000 tons) | Negative | ||
I27 | Urban Gas Penetration Rate (%) | Positive | ||
I28 | Electricity Consumption (10⁸ kWh) | Negative | ||
I29 | Urban Water Penetration Rate (%) | Positive | ||
I30 | Hazardous Waste Generation (10,000 tons) | Negative |
Comprehensive Rank | Indicator | Entropy Weight Rank | SVM Rank | BP Neural Network Rank | Average Rank |
|---|---|---|---|---|---|
1 | Per Capita Water Resources | 1 (0.1141) | 2 (0.0900) | 13 (0.03243) | 5.333333333 |
2 | Per Capita Local Fiscal Revenue | 2 (0.0933) | 4 (0.0822) | 12 (0.0364) | 6 |
3 | Resident Consumption Level | 9 (0.0582) | 9 (0.0577) | 1 (0.0603) | 6.333333333 |
4 | Forest Coverage Rate | 11 (0.0406) | 8 (0.0584) | 2 (0.0530) | 7 |
5 | Number of Medical and Health Institutions | 4 (0.0770) | 1 (0.0972) | 17 (0.0307) | 7.333333333 |
6 | Per Capita GDP | 8(0.0595) | 10 (0.0539) | 4 (0.0441) | 7.333333333 |
7 | Number of Wastewater Treatment Facilities | 3(0.0787) | 3 (0.0884) | 25 (0.0255) | 10.33333333 |
8 | Per Capita Disposable Income of Residents | 6(0.0666) | 7 (0.0596) | 20 (0.0286) | 11 |
9 | Per Capita Urban Road Area | 13(0.0309) | 12 (0.0371) | 8 (0.03889) | 11 |
10 | Number of Urban Road Lighting Lamps | 5(0.0748) | 6 (0.0665) | 23 (0.0272) | 11.33333333 |
11 | Per Capita Park Green Area | 14(0.0179) | 16 (0.0171) | 6 (0.0411) | 12 |
12 | Education Level | 10(0.0493) | 11 (0.0426) | 16 (0.0314) | 12.33333333 |
13 | Number of Beds in Medical and Health Institutions | 7(0.0633) | 5 (0.0678) | 28 (0.0218) | 13.33333333 |
14 | Total Water Consumption | 17(0.0140) | 17 (0.0169) | 7 (0.0389) | 13.66666667 |
15 | Sewage Treatment Rate | 19(0.0128) | 19 (0.0162) | 5 (0.0414) | 14.33333333 |
16 | Total Energy Consumption | 20(0.0127) | 20 (0.0143) | 3 (0.0450) | 14.33333333 |
17 | Per Capita Residential Floor Space | 12(0.0315) | 13 (0.0278) | 21 (0.0285) | 15.33333333 |
18 | Total COD Emissions | 18(0.0134) | 18 (0.0165) | 18 (0.0305) | 18 |
19 | Green Coverage Rate of Built-up Areas | 22(0.0102) | 22 (0.0082) | 11 (0.0369) | 18.33333333 |
20 | Population Density | 15(0.0157) | 15 (0.0176) | 27 (0.247) | 19 |
21 | Harmless Treatment Rate of Domestic Waste | 16(0.0144) | 14 (0.0198) | 30 (0.0132) | 20 |
22 | Urban Gas Penetration Rate | 27(0.0050) | 27 (0.0038) | 10 (0.0383) | 21.33333333 |
23 | Electricity Consumption | 23(0.0067) | 23 (0.0063) | 19 (0.0303) | 21.66666667 |
24 | Total Ammonia Nitrogen Emissions | 26(0.0058) | 25 (0.0053) | 14 (0.0324) | 21.66666667 |
25 | Climate Comfort (UTCI) | 21(0.0117) | 21 (0.0118) | 24 (0.0267) | 22 |
26 | CO₂ Emissions | 29(0.0034) | 29 (0.0024) | 9 (0.0384) | 22.33333333 |
27 | Urban Registered Unemployment Rate | 25(0.0060) | 26 (0.0043) | 22 (0.0282) | 24.33333333 |
28 | Urban Water Penetration Rate | 30(0.0027) | 30 (0.0013) | 15 (0.0317) | 25 |
29 | Population Affected by Natural Disasters | 24(0.0062) | 24 (0.0060) | 29 (0.0183) | 25.66666667 |
30 | Hazardous Waste Generation | 28(0.0039) | 28 (0.0031) | 26 (0.0252) | 27.33333333 |
HSEE | Human Settlement-Environment-Energy |
AI | Artificial Intelligence |
SVM | Support Vector Machine |
BP Neural Network | Back Propagation Neural Network |
PCA | Principal Component Analysis |
UTCI | Universal Thermal Climate Index |
COD | Chemical Oxygen Demand |
| [1] | Xiang, W., Yang, X., Yan, X., Wu, F., Li, Y., Zhang, Q., Zhang, J., Liu, Q., et al. A new coupling evaluation method for human settlement-environment-energy systems: Enhancing residents’ happiness. Habitat International. 2025, 164, 103502. |
| [2] | Xiong, S. A unified framework of principal component analysis and factor analysis. Journal of Multivariate Analysis. 2026, 211, 105529. |
| [3] | Jia, H. L., Sun, J. L., Wei, H., et al. Complex fault detection technology based on PCA ant tracking attribute and its application. Petroleum Geology and Engineering. 2026, 40(2), 10-16. (in Chinese). |
| [4] | Li, Z., Luo, Z.J., Wang, Y., Fan, G.Y., Zhang, J.M. Suitability evaluation system for the shallow geothermal energy implementation in region by entropy weight method and TOPSIS method. Renewable Energy. 2022, 184, 564-576. |
| [5] | Xue, Y., Sun, Y., Zhou, J., Peng, L., Zhou, X. Multiattribute decision-making in wargames leveraging the entropy-weight method in conjunction with deep reinforcement learning. IEEE Transactions on Games. 2024, 16(1), 151-161. |
| [6] | Rumelhart, D.E., McClelland, J.L. Explorations in parallel distributed processing: A handbook of models, programs and exercises. 1988. |
| [7] | Cortes, C., Vapnik, V. Support-vector networks. Machine Learning. 1995, 20(3), 273-297. |
| [8] | Pumain, D., et al. Machine Learning for Spatial Environmental Data: Theory, applications and software. Cybergeo. 2010, 371-377. |
| [9] | Ji, H., Zhang, X., Wang, T., Yang, K., Jiang, J., Xing, Z. Oil spill area prediction model of submarine pipeline based on BP neural network and convolutional neural network. Process Safety and Environmental Protection. 2025, 199, 107264. |
| [10] | Li, J. Y., Li, Y. D., Song, J.G., Zhang, J., Zhang, S.C. Quantum Support Vector Machine for Classifying Noisy Data. IEEE Transactions on Computers. 2024, 73, 2233-2247. |
| [11] | Pignalberi, A., Giannattasio, F., Truhlik, V., Coco, I., Pezzopane, M., Alberti, T. Investigating the Main Features of the Correlation Between Electron Density and Temperature in the Topside Ionosphere Through Swarm Satellites Data. Journal of Geophysical Research-Space Physics. 2024, 129, e2023JA032201. |
| [12] | Tu, S., Li, C., Shepherd, B.E. Between- and Within-Cluster Spearman Rank Correlations. Statistics in Medicine. 2025, 44, e10326. |
| [13] | Marquardt, T., Momber, A.W. Interaction effects between profile parameters and free surface energies of blast-cleaned low-carbon steel substrates. Journal of Adhesion. 2025, 101, 1869-1883. |
| [14] | Ly, A., Marsman, M., Wagenmakers, E.J. Analytic posteriors for Pearson's correlation coefficient. Statistica Neerlandica. 2018, 72, 4-13. |
| [15] | Valero-Carreras, D., Alcaraz, J., Landete, M. Comparing two SVM models through different metrics based on the confusion matrix. Computers & Operations Research. 2023, 152, 106131. |
APA Style
Qi, W., Yang, X., Xiang, W. (2026). Suitability Evaluation and Analysis of the Human Settlement-Environment-Energy Coupling System Based on Information Entropy and Artificial Intelligence Algorithms. International Journal of Energy and Environmental Science, 11(3), 47-54. https://doi.org/10.11648/j.ijees.20261103.11
ACS Style
Qi, W.; Yang, X.; Xiang, W. Suitability Evaluation and Analysis of the Human Settlement-Environment-Energy Coupling System Based on Information Entropy and Artificial Intelligence Algorithms. Int. J. Energy Environ. Sci. 2026, 11(3), 47-54. doi: 10.11648/j.ijees.20261103.11
@article{10.11648/j.ijees.20261103.11,
  author = {Wenjie Qi and Xiaohua Yang and Weiqi Xiang},
  title = {Suitability Evaluation and Analysis of the Human Settlement-Environment-Energy Coupling System Based on Information Entropy and Artificial Intelligence Algorithms},
  journal = {International Journal of Energy and Environmental Science},
  volume = {11},
  number = {3},
  pages = {47-54},
  doi = {10.11648/j.ijees.20261103.11},
  url = {https://doi.org/10.11648/j.ijees.20261103.11},
  eprint = {https://article.sciencepublishinggroup.com/pdf/10.11648.j.ijees.20261103.11},
  abstract = {To address the issues of insufficient granularity and ambiguous identification of key driving factors in the evaluation of the Human Settlement-Environment-Energy (HSEE) coupling system, this study takes 30 Chinese provinces as research objects and constructs an interpretable coupling evaluation model based on "information entropy + artificial intelligence" using panel data from 2003 to 2023. Using classic AI algorithms (BP neural network, PCA, and SVM) combined with the entropy weight method, the model was constructed. The entropy weight method and PCA respectively calculated the system suitability scores, and the robustness was validated by the Spearman correlation test (r = 0.9392). Indicator importance was identified via BP neural network, SVM, and the Garson algorithm, and comprehensive weights were determined using the rank average method. The results show that: during the study period, the national average system suitability continuously increased with an average annual growth rate of 3.8%; eastern coastal provinces significantly outperformed western and northeastern regions; per capita water resources, per capita local fiscal revenue, and residential consumption level are the core driving factors; infrastructure indicators exhibit diminishing marginal returns; energy consumption and environmental protection indicators show nonlinear differentiation characteristics. This study integrates objective weighting and machine learning interpretability to provide a standardized methodological framework for evaluating the HSEE coupling system, offering data support for regional human settlement quality improvement and sustainable development policy making.},
 year = {2026}
}
TY  - JOUR
T1  - Suitability Evaluation and Analysis of the Human Settlement-Environment-Energy Coupling System Based on Information Entropy and Artificial Intelligence Algorithms
AU  - Wenjie Qi
AU  - Xiaohua Yang
AU  - Weiqi Xiang
Y1  - 2026/06/09
PY  - 2026
N1  - https://doi.org/10.11648/j.ijees.20261103.11
DO  - 10.11648/j.ijees.20261103.11
T2  - International Journal of Energy and Environmental Science
JF  - International Journal of Energy and Environmental Science
JO  - International Journal of Energy and Environmental Science
SP  - 47
EP  - 54
PB  - Science Publishing Group
SN  - 2578-9546
UR  - https://doi.org/10.11648/j.ijees.20261103.11
AB  - To address the issues of insufficient granularity and ambiguous identification of key driving factors in the evaluation of the Human Settlement-Environment-Energy (HSEE) coupling system, this study takes 30 Chinese provinces as research objects and constructs an interpretable coupling evaluation model based on "information entropy + artificial intelligence" using panel data from 2003 to 2023. Using classic AI algorithms (BP neural network, PCA, and SVM) combined with the entropy weight method, the model was constructed. The entropy weight method and PCA respectively calculated the system suitability scores, and the robustness was validated by the Spearman correlation test (r = 0.9392). Indicator importance was identified via BP neural network, SVM, and the Garson algorithm, and comprehensive weights were determined using the rank average method. The results show that: during the study period, the national average system suitability continuously increased with an average annual growth rate of 3.8%; eastern coastal provinces significantly outperformed western and northeastern regions; per capita water resources, per capita local fiscal revenue, and residential consumption level are the core driving factors; infrastructure indicators exhibit diminishing marginal returns; energy consumption and environmental protection indicators show nonlinear differentiation characteristics. This study integrates objective weighting and machine learning interpretability to provide a standardized methodological framework for evaluating the HSEE coupling system, offering data support for regional human settlement quality improvement and sustainable development policy making.
VL  - 11
IS  - 3
ER  -
State Key Laboratory of Wetland Conservation and Restoration, School of Environment, Beijing Normal University, Beijing, China
State Key Laboratory of Wetland Conservation and Restoration, School of Environment, Beijing Normal University, Beijing, China
State Key Laboratory of Wetland Conservation and Restoration, School of Environment, Beijing Normal University, Beijing, China
Information