Abstract
Understanding the effects of epilepsy on oscillatory dynamics in the human brain is essential to improve the neurophysiological characterization of epileptic disorders. Self-Organizing Map (SOM) is an unsupervised artificial neural network technique that provides a powerful tool to visualize and explore complex high-dimensional EEG data without the need for predefined diagnostic labels. Thirty patients with confirmed epilepsy underwent continuous EEG recording using a computer-based data acquisition system (Nicolet NicVue). Electrode data were recorded from four scalp locations frontal (F3), central (C3), parietal (P3), and occipital (O1). Power spectral density was calculated using Fast Fourier Transform to extract the five canonical EEG frequency bands: delta, theta, alpha, beta, and gamma. Four SOM maps were trained and optimized, and correlation patterns between epileptic brain activity and each frequency band were identified through U-matrix visualization and component plane analysis. The visualized results indicated that the theta band showed the strongest positive correlation with epileptic activity, while the delta band exhibited the weakest association. Notably, no significant correlation with epilepsy was found for the alpha, beta and gamma bands at any of the recorded electrode sites. The SOM based analysis offers an interpretable and computationally efficient framework for exploring associations of EEG frequency bands in epilepsy. Consistent increase in theta-band activity across cortical regions supports its role as a candidate neurophysiological marker of epileptic brain states.
Keywords
Self-Organizing Map (Som), Epilepsy, EEG, Brainwaves, Theta Wave
1. Introduction
Artificial neural networks (ANNs) are established as dependable and inexpensive tools for data analysis and prediction purposes. Among the various types of ANNs, the Self-Organizing Map (SOM) is a particularly powerful technique, showing robust capabilities in data visualization, correlation detection, multivariate analysis, novelty detection and classification. SOM is based on the principle of unsupervised learning, which means that it does not require any external supervision or pre-defined target outputs during the training process. Instead, SOM can discover patterns and structures in complex datasets by itself.
| [1] | Obu-Cann, K., et al. Data mining of power transformer database using self-organising maps. in Info-tech and In-fo-net, 2001. Proceedings. ICII 2001 - Beijing. 2001 Inter-national Conferences on. 2001. |
| [2] | Alhoniemi, E., O. Simula, and J. Vesanto Analysis of Complex Systems using the Self Organizing Map. 1997. |
[1, 2]
.
SOM assists researchers to determine the effect epilepsy on the five EEG frequency bands. It has been applied successfully in various biomedical engineering applications such as speech recognition, medical diagnosis, prosthesis control as well as biomedical image processing
| [3] | AlTimemy, A. H. A. and F. M. A. Naima, Comparison of different neural network approaches for the prediction of kidney dysfunction. Proc. World Acad. Sci. Eng. Technol. Proceedings of World Academy of Science, Engineering and Technology, 2011. 76: p. 34-40. |
| [4] | Christodoulou, C. I. and C. S. Pattichis. Medical diag-nostic systems using ensembles of neural SOFM classifiers. in Electronics, Circuits and Systems, 1999. Proceedings of ICECS '99. The 6th IEEE International Conference on. 1999. |
| [5] | Ping-Lin, C. and T. Wei-Guang. Exploiting the Self-Organizing Map for Medical Image Segmentation. in Computer-Based Medical Systems, 2007. CBMS '07. Twen-tieth IEEE International Symposium on. 2007. |
| [6] | Faisal, T., F. Ibrahim, and M. N. Taib. Analysis of sig-nificant factors for dengue infection prognosis using the self organizing map. in Engineering in Medicine and Biology Society, 2008. EMBS 2008. 30th Annual International Conference of the IEEE. 2008. |
[3-6]
.
Epilepsy is a chronic neurological disorder marked by recurrent, unprovoked seizures. It includes a wide range of seizure types and severity and varies greatly among individuals. Epilepsy is not a single disease entity but a heterogeneous group of disorders with a common feature of recurrent epileptic seizures
| [7] | Valeta, T., The Epilepsy Book: A Companion for Pa-tients Optimizing Diagnosis and Treatment. 2017: Springer. 224. |
[7]
.
The electroencephalogram (EEG) have been classified into five basic groups according to specific frequency bands, namely delta (0.5-4 Hz), theta (4-8 Hz), alpha (8-13Hz), beta (13-30Hz) and gamma (30-70Hz)
. The theta frequency band (4–8 Hz) represents one of the most consistently elevated oscillatory components in the electroencephalographic (EEG) profiles of individuals with epilepsy
| [9] | Gelety, T. J., et al., Computerized spectral analysis of the interictal EEG in epilepsy. 1985. 16(2): 94-97. |
| [10] | Douw, L., et al., Epilepsy is related to theta band brain connectivity and network topology in brain tumor patients. BMC Neurosci, 2010. 11: p. 103.
https://doi.org/10.1186/1471-2202-11-103 |
[9, 10].
This study aimed to employ the self-organizing map (SOM) as a new approach to find the correlations between epilepsy disease and the five EEG frequency bands. Also, it will help neurologists and researchers deal more easily with EEG tests, and assist doctors in making the right diagnosis.
2. Self-Organizing Map (SOM) Architecture, Training and Quality
Fundamentally, the SOM is a dimensionality-reducing projection that maps complex and high-dimensional observations onto an ordered lattice of neurons, commonly laid out in two dimensions. This projection causes similar samples to activate the same or nearby output units and thus reveals the natural groupings in the data as a spatial structure on the map
| [11] | Back, B., K. Sere, and H. Vanharanta, Managing Complexity in Large Data Bases Using Self-Organizing Maps. Journal of Accounting, Management and Information Technologies, 1998. 8(4): 191-210. |
[11]
. The technique is characterized by the preservation of neighborhood relations from the original measurement space on the trained grid. The statistical similarity between samples is represented as geometric proximity between map units, while the essential topological and metric organization of source data is preserved
| [12] | Rustum, R., Modelling Activated Sludge Wastewater Treatment Plants Using Artificial Intelligence Techniques (Fuzzy Logic and Neural Networks). 2009, Her-iot-Watt University: Edinburgh. |
[12]
.
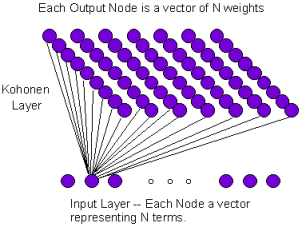
The network is structurally composed of two fully connected layers of neurons; an input layer, of a width equal to the dimensionality of the data, and an output layer commonly called the Kohonen layer (
Figure 1). The given samples to the input layer are all written as
(1)
where x is an input sample vector, o indexes the pattern currently presented, q is the total number of patterns, and m is the dimensionality of each sample. The output layer forms a grid of neurons, usually planar. In contrast to a conventional feed-forward layer, its units are mutually related through their grid positions, and each neuron holds a synaptic weight vector of the same length as the input,
(2)
Where, N is the total number of neurons
.
The network topology is given by two parameters: the number of neurons in the output layer and the geometry of their connections. In practice the output grid is either a rectangular or a hexagonal lattice. A rectangular layout means that an interior unit has four neighbors while a hexagonal layout means six, with fewer neighbors along the grid edges
| [11] | Back, B., K. Sere, and H. Vanharanta, Managing Complexity in Large Data Bases Using Self-Organizing Maps. Journal of Accounting, Management and Information Technologies, 1998. 8(4): 191-210. |
[11]
.
The size of the map, M, depends on the number of output neurons, which can be anywhere from a few tens of units up to several thousands, and it directly influences the resolution and the generalization behavior of the trained map
| [15] | Faisal, T., M. Taib, and F. Ibrahim, Reexamination of risk criteria in dengue patients using the self-organizing map. Medical & Biological Engineering & Computing, 2010. 48(3): 293-301. https://doi.org/10.1007/s11517-009-0561-x |
[15]
. A grid that is too large spreads the data too thinly over many units, while a grid that is too small obscures the underlying structure. Since there is no closed-form rule that prescribes the ideal dimension, the map size is usually determined empirically
.
Like any neural network, the prototype vectors are initialized and then the learning is performed iteratively. Each iteration is composed of three interconnected phases: competition, cooperation and synaptic adaptation
| [16] | Haykin, S. S., Neural networks: a comprehensive foundation. 1999, Upper Saddle River, N. J.: Prentice Hall. |
[16]
.
Competition (vector quantization), a random sample of the data set is broadcast to all output neurons and the units compete to respond. The neuron with the weight vector that is closest to the input, in terms of Euclidean distance, is selected as the winner, or best matching unit (BMU):
(3)
Cooperation. The winning unit then specifies a neighborhood on the output grid, centered on itself, in which the surrounding neurons are co-activated to a graded extent, providing the basis for cooperative learning. This neighborhood is most often described by a Gaussian kernel,
where
is the lateral grid distance between the winner k(x) and neuron j, δ is the effective neighbourhood radius, and τ₁ is a time constant that lets the radius contract as training advances
| [14] | Faisal, T., F. Ibrahim, and M. N. J. E. S. w. A. Taib, A noninvasive intelligent approach for predicting the risk in dengue patients. 2010. 37(3): 2175-2181.
https://doi.org/10.1016/j.eswa.2009.07.060 |
| [16] | Haykin, S. S., Neural networks: a comprehensive foundation. 1999, Upper Saddle River, N. J.: Prentice Hall. |
[14, 16]
.
Finally, In the Synaptic adaptation, all the synaptic weights vectors of the neurons are iteratively updated with respect to the patterns presented at the input. Each learning weight update has the effect of moving the weight vectors of the best matching unit neuron and its neighbours towards the input vector x. The equation is applied to the whole grid of neurons within neighborhood region as shown in the following formula:
(6)
Where wj (n) is the current weights, is current learning rate, is the degree of neighborhood with respect to winner,is the difference between current weights and input vector and is the time constant.
After the adaptation stage is completed, a new random sample is shown and the three stages are repeated until all samples are presented to the map. Finally, the discrete time n is incremented by n+1 and all the steps are repeated again until there are no noticeable changes.
The quality of a trained map is usually evaluated by two complementary indices: the quantization error and the topographic error
| [17] | Haykin, S., Neural networks: a comprehensive foundation. 1994: Prentice hall PTR. |
[17]
. The quantization error (QE) is the mean distance between each data vector and its corresponding BMU and is a measure of how close the prototypes are to the data:
Where N is the number of data vectors and is the best matching prototype of the corresponding data vector .
The percentage of all data vectors for which the first and second best-matching units (BMU) are not nearby vectors is known as topographical error (TE). The following formula can be used to compute it:
Where N is the number of samples, the function
is equal to 1 if
data vector’s first and second best matching units of the map are adjacent and 0 otherwise
| [18] | Uriarte, A. and D. Martín, Topology Preservation in SOM International Journal of Mathematical and Computer Sciences 2005. 1(1): 19-22. |
[18]
.
The SOM's accuracy and generation capacity are determined by the quantity of map units. Higher topographic error and lesser quantization error result from a greater map size. The goal is to strike a balance between increasing topographic error and minimizing quantization error while maintaining a smaller map size because larger map sizes result in higher computing costs. This can be accomplished by varying the map size while the network is being trained and choosing the ideal map size where the QE and TE produced the lowest values
| [18] | Uriarte, A. and D. Martín, Topology Preservation in SOM International Journal of Mathematical and Computer Sciences 2005. 1(1): 19-22. |
[18]
.
3. Materials and Methods
In this study we used SOM analysis to demonstrate the effect of epilepsy disease on the five frequency bands of the human brain. This technique was implemented using MATLAB R2010a (MathWorks, 2010) and SOM Toolbox version. 2
| [19] | Vesanto, J., et al., Self-organizing map in Matlab: the SOM toolbox, in In Proceedings of the Matlab DSP Conference. 1999, 35-40: Espoo, Finland, Comsol Oy. |
[19]
.
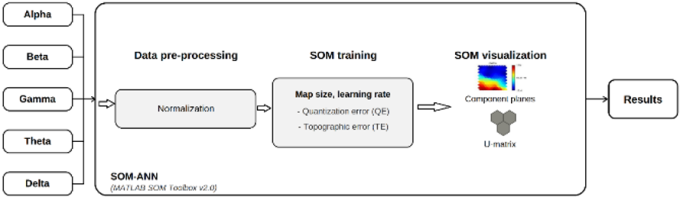
Figure 2 shows the block diagram for performing SOM analysis to determine the significant correlations between epilepsy and EEG frequency bands. The input data (the five frequency bands) were normalized to zero and one because SOM processing involves the measurement of distances from one vector to another
| [19] | Vesanto, J., et al., Self-organizing map in Matlab: the SOM toolbox, in In Proceedings of the Matlab DSP Conference. 1999, 35-40: Espoo, Finland, Comsol Oy. |
[19]
.
Figure 2. Block diagram for the methodology used to perform SOM analysis in this study.
Like any other neural network, the SOM's implemented mechanism for training the map begins by initializing the network's synaptic weights. Three crucial phases—competition, cooperation, and synaptic adaptation—are used in the network's training after the map has been started
| [20] | Gonzalez, M. O. F., Fundamentals of EEG meas-urement. 2002. |
[20]
.
Thirty epilepsy patients' EEG data was first gathered for the investigation. Electrodes were placed on the participants' heads in accordance with the international 10–20 system of electrode placement in order to record EEG data. Electrode positions are labelled according to the adjacent brain areas: F (frontal), C (central), T (temporal), P (parietal), and O (occipital)
| [21] | Qiu, C., et al., Differences and potential mecha-nisms of theta oscillation and temporoparietal and tem-poral-central networks in temporal lobe epilepsy patients with unilateral hippocampal sclerosis. 2024. 6(1): 26.
https://doi.org/10.1186/s42494-024-00170-7 |
[21]
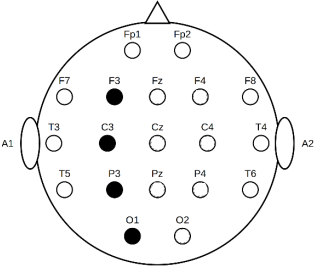
. Data were recorded from four scalp electrode positions: frontal (F3), central (C3), parietal (P3), and occipital (O1), as shown in
Figure 3.
Figure 3. Electrode positions on the scalp.
The five frequency sub-bands (delta, theta, alpha, beta, and gamma) were extracted from the power spectra of the EEG signals using Fast Fourier transformation. The power spectral density of the EEG signals was then calculated using Matlab software. Additionally, the mean power (MP) was determined using:
Where: fh and fI are its starting and ending frequencies, respectively from 1 to 100 Hz with Sx(f) defining fast Fourier transform coefficient at frequency.
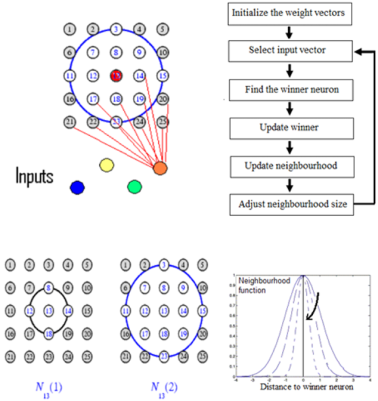
Figure 4 illustrates the training procedures for constructing the SOM. Node 13 was the winning node. The figure shows how the neighborhood of the BMU (node 13) moved toward the BMU with each iteration.
Three initial parameters were chosen for training the SOM based on the aforementioned algorithm: neighborhood, learning rate, and map topology. The initial learning rates in this investigation were set at 0.5 for the ordering phase and 0.05 for the convergence phase. While the neighborhood was decided to be Gaussian, the network architecture was chosen to be hexagonal. Quantization error (QE) and topographic error (TE) were used to gauge the map's resolution. To make choosing the map size easier, TE and QE were taken into account.
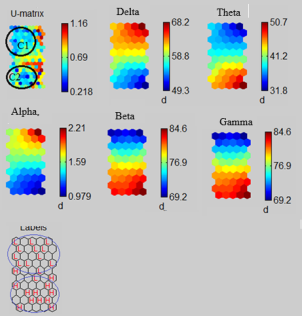
Figure 5. Visualization of the U-matrix, CP, and label map of SOM.
As seen in
Figure 5, the SOM produced useful findings following network training that were simple to see and understand utilizing the unified distance matrix approach (U-matrix), label matrix, and component planes (CPs).
According to the parameters measured in the experiment, the input variables with comparable features in this study shown greater similarities and were represented more closely in the map, whereas the input variables with distinct patterns were situated further apart. The uniform regions with low values represented the clusters themselves (C1, C2), whereas the high values of the U-matrix showed a frontier region between clusters (cluster boundary). Because each CP had the values of a single vector variable over all map units, it might be thought of as a "sliced" version of the SOM. As a result, each map unit's CP displays the values of a single variable
| [19] | Vesanto, J., et al., Self-organizing map in Matlab: the SOM toolbox, in In Proceedings of the Matlab DSP Conference. 1999, 35-40: Espoo, Finland, Comsol Oy. |
[19]
.
The "position" of the data samples in the SOM plane is indicated by the labels in SOM matrices. Every data sample is assigned to a separate BMU. Each data sample's approximate parameter values can be found by finding the matching BMU in the CP.
4. Results
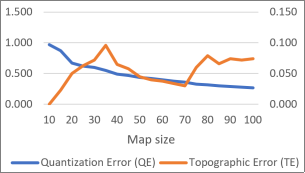
Figure 6. QE and TE with changing map size.
Multiple training iterations were conducted across a range of map sizes to identify the configuration yielding optimal resolution and topological fidelity. Map quality was evaluated using quantization error (QE) and topographic error (TE), with lower values on both metrics indicating superior map performance (
Figure 6). A 7×10 map configuration was selected as optimal, producing QE = 0.439 and TE = 0.032 — the lowest combined error values across all tested configurations.
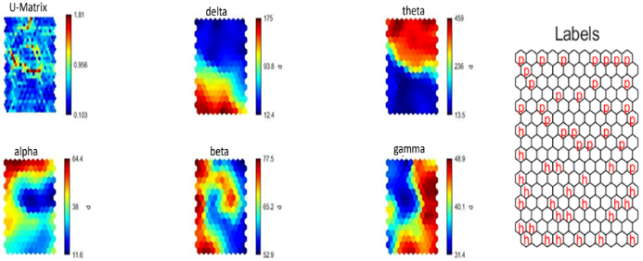
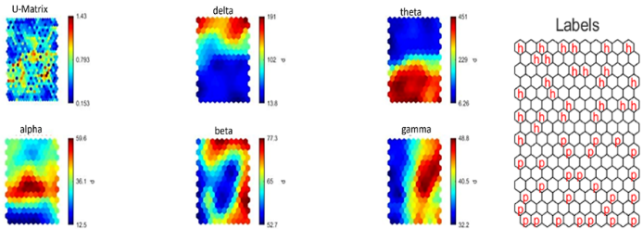
Four maps were constructed to determine the correlations between epilepsy and the five EEG frequency bands across four cortical regions: occipital (O1,
Figure 7), parietal (P3,
Figure 8), central (C3,
Figure 9), and frontal (F3,
Figure 10).
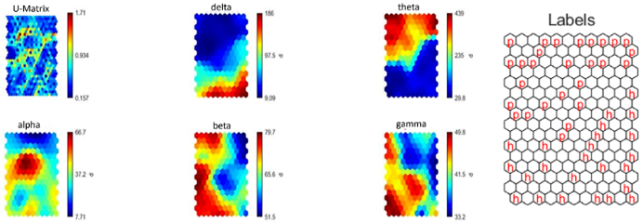
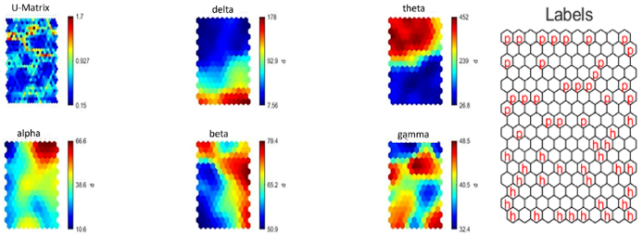
All figures in different brain regions show that the U-matrix showed two main clusters. The first cluster (C1) appeared in the upper side of the map. The second cluster (C3) was in the lower side of the map. Inspection of the component planes (CPs) and label matrices across all brain regions revealed a consistent pattern: theta-band power exhibited the most pronounced correspondence with C1 (epileptic cluster membership), represented by high-value, warm-colored (red) map units on the CP color scale. Conversely, delta-band power showed the weakest correspondence with epileptic cluster membership, represented by low-value, cool-colored (blue) units. No region-specific or cluster-specific pattern was observed for the alpha, beta, or gamma bands in any of the four maps examined.
Figure 7. Visualization of the U-matrix, CP, and label map of SOM Occipital Region.
Figure 8. Visualization of the U-matrix, CP, and label map of SOM Parietal Region.
Figure 9. Visualization of the U-matrix, CP, and label map of SOM Central Region.
Figure 10. Visualization of the U-matrix, CP, and label map of SOM Frontal Region.
5. Discussion
This study used a Self-Organizing Map (SOM) to examine the effect of epilepsy on the five canonical EEG frequency bands (delta, theta, alpha, beta, and gamma), across four cortical regions. Mainly the SOM analysis through matching of each component map with label matrices, identified two distinct clusters across all examined brain regions (frontal, central, parietal, and occipital) see
Figures 7-10, revealed that the theta band showed the strongest positive correlation with epileptic activity, while the delta band exhibited the weakest association. Notably, no significant correlation with epilepsy was found for the alpha, beta and gamma bands at any of the recorded electrode sites. The prominent elevation of theta-band activity showed in epileptic patients is in agreement with and extends findings reported in earlier neurophysiological studies. Gelety et al. and Douw et al. also found theta to be the dominant frequency band in epileptic populations, lending convergent validity to the current results
| [9] | Gelety, T. J., et al., Computerized spectral analysis of the interictal EEG in epilepsy. 1985. 16(2): 94-97. |
| [10] | Douw, L., et al., Epilepsy is related to theta band brain connectivity and network topology in brain tumor patients. BMC Neurosci, 2010. 11: p. 103.
https://doi.org/10.1186/1471-2202-11-103 |
[9, 10]
. The lack of strong correlations in the alpha, beta and gamma bands is consistent with the hypothesis that the epileptic disruption preferentially affects lower frequency oscillatory networks
| [22] | Pyrzowski, J., et al., Interval analysis of interictal EEG: pathology of the alpha rhythm in focal epilepsy. 2015. 5(1): 16230. https://doi.org/10.1038/srep16230 |
[22]
, with higher frequency cognitive rhythms relatively spared in the interictal state
| [23] | Doufesh, H., et al., Application of self organizing map for correlation hunting between alpha band power of EEG signals and other physiological parameters during Muslim prayer (salat). 2018. 30(04): 1850029.
https://doi.org/10.4015/S1016237218500291 |
[23]
. from a neurophysiological perspective, increased theta power in epilepsy has been associated with abnormal synchronization of thalamocortical circuits and disrupted inhibitory interneuron activity, mechanisms that may underlie the characteristic paroxysmal discharges observed in seizure disorders
.
In addition, the methodological advantage of SOM demonstrated here adds credence to its previous applications in similar biomedical classification studies, such as dengue prognosis
and EEG-autonomic correlation analysis during meditative states
| [24] | Vesanto, J., SOM-based data visualization meth-ods. 1999. 3 (2%J Intell. Data Anal.): p. 111–126. |
[24]
. These convergences suggest that the theta band power derived through Fast Fourier Transform processed through a SOM constitutes a meaningful and discriminative biomarker for epileptic brain states.
Similar to statistical analytic methodologies, the results of this study also demonstrate the useful and appropriate capability and use of the SOM technique for determining correlations. Nevertheless, it is challenging to compare color-coded values on the planes accurately. The well-known two-dimensional function plot can be used to compare two components in greater depth. Naturally, this may be accomplished without the SOM as an intermediary tool, but the SOM has advantages over this straightforward method. For example, the SOM eliminates noise by averaging data. More significantly, the SOM makes it possible to examine correlations even when they vary across different regions of the data space
| [24] | Vesanto, J., SOM-based data visualization meth-ods. 1999. 3 (2%J Intell. Data Anal.): p. 111–126. |
[24]
.
Despite the promising results, this study has some limitations which should be taken into account. First, the study sample was limited to 30 subjects, which is sufficient for exploratory SOM analysis, but limits statistical generalizability of the findings to larger populations of patients with epilepsy with heterogeneous seizure types and etiologies. Second, the EEG recordings were limited to four electrode positions (F3, C3, P3, O1), which, although carefully chosen, do not cover the entire scalp and can therefore miss focal or lateralized epileptic activity in underrepresented cortical territories. Third, the cross-sectional design prevents conclusions about how brain wave patterns change over time with the progression of epilepsy or treatment. Future work should expand cohorts to include specific subtypes of epilepsy and adopt dense-array EEG recordings to achieve broader cortical coverage and improved spatial resolution.
Moreover, combination of SOM with supervised classification algorithms (e.g. support vector machines or deep learning architectures) could enhance diagnostic specificity and enable real-time seizure detection pipelines. Longitudinal study designs, in which the dynamics of EEG frequency bands are assessed before and after antiepileptic pharmacotherapy, should better elucidate whether theta hyperactivity represents a stable trait marker or a state-dependent characteristic of epileptic brain function. Such extensions would greatly enhance the translational potential of SOM-based EEG analysis as a non-invasive clinical tool.
6. Conclusions
The present study demonstrated the utility of the Self-Organizing Map (SOM) as a powerful unsupervised learning technique in analyzing the relationship between epilepsy and EEG frequency bands. EEG analysis of 30 epileptic patients revealed a significant increase in the theta band power in all brain regions indicating that theta activity is the most diagnostically relevant frequency band in epilepsy. In contrast, delta, alpha, beta and gamma bands were not significantly correlated with the condition. The SOM’s capacity of projecting high dimensional neurological data to an easy-to-understand two-dimensional space confirms its great potential as a clinical decision-support tool. These results are consistent with and reinforce previous literature. Future work should expand the patient cohort and explore real-time SOM based seizure detection systems to increase clinical applicability.
Abbreviations
SOM | Self-Organizing Map |
EEG | Electroencephalogram |
ANN | Artificial Neural Network |
BMU | Best Matching Unit |
FFT | Fast Fourier Transform |
PSD | Power Spectral Density |
MP | Mean Power |
QE | Quantization Error |
TE | Topographic Error |
CP | Component Plane |
U-matrix | Unified Distance Matrix |
Author Contributions
Hazem Doufesh: Conceptualization, Formal Analysis, Investigation, Methodology, Software, Visualization, Writing – original draft, Writing – review & editing
Data Availability Statement
The data that support the findings of this study are available from the corresponding author upon reasonable request.
Conflicts of Interest
The author declares no conflicts of interest.
References
| [1] |
Obu-Cann, K., et al. Data mining of power transformer database using self-organising maps. in Info-tech and In-fo-net, 2001. Proceedings. ICII 2001 - Beijing. 2001 Inter-national Conferences on. 2001.
|
| [2] |
Alhoniemi, E., O. Simula, and J. Vesanto Analysis of Complex Systems using the Self Organizing Map. 1997.
|
| [3] |
AlTimemy, A. H. A. and F. M. A. Naima, Comparison of different neural network approaches for the prediction of kidney dysfunction. Proc. World Acad. Sci. Eng. Technol. Proceedings of World Academy of Science, Engineering and Technology, 2011. 76: p. 34-40.
|
| [4] |
Christodoulou, C. I. and C. S. Pattichis. Medical diag-nostic systems using ensembles of neural SOFM classifiers. in Electronics, Circuits and Systems, 1999. Proceedings of ICECS '99. The 6th IEEE International Conference on. 1999.
|
| [5] |
Ping-Lin, C. and T. Wei-Guang. Exploiting the Self-Organizing Map for Medical Image Segmentation. in Computer-Based Medical Systems, 2007. CBMS '07. Twen-tieth IEEE International Symposium on. 2007.
|
| [6] |
Faisal, T., F. Ibrahim, and M. N. Taib. Analysis of sig-nificant factors for dengue infection prognosis using the self organizing map. in Engineering in Medicine and Biology Society, 2008. EMBS 2008. 30th Annual International Conference of the IEEE. 2008.
|
| [7] |
Valeta, T., The Epilepsy Book: A Companion for Pa-tients Optimizing Diagnosis and Treatment. 2017: Springer. 224.
|
| [8] |
Basar, E., et al., Oscillatory brain dynamics, wavelet analysis, and cognition. 1999. 66(1): 146-183.
https://doi.org/10.1006/brln.1998.2029
|
| [9] |
Gelety, T. J., et al., Computerized spectral analysis of the interictal EEG in epilepsy. 1985. 16(2): 94-97.
|
| [10] |
Douw, L., et al., Epilepsy is related to theta band brain connectivity and network topology in brain tumor patients. BMC Neurosci, 2010. 11: p. 103.
https://doi.org/10.1186/1471-2202-11-103
|
| [11] |
Back, B., K. Sere, and H. Vanharanta, Managing Complexity in Large Data Bases Using Self-Organizing Maps. Journal of Accounting, Management and Information Technologies, 1998. 8(4): 191-210.
|
| [12] |
Rustum, R., Modelling Activated Sludge Wastewater Treatment Plants Using Artificial Intelligence Techniques (Fuzzy Logic and Neural Networks). 2009, Her-iot-Watt University: Edinburgh.
|
| [13] |
Kohonen, T., The self-organizing map. Proceedings of the IEEE, 1990. 78(9): 1464-1480.
https://doi.org/10.1109/5.58325
|
| [14] |
Faisal, T., F. Ibrahim, and M. N. J. E. S. w. A. Taib, A noninvasive intelligent approach for predicting the risk in dengue patients. 2010. 37(3): 2175-2181.
https://doi.org/10.1016/j.eswa.2009.07.060
|
| [15] |
Faisal, T., M. Taib, and F. Ibrahim, Reexamination of risk criteria in dengue patients using the self-organizing map. Medical & Biological Engineering & Computing, 2010. 48(3): 293-301.
https://doi.org/10.1007/s11517-009-0561-x
|
| [16] |
Haykin, S. S., Neural networks: a comprehensive foundation. 1999, Upper Saddle River, N. J.: Prentice Hall.
|
| [17] |
Haykin, S., Neural networks: a comprehensive foundation. 1994: Prentice hall PTR.
|
| [18] |
Uriarte, A. and D. Martín, Topology Preservation in SOM International Journal of Mathematical and Computer Sciences 2005. 1(1): 19-22.
|
| [19] |
Vesanto, J., et al., Self-organizing map in Matlab: the SOM toolbox, in In Proceedings of the Matlab DSP Conference. 1999, 35-40: Espoo, Finland, Comsol Oy.
|
| [20] |
Gonzalez, M. O. F., Fundamentals of EEG meas-urement. 2002.
|
| [21] |
Qiu, C., et al., Differences and potential mecha-nisms of theta oscillation and temporoparietal and tem-poral-central networks in temporal lobe epilepsy patients with unilateral hippocampal sclerosis. 2024. 6(1): 26.
https://doi.org/10.1186/s42494-024-00170-7
|
| [22] |
Pyrzowski, J., et al., Interval analysis of interictal EEG: pathology of the alpha rhythm in focal epilepsy. 2015. 5(1): 16230.
https://doi.org/10.1038/srep16230
|
| [23] |
Doufesh, H., et al., Application of self organizing map for correlation hunting between alpha band power of EEG signals and other physiological parameters during Muslim prayer (salat). 2018. 30(04): 1850029.
https://doi.org/10.4015/S1016237218500291
|
| [24] |
Vesanto, J., SOM-based data visualization meth-ods. 1999. 3 (2%J Intell. Data Anal.): p. 111–126.
|
Cite This Article
-
APA Style
Doufesh, H. (2026). Characterizing Epilepsy-Related EEG Frequency Patterns Using Self-Organizing Maps. International Journal of Biomedical Science and Engineering, 14(3), 60-67. https://doi.org/10.11648/j.ijbse.20261403.11
 Copy
|
Copy
|
 Download
ACS Style
Doufesh, H. Characterizing Epilepsy-Related EEG Frequency Patterns Using Self-Organizing Maps. Int. J. Biomed. Sci. Eng. 2026, 14(3), 60-67. doi: 10.11648/j.ijbse.20261403.11
Copy
|
Download
AMA Style
Doufesh H. Characterizing Epilepsy-Related EEG Frequency Patterns Using Self-Organizing Maps. Int J Biomed Sci Eng. 2026;14(3):60-67. doi: 10.11648/j.ijbse.20261403.11
Copy
|
Download
-
@article{10.11648/j.ijbse.20261403.11,
  author = {Hazem Doufesh},
  title = {Characterizing Epilepsy-Related EEG Frequency Patterns Using Self-Organizing Maps},
  journal = {International Journal of Biomedical Science and Engineering},
  volume = {14},
  number = {3},
  pages = {60-67},
  doi = {10.11648/j.ijbse.20261403.11},
  url = {https://doi.org/10.11648/j.ijbse.20261403.11},
  eprint = {https://article.sciencepublishinggroup.com/pdf/10.11648.j.ijbse.20261403.11},
  abstract = {Understanding the effects of epilepsy on oscillatory dynamics in the human brain is essential to improve the neurophysiological characterization of epileptic disorders. Self-Organizing Map (SOM) is an unsupervised artificial neural network technique that provides a powerful tool to visualize and explore complex high-dimensional EEG data without the need for predefined diagnostic labels. Thirty patients with confirmed epilepsy underwent continuous EEG recording using a computer-based data acquisition system (Nicolet NicVue). Electrode data were recorded from four scalp locations frontal (F3), central (C3), parietal (P3), and occipital (O1). Power spectral density was calculated using Fast Fourier Transform to extract the five canonical EEG frequency bands: delta, theta, alpha, beta, and gamma. Four SOM maps were trained and optimized, and correlation patterns between epileptic brain activity and each frequency band were identified through U-matrix visualization and component plane analysis. The visualized results indicated that the theta band showed the strongest positive correlation with epileptic activity, while the delta band exhibited the weakest association. Notably, no significant correlation with epilepsy was found for the alpha, beta and gamma bands at any of the recorded electrode sites. The SOM based analysis offers an interpretable and computationally efficient framework for exploring associations of EEG frequency bands in epilepsy. Consistent increase in theta-band activity across cortical regions supports its role as a candidate neurophysiological marker of epileptic brain states.},
 year = {2026}
}
Copy
|
Download
-
TY  - JOUR
T1  - Characterizing Epilepsy-Related EEG Frequency Patterns Using Self-Organizing Maps
AU  - Hazem Doufesh
Y1  - 2026/07/28
PY  - 2026
N1  - https://doi.org/10.11648/j.ijbse.20261403.11
DO  - 10.11648/j.ijbse.20261403.11
T2  - International Journal of Biomedical Science and Engineering
JF  - International Journal of Biomedical Science and Engineering
JO  - International Journal of Biomedical Science and Engineering
SP  - 60
EP  - 67
PB  - Science Publishing Group
SN  - 2376-7235
UR  - https://doi.org/10.11648/j.ijbse.20261403.11
AB  - Understanding the effects of epilepsy on oscillatory dynamics in the human brain is essential to improve the neurophysiological characterization of epileptic disorders. Self-Organizing Map (SOM) is an unsupervised artificial neural network technique that provides a powerful tool to visualize and explore complex high-dimensional EEG data without the need for predefined diagnostic labels. Thirty patients with confirmed epilepsy underwent continuous EEG recording using a computer-based data acquisition system (Nicolet NicVue). Electrode data were recorded from four scalp locations frontal (F3), central (C3), parietal (P3), and occipital (O1). Power spectral density was calculated using Fast Fourier Transform to extract the five canonical EEG frequency bands: delta, theta, alpha, beta, and gamma. Four SOM maps were trained and optimized, and correlation patterns between epileptic brain activity and each frequency band were identified through U-matrix visualization and component plane analysis. The visualized results indicated that the theta band showed the strongest positive correlation with epileptic activity, while the delta band exhibited the weakest association. Notably, no significant correlation with epilepsy was found for the alpha, beta and gamma bands at any of the recorded electrode sites. The SOM based analysis offers an interpretable and computationally efficient framework for exploring associations of EEG frequency bands in epilepsy. Consistent increase in theta-band activity across cortical regions supports its role as a candidate neurophysiological marker of epileptic brain states.
VL  - 14
IS  - 3
ER  -
Copy
|
Download





 Share This Article
 Twitter
 Linked In
 Facebook