The present work aims to characterize the geochemistry of the beach sands along the Mediterranean Coast from Al Kuwifia to Tolmeita, Northeast Libya. The study is based on 36 samples collected from the studied beach sands from 12 stations. Three samples of each station. The samples were taken from a depth of 30 cm. The statistical treatment of the obtained data involves descriptive statistics and correlation matrix. The data include 12 major oxides and 27 trace elements, as quoted in Tables. The major elements are generally considered somewhat mobile during weathering, transportation, and post-depositional processes. The major oxides CaO and MgO are the main constituents of the carbonate minerals; calcite and aragonite. SiO2 is mainly in the form of quartz. Sometimes a high quotient of SiO2 together with the oxides; Al2O3, K2O and partly of Na2O, TiO2 and Fe2O3 are essentially allocated within the structure of the feldspars. Part of Na2O and the content of Cl belong mainly to halite. Part of Fe2O3 and TiO2 may be accommodated as iron oxyhydroxides. Part of CaO and the content of SO3 are allotted within the gypsum structure. Ba, Sr, Th, U and Rare Earth Elements (REE) are basically controlled by the carbonate fraction, while Cu, Zn, V and Cr are strongly correlated with Al2O3.
| Published in | International Journal of Biochemistry, Biophysics & Molecular Biology (Volume 10, Issue 2) |
| DOI | 10.11648/j.ijbbmb.20251002.12 |
| Page(s) | 33-52 |
| Creative Commons |
This is an Open Access article, distributed under the terms of the Creative Commons Attribution 4.0 International License (http://creativecommons.org/licenses/by/4.0/), which permits unrestricted use, distribution and reproduction in any medium or format, provided the original work is properly cited. |
| Copyright |
Copyright © The Author(s), 2025. Published by Science Publishing Group |
Geochemistry, Major Oxides, Al Kuwifia, Tolmeita
Location | East Tolmeita | Tolmeita | West Tolmeita | ||||||
|---|---|---|---|---|---|---|---|---|---|
Sample No. | 1a | 1b | 1c | 2a | 2b | 2c | 3a | 3b | 3c |
SiO2 | 7.22 | 7.39 | 8.00 | 6.61 | 6.44 | 6.73 | 3.54 | 3.42 | 3.38 |
TiO2 | 0.19 | 0.21 | 0.18 | 0.11 | 0.14 | 0.16 | 0.22 | 0.25 | 0.27 |
Al2O3 | 1.25 | 1.15 | 1.11 | 1.67 | 1.90 | 1.66 | 1.08 | 1.12 | 1.22 |
Fe2O3 | 0.84 | 0.89 | 0.77 | 0.47 | 0.52 | 0.57 | 0.92 | 0.95 | 0.98 |
MnO | 0.02 | 0.02 | 0.02 | 0.01 | 0.01 | 0.01 | 0.02 | 0.02 | 0.02 |
MgO | 0.48 | 0.46 | 0.49 | 0.43 | 0.38 | 0.44 | 0.55 | 0.60 | 0.58 |
CaO | 49.28 | 49.23 | 48.37 | 49.00 | 49.15 | 49.11 | 51.28 | 51.35 | 51.30 |
Na2O | 0.09 | 0.09 | 0.09 | 0.09 | 0.08 | 0.08 | 0.06 | 0.05 | 0.05 |
K2O | 0.69 | 0.60 | 0.57 | 0.82 | 0.90 | 0.80 | 0.51 | 0.59 | 0.65 |
P2O5 | 0.13 | 0.11 | 0.14 | 0.46 | 0.42 | 0.41 | 0.16 | 0.16 | 0.13 |
SO3 | 0.28 | 0.23 | 0.26 | 0.56 | 0.59 | 0.55 | 0.17 | 0.16 | 0.16 |
Cl | 0.09 | 0.09 | 0.09 | 0.08 | 0.08 | 0.08 | 0.05 | 0.05 | 0.06 |
LOI | 39.43 | 39.39 | 39.56 | 39.16 | 39.29 | 39.25 | 40.70 | 40.84 | 40.73 |
Total | 99.99 | 99.86 | 99.65 | 99.47 | 99.90 | 99.85 | 99.26 | 99.56 | 99.53 |
Ba | 333.11 | 331.94 | 331.00 | 328.28 | 331.09 | 330.33 | 345.45 | 348.23 | 346.00 |
Sr | 3822.34 | 3818.61 | 3809.55 | 3700.22 | 3778.27 | 3717.18 | 4121.73 | 4137.36 | 4133.44 |
Cu | 86.95 | 86.74 | 87.06 | 91.53 | 91.44 | 91.19 | 59.30 | 62.08 | 63.16 |
Zn | 88.16 | 87.99 | 88.13 | 99.27 | 99.44 | 99.53 | 91.76 | 93.67 | 94.38 |
V | 31.29 | 31.08 | 31.14 | 52.19 | 52.34 | 52.03 | 34.71 | 34.77 | 34.57 |
Cr | 22.56 | 22.76 | 22.63 | 33.82 | 33.51 | 33.68 | 24.19 | 24.43 | 24.14 |
Pb | 139.00 | 139.56 | 140.43 | 128.09 | 127.57 | 122.67 | 129.59 | 128.95 | 130.34 |
As | 4.08 | 3.95 | 3.36 | 5.61 | 6.00 | 5.49 | 7.23 | 7.39 | 7.76 |
Zr | 34.77 | 34.88 | 34.70 | 33.64 | 33.72 | 33.87 | 36.75 | 36.87 | 36.92 |
Hf | 3.56 | 3.61 | 3.54 | 3.54 | 3.62 | 3.71 | 3.62 | 3.73 | 3.76 |
Th | 27.93 | 27.75 | 27.86 | 27.69 | 27.89 | 27.82 | 28.72 | 28.65 | 28.88 |
U | 10.44 | 10.33 | 10.38 | 10.27 | 10.41 | 10.31 | 10.63 | 10.61 | 10.66 |
Y | 904.89 | 904.55 | 904.00 | 904.11 | 904.18 | 904.08 | 906.14 | 906.55 | 905.40 |
La | 0.88 | 0.81 | 0.72 | 0.61 | 0.49 | 0.39 | 2.08 | 1.87 | 1.66 |
Ce | 1.11 | 1.00 | 0.97 | 0.76 | 0.69 | 0.59 | 2.23 | 2.00 | 1.93 |
Pr | 0.19 | 0.16 | 0.13 | 0.11 | 0.10 | 0.09 | 0.80 | 0.68 | 0.55 |
Nd | 0.50 | 0.45 | 0.40 | 0.35 | 0.32 | 0.27 | 1.31 | 1.08 | 1.00 |
Sm | 0.62 | 0.61 | 0.60 | 0.59 | 0.58 | 0.57 | 0.97 | 0.86 | 0.81 |
Eu | 0.03 | 0.03 | 0.03 | 0.01 | 0.01 | 0.01 | 0.21 | 0.17 | 0.13 |
Gd | 0.66 | 0.64 | 0.62 | 0.61 | 0.61 | 0.60 | 1.03 | 0.91 | 0.87 |
Tb | 0.02 | 0.02 | 0.02 | 0.01 | 0.01 | 0.01 | 0.13 | 0.11 | 0.08 |
Dy | 0.08 | 0.06 | 0.05 | 0.04 | 0.04 | 0.03 | 0.43 | 0.35 | 0.29 |
Ho | 0.03 | 0.03 | 0.03 | 0.02 | 0.02 | 0.02 | 0.16 | 0.12 | 0.09 |
Er | 0.06 | 0.05 | 0.04 | 0.04 | 0.04 | 0.04 | 0.22 | 0.19 | 0.15 |
Tm | 0.02 | 0.02 | 0.02 | 0.01 | 0.01 | 0.01 | 0.03 | 0.03 | 0.03 |
Yb | 0.04 | 0.04 | 0.03 | 0.03 | 0.03 | 0.03 | 0.22 | 0.19 | 0.14 |
Lu | 0.02 | 0.02 | 0.02 | 0.01 | 0.01 | 0.01 | 0.03 | 0.03 | 0.03 |
Location | East Tukrah | Tukrah | West Tukrah | ||||||
|---|---|---|---|---|---|---|---|---|---|
Sample No. | 4a | 4b | 4c | 5a | 5b | 5c | 6a | 6b | 6c |
SiO2 | 3.11 | 3.00 | 3.19 | 3.71 | 4.22 | 3.84 | 2.64 | 3.15 | 2.77 |
TiO2 | 0.13 | 0.17 | 0.18 | 0.26 | 0.25 | 0.32 | 0.22 | 0.24 | 0.20 |
Al2O3 | 1.33 | 1.41 | 1.23 | 1.08 | 1.00 | 1.04 | 1.11 | 1.05 | 1.00 |
Fe2O3 | 0.50 | 0.55 | 0.61 | 0.97 | 0.95 | 1.00 | 0.95 | 0.98 | 0.88 |
MnO | 0.01 | 0.01 | 0.01 | 0.01 | 0.01 | 0.01 | 0.01 | 0.01 | 0.01 |
MgO | 0.53 | 0.54 | 0.56 | 0.51 | 0.49 | 0.52 | 0.65 | 0.61 | 0.63 |
CaO | 51.22 | 51.10 | 51.16 | 51.19 | 51.08 | 51.12 | 51.52 | 51.41 | 51.45 |
Na2O | 0.05 | 0.06 | 0.05 | 0.07 | 0.06 | 0.07 | 0.07 | 0.07 | 0.07 |
K2O | 1.21 | 1.26 | 1.18 | 0.52 | 0.48 | 0.50 | 0.56 | 0.51 | 0.49 |
P2O5 | 0.33 | 0.38 | 0.29 | 0.32 | 0.29 | 0.30 | 0.41 | 0.44 | 0.40 |
SO3 | 0.23 | 0.24 | 0.24 | 0.24 | 0.24 | 0.26 | 0.27 | 0.31 | 0.33 |
Cl | 0.05 | 0.05 | 0.05 | 0.06 | 0.06 | 0.06 | 0.07 | 0.06 | 0.06 |
LOI | 40.65 | 40.53 | 40.59 | 40.62 | 40.50 | 40.55 | 40.95 | 40.83 | 40.88 |
Total | 99.35 | 99.30 | 99.34 | 99.56 | 99.63 | 99.59 | 99.43 | 99.67 | 99.17 |
Ba | 340.69 | 337.92 | 339.88 | 340.34 | 337.39 | 339.67 | 362.66 | 359.59 | 361.18 |
Sr | 4036.77 | 4010.47 | 4029.66 | 4033.48 | 4000.52 | 4023.59 | 4244.12 | 4223.54 | 4237.09 |
Cu | 89.50 | 89.95 | 89.89 | 61.05 | 60.76 | 60.87 | 62.27 | 61.98 | 62.09 |
Zn | 95.94 | 96.09 | 96.18 | 81.84 | 81.55 | 81.73 | 83.06 | 82.77 | 82.95 |
V | 40.34 | 40.13 | 40.46 | 22.86 | 22.55 | 22.53 | 44.08 | 46.88 | 51.01 |
Cr | 26.95 | 26.77 | 27.08 | 18.38 | 18.70 | 18.85 | 21.76 | 22.72 | 23.18 |
Pb | 137.41 | 138.90 | 138.98 | 141.08 | 142.57 | 141.89 | 142.95 | 143.87 | 143.67 |
As | 4.95 | 5.09 | 5.44 | 6.02 | 5.80 | 5.53 | 7.94 | 8.05 | 8.76 |
Zr | 32.22 | 32.40 | 32.48 | 36.88 | 36.92 | 36.97 | 32.19 | 32.37 | 32.42 |
Hf | 3.49 | 3.53 | 3.55 | 3.62 | 3.73 | 3.76 | 3.49 | 3.53 | 3.55 |
Th | 28.42 | 28.78 | 28.33 | 28.00 | 28.09 | 28.21 | 28.79 | 28.73 | 28.92 |
U | 10.56 | 10.64 | 10.48 | 10.46 | 10.48 | 10.54 | 10.63 | 10.61 | 10.69 |
Y | 906.11 | 906.00 | 906.03 | 905.07 | 904.98 | 906.00 | 907.00 | 906.85 | 906.91 |
La | 1.51 | 1.38 | 1.22 | 1.13 | 1.08 | 1.00 | 2.39 | 2.51 | 2.69 |
Ce | 1.55 | 1.46 | 1.33 | 1.21 | 1.17 | 1.13 | 3.00 | 3.20 | 3.39 |
Pr | 0.43 | 0.40 | 0.37 | 0.33 | 0.26 | 0.23 | 1.32 | 1.43 | 1.51 |
Nd | 0.85 | 0.80 | 0.69 | 0.64 | 0.60 | 0.55 | 2.72 | 2.95 | 3.11 |
Sm | 0.72 | 0.68 | 0.65 | 0.64 | 0.63 | 0.63 | 1.12 | 1.24 | 1.30 |
Eu | 0.11 | 0.08 | 0.05 | 0.05 | 0.04 | 0.04 | 0.22 | 0.25 | 0.26 |
Gd | 0.83 | 0.78 | 0.71 | 0.68 | 0.67 | 0.67 | 1.16 | 1.27 | 1.35 |
Tb | 0.06 | 0.04 | 0.02 | 0.02 | 0.02 | 0.02 | 0.16 | 0.20 | 0.24 |
Dy | 0.19 | 0.15 | 0.11 | 0.10 | 0.09 | 0.09 | 0.50 | 0.58 | 0.63 |
Ho | 0.07 | 0.05 | 0.03 | 0.03 | 0.03 | 0.07 | 0.20 | 0.26 | 0.33 |
Er | 0.12 | 0.10 | 0.08 | 0.07 | 0.07 | 0.07 | 0.31 | 0.38 | 0.43 |
Tm | 0.02 | 0.02 | 0.02 | 0.02 | 0.02 | 0.02 | 0.03 | 0.03 | 0.03 |
Yb | 0.10 | 0.08 | 0.06 | 0.05 | 0.05 | 0.05 | 0.29 | 0.34 | 0.38 |
Lu | 0.02 | 0.02 | 0.02 | 0.02 | 0.02 | 0.02 | 0.03 | 0.03 | 0.03 |
Location | Daryana | West Daryana | East Sidi Khalifa | ||||||
|---|---|---|---|---|---|---|---|---|---|
Sample No. | 7a | 7b | 7c | 8a | 8b | 8c | 9a | 9b | 9c |
SiO2 | 1.13 | 1.11 | 1.00 | 0.92 | 0.95 | 0.98 | 1.17 | 1.13 | 1.06 |
TiO2 | 0.01 | 0.01 | 0.01 | 0.01 | 0.01 | 0.01 | 0.02 | 0.02 | 0.02 |
Al2O3 | 0.23 | 0.26 | 0.21 | 0.19 | 0.17 | 0.21 | 0.25 | 0.28 | 0.23 |
Fe2O3 | 0.18 | 0.21 | 0.21 | 0.29 | 0.34 | 0.40 | 0.30 | 0.27 | 0.28 |
MnO | 0.01 | 0.01 | 0.01 | 0.02 | 0.02 | 0.02 | 0.01 | 0.01 | 0.01 |
MgO | 0.79 | 0.80 | 0.78 | 0.69 | 0.72 | 0.70 | 0.68 | 0.67 | 0.67 |
CaO | 54.89 | 54.60 | 54.96 | 54.81 | 54.93 | 54.73 | 54.55 | 54.26 | 54.69 |
Na2O | 0.04 | 0.04 | 0.04 | 0.07 | 0.07 | 0.08 | 0.06 | 0.06 | 0.07 |
K2O | 0.16 | 0.19 | 0.15 | 0.16 | 0.14 | 0.19 | 0.19 | 0.21 | 0.16 |
P2O5 | 0.38 | 0.59 | 0.43 | 0.33 | 0.26 | 0.28 | 0.61 | 0.72 | 0.66 |
SO3 | 0.22 | 0.22 | 0.19 | 0.13 | 0.13 | 0.11 | 0.12 | 0.14 | 0.15 |
Cl | 0.04 | 0.04 | 0.03 | 0.07 | 0.07 | 0.07 | 0.05 | 0.06 | 0.06 |
LOI | 41.91 | 41.73 | 41.97 | 41.87 | 41.95 | 41.55 | 41.71 | 41.59 | 41.84 |
Total | 99.99 | 99.81 | 99.99 | 99.56 | 99.76 | 99.33 | 99.72 | 99.42 | 99.90 |
Ba | 385.11 | 384.00 | 385.30 | 393.44 | 395.08 | 393.10 | 375.08 | 373.00 | 376.23 |
Sr | 4970.77 | 4966.38 | 4973.64 | 5026.26 | 5031.55 | 5023.27 | 4565.29 | 4555.43 | 4578.17 |
Cu | 50.89 | 50.47 | 50.70 | 40.30 | 40.69 | 40.54 | 60.07 | 60.03 | 60.20 |
Zn | 76.25 | 76.63 | 76.51 | 68.19 | 68.06 | 67.95 | 81.84 | 81.95 | 81.85 |
V | 22.97 | 23.09 | 23.15 | 22.07 | 21.94 | 21.85 | 25.19 | 25.43 | 25.30 |
Cr | 18.42 | 18.20 | 18.51 | 17.26 | 17.14 | 17.13 | 19.06 | 19.19 | 19.34 |
Pb | 107.80 | 107.00 | 107.69 | 108.73 | 108.77 | 109.08 | 110.96 | 111.37 | 111.00 |
As | 7.55 | 7.91 | 7.75 | 8.49 | 9.00 | 8.90 | 9.66 | 9.71 | 9.13 |
Zr | 32.85 | 33.08 | 32.72 | 24.65 | 24.61 | 24.72 | 29.95 | 29.73 | 29.81 |
Hf | 3.52 | 3.56 | 3.49 | 3.25 | 3.25 | 3.28 | 3.45 | 3.50 | 3.43 |
Th | 32.30 | 32.42 | 32.16 | 32.11 | 31.94 | 31.80 | 31.87 | 32.06 | 31.93 |
U | 13.57 | 13.58 | 13.54 | 13.51 | 13.42 | 13.36 | 13.13 | 13.45 | 13.25 |
Y | 1007.66 | 1007.50 | 1007.85 | 999.70 | 999.93 | 999.00 | 997.11 | 996.93 | 997.09 |
La | 4.97 | 5.19 | 5.07 | 3.80 | 4.08 | 4.24 | 3.77 | 4.00 | 4.17 |
Ce | 5.12 | 5.39 | 5.29 | 4.52 | 4.81 | 4.92 | 4.49 | 4.75 | 4.88 |
Pr | 1.08 | 1.15 | 1.10 | 0.77 | 0.83 | 1.00 | 0.75 | 0.79 | 0.95 |
Nd | 3.65 | 3.88 | 3.66 | 2.61 | 3.00 | 3.45 | 2.55 | 2.92 | 3.14 |
Sm | 1.45 | 1.52 | 1.45 | 1.15 | 1.21 | 1.35 | 1.14 | 1.16 | 1.32 |
Eu | 0.16 | 0.20 | 0.17 | 0.04 | 0.09 | 0.13 | 0.02 | 0.06 | 0.11 |
Gd | 1.49 | 1.53 | 1.51 | 1.17 | 1.27 | 1.37 | 1.15 | 1.24 | 1.32 |
Tb | 0.20 | 0.23 | 0.21 | 0.12 | 0.16 | 0.18 | 0.11 | 0.14 | 0.17 |
Dy | 0.98 | 1.05 | 1.00 | 0.63 | 0.72 | 0.91 | 0.60 | 0.66 | 0.88 |
Ho | 0.27 | 0.30 | 0.28 | 0.16 | 0.20 | 0.24 | 0.14 | 0.17 | 0.22 |
Er | 0.69 | 0.74 | 0.70 | 0.38 | 0.51 | 0.60 | 0.36 | 0.41 | 0.54 |
Tm | 0.08 | 0.09 | 0.09 | 0.05 | 0.05 | 0.06 | 0.04 | 0.04 | 0.05 |
Yb | 0.51 | 0.65 | 0.56 | 0.31 | 0.34 | 0.37 | 0.29 | 0.33 | 0.35 |
Lu | 0.08 | 0.08 | 0.08 | 0.04 | 0.05 | 0.05 | 0.04 | 0.04 | 0.05 |
Location | Sidi Khalifa | West Sidi Khalifa | Al Kuwifia | ||||||
|---|---|---|---|---|---|---|---|---|---|
Sample No. | 10a | 10b | 10c | 11a | 11b | 11c | 12a | 12b | 12c |
SiO2 | 0.81 | 0.88 | 0.90 | 0.90 | 0.93 | 0.96 | 1.11 | 1.09 | 0.98 |
TiO2 | 0.01 | 0.01 | 0.02 | 0.02 | 0.01 | 0.02 | 0.01 | 0.01 | 0.01 |
Al2O3 | 0.13 | 0.11 | 0.15 | 0.16 | 0.15 | 0.18 | 0.21 | 0.24 | 0.19 |
Fe2O3 | 0.24 | 0.28 | 0.26 | 0.22 | 0.24 | 0.24 | 0.16 | 0.19 | 0.18 |
MnO | 0.02 | 0.02 | 0.02 | 0.03 | 0.03 | 0.02 | 0.01 | 0.01 | 0.01 |
MgO | 0.86 | 0.88 | 0.90 | 0.81 | 0.85 | 0.84 | 0.73 | 0.77 | 0.78 |
CaO | 55.18 | 55.31 | 55.07 | 55.11 | 55.20 | 55.00 | 54.87 | 54.56 | 54.93 |
Na2O | 0.04 | 0.05 | 0.05 | 0.06 | 0.05 | 0.05 | 0.04 | 0.03 | 0.04 |
K2O | 0.09 | 0.07 | 0.11 | 0.12 | 0.11 | 0.13 | 0.14 | 0.17 | 0.13 |
P2O5 | 0.11 | 0.07 | 0.10 | 0.20 | 0.14 | 0.21 | 0.53 | 0.60 | 0.54 |
SO3 | 0.08 | 0.07 | 0.10 | 0.09 | 0.12 | 0.11 | 0.19 | 0.17 | 0.16 |
Cl | 0.04 | 0.04 | 0.05 | 0.05 | 0.04 | 0.05 | 0.03 | 0.03 | 0.03 |
LOI | 42.19 | 42.26 | 42.13 | 42.11 | 42.15 | 42.09 | 41.88 | 41.70 | 41.95 |
Total | 99.80 | 100.05 | 99.86 | 99.88 | 100.02 | 99.90 | 99.91 | 99.57 | 99.93 |
Ba | 398.39 | 398.75 | 398.04 | 397.00 | 397.51 | 396.34 | 390.33 | 388.56 | 392.00 |
Sr | 5228.17 | 5239.39 | 5222.43 | 5129.48 | 5137.32 | 5119.43 | 5005.29 | 5000.12 | 5013.62 |
Co | 35.34 | 35.16 | 35.27 | 38.82 | 38.30 | 38.51 | 48.53 | 48.73 | 48.85 |
Ni | 61.45 | 61.30 | 61.15 | 70.04 | 69.86 | 69.74 | 74.34 | 74.57 | 74.71 |
V | 21.75 | 21.87 | 21.93 | 22.63 | 22.51 | 22.30 | 22.75 | 22.52 | 22.71 |
Cr | 17.20 | 16.98 | 17.29 | 17.77 | 17.55 | 17.42 | 17.77 | 17.97 | 18.05 |
Pb | 124.24 | 123.48 | 125.09 | 133.92 | 133.00 | 134.36 | 187.94 | 188.05 | 188.63 |
As | 9.97 | 10.44 | 11.80 | 10.11 | 9.93 | 10.08 | 13.00 | 13.55 | 13.13 |
Zr | 27.53 | 27.48 | 27.46 | 30.40 | 30.45 | 30.52 | 28.55 | 28.68 | 28.53 |
Hf | 3.39 | 3.27 | 3.27 | 3.47 | 3.51 | 3.56 | 3.43 | 3.48 | 3.43 |
Th | 41.91 | 42.03 | 42.10 | 32.10 | 32.53 | 32.34 | 31.96 | 32.10 | 31.91 |
U | 14.04 | 14.48 | 14.60 | 13.48 | 13.59 | 13.56 | 13.29 | 13.48 | 13.19 |
Y | 1015.35 | 1015.88 | 1015.00 | 1011.40 | 1011.85 | 1011.15 | 1005.35 | 1005.00 | 1005.66 |
La | 5.33 | 5.52 | 5.71 | 5.27 | 5.48 | 5.63 | 4.92 | 5.13 | 5.00 |
Ce | 5.52 | 5.70 | 5.82 | 5.46 | 5.67 | 5.73 | 5.00 | 5.33 | 5.20 |
Pr | 1.20 | 1.26 | 1.41 | 1.18 | 1.23 | 1.33 | 1.05 | 1.11 | 1.08 |
Nd | 4.31 | 4.48 | 4.61 | 4.23 | 4.44 | 4.56 | 3.63 | 3.67 | 3.65 |
Sm | 1.58 | 1.63 | 1.73 | 1.55 | 1.60 | 1.66 | 1.40 | 1.49 | 1.43 |
Eu | 0.24 | 0.28 | 0.33 | 0.22 | 0.25 | 0.30 | 0.14 | 0.18 | 0.15 |
Gd | 1.55 | 1.62 | 1.67 | 1.54 | 1.59 | 1.64 | 1.45 | 1.52 | 1.50 |
Tb | 0.25 | 0.29 | 0.37 | 0.24 | 0.27 | 0.32 | 0.19 | 0.22 | 0.20 |
Dy | 1.09 | 1.11 | 1.18 | 1.07 | 1.10 | 1.13 | 0.96 | 1.03 | 0.98 |
Ho | 0.33 | 0.38 | 0.48 | 0.31 | 0.36 | 0.41 | 0.26 | 0.29 | 0.27 |
Er | 0.78 | 0.82 | 0.92 | 0.75 | 0.80 | 0.84 | 0.63 | 0.72 | 0.68 |
Tm | 0.09 | 0.09 | 0.09 | 0.09 | 0.09 | 0.09 | 0.06 | 0.09 | 0.08 |
Yb | 0.71 | 0.78 | 0.86 | 0.68 | 0.74 | 0.80 | 0.39 | 0.60 | 0.51 |
Lu | 0.08 | 0.09 | 0.09 | 0.08 | 0.09 | 0.09 | 0.06 | 0.08 | 0.08 |
Oxides and Elements | N | Minimum | Maximum | Mean | Std. Deviation |
|---|---|---|---|---|---|
SiO2 | 36 | 0.81 | 8.00 | 2.79 | 2.24 |
TiO2 | 36 | 0.01 | 0.32 | 0.11 | 0.10 |
Al2O3 | 36 | 0.11 | 1.90 | 0.72 | 0.56 |
Fe2O3 | 36 | 0.16 | 1.00 | 0.52 | 0.31 |
MnO | 36 | 0.01 | 0.03 | 0.01 | 0.01 |
MgO | 36 | 0.38 | 0.90 | 0.65 | 0.15 |
CaO | 36 | 48.37 | 55.31 | 52.69 | 2.35 |
Na2O | 36 | 0.03 | 0.09 | 0.06 | 0.02 |
K2O | 36 | 0.07 | 1.26 | 0.43 | 0.34 |
P2O5 | 36 | 0.07 | 0.72 | 0.33 | 0.18 |
SO3 | 36 | 0.07 | 0.59 | 0.22 | 0.13 |
Cl | 36 | 0.03 | 0.09 | 0.06 | 0.02 |
LOI | 36 | 39.16 | 42.26 | 41.08 | 0.98 |
Ba | 36 | 328.28 | 398.75 | 365.61 | 26.35 |
Sr | 36 | 3700.22 | 5239.39 | 4490.67 | 540.49 |
Cu | 36 | 35.16 | 91.53 | 60.53 | 19.13 |
Zn | 36 | 61.15 | 99.53 | 81.13 | 11.39 |
V | 36 | 21.75 | 52.34 | 30.47 | 10.53 |
Cr | 36 | 16.98 | 33.82 | 21.34 | 4.87 |
Pb | 36 | 107.00 | 188.63 | 132.74 | 21.04 |
As | 36 | 3.36 | 13.55 | 8.02 | 2.61 |
Zr | 36 | 24.61 | 36.97 | 31.74 | 3.61 |
Hf | 36 | 3.25 | 3.76 | 3.51 | 0.14 |
Th | 36 | 27.69 | 42.10 | 31.03 | 3.84 |
U | 36 | 10.27 | 14.60 | 12.05 | 1.59 |
Y | 36 | 904.00 | 1015.88 | 955.79 | 51.22 |
REE | 36 | 2.67 | 25.27 | 13.75 | 7.86 |
Location | Zr/Hf | Th/U |
|---|---|---|
East Tolmeita | 9.74 | 2.68 |
Tolmeita | 9.31 | 2.69 |
West Tolmeita | 9.95 | 2.70 |
East Tukrah | 9.19 | 2.70 |
Tukrah | 9.97 | 2.68 |
West Tukrah | 9.17 | 2.71 |
Daryana | 9.33 | 2.38 |
West Daryana | 7.56 | 2.38 |
East Sidi Khalifa | 8.62 | 2.41 |
Sidi Khalifa | 8.31 | 2.92 |
West Sidi Khalifa | 8.67 | 2.38 |
Al Kuwifia | 8.29 | 2.40 |
Location | LREE | HREE | ∑REE | LREE/HREE | ΔCe | ΔEu | Y/Ho |
|---|---|---|---|---|---|---|---|
East Tolmeita | 3.08 | 0.88 | 3.96 | 3.50 | 0.67 | 0.22 | 30149.30 |
Tolmeita | 2.18 | 0.76 | 2.94 | 2.87 | 0.70 | 0.08 | 52198.90 |
West Tolmeita | 6.78 | 1.95 | 8.73 | 3.48 | 0.42 | 0.87 | 7759.32 |
East Tukrah | 4.76 | 1.23 | 5.99 | 3.88 | 0.45 | 0.50 | 20421.80 |
Tukrah | 3.79 | 0.99 | 4.78 | 3.83 | 0.50 | 0.31 | 24426.00 |
West Tukrah | 11.54 | 3.06 | 14.60 | 3.78 | 0.35 | 0.92 | 3590.36 |
Daryana | 16.83 | 4.47 | 21.30 | 3.77 | 0.51 | 0.56 | 3563.29 |
West Daryana | 14.00 | 3.31 | 17.31 | 4.25 | 0.59 | 0.32 | 5136.76 |
East Sidi Khalifa | 13.66 | 3.11 | 16.77 | 4.41 | 0.60 | 0.23 | 5839.58 |
Sidi Khalifa | 18.89 | 5.24 | 24.13 | 3.61 | 0.49 | 0.81 | 2621.59 |
West Sidi Khalifa | 18.60 | 5.04 | 23.64 | 3.69 | 0.50 | 0.75 | 2846.50 |
Al Kuwifia | 16.52 | 4.28 | 20.80 | 3.87 | 0.52 | 0.50 | 3685.64 |
Province One | From Station No. 1 (S.1) to Station No. 6 (S.6) |
Province Two | From Station No. 7 (S.7) to Station No. 12 (S.12) |
| [1] | Abu El-Ella, N. A. (2006): Sedimentological, mineralogical and geomorphological studies on the Quaternary sediments of coastal area, W. Tripoli, Libya. PH.D. Thesis. Cairo Univ. Cairo, Egypt. |
| [2] | Anderson, D. (2003): Introduction to heavy metal monitoring. Natural Environmental Research Council. CEH. 1 p. |
| [3] | Asiedu, D. K.; Suzuki, S.; Nogami, K. and Shibata, T. (2000): Geochemistry of Lower Cretaceous sediments, Inner Zone of Southwest Japan: Constraints on provenance and tectonic environment. Geochemical Journal; 34: 155-173. |
| [4] | Bopp, R. F.; Simpson, H. J. and Chillrud, S. N. (1993): Sediment-derived chronologies of persistent contaminants in Jamaica Bay, New York. Estuaries; 16(3B): 608–616. |
| [5] | Callahan, M. A.; Slimak, M. W. and Gable, N. W. (1979): Water-related fate of 129 priority pollutants. Washington, DC: U.S. Environmental Protection Agency, Office of Water Planning and Standards. EPA-440/4-79-029a. |
| [6] | Carranza-Edwards, A.; Centeno-García, L.; Rosales-Hoz, L. and Lozano-Santa Cruz, R. (2001): Provenance of beach gray sands from western México: Journal of South American Earth Sciences; 14: 291-301. |
| [7] | Chen, J.; Wang, F. and Chen, J. (1994): Relation of aquatic particulate grain size to heavy metals concentrations in Eastern Chinese Rivers. Acta Scientiae Circumstantiae; 14: 419-425. |
| [8] | Cox, R.; Low, D. R. and Cullers, R. L. (1995): The influence of sediment recycling and basement composition on evolution of mudrock chemistry in the southwestern United States. Geochimica et Cosmochimica Acta; 59: 2919–2940. |
| [9] | Condie, K. C.; Boryta, M. D.; Liu, J. and Quian, X., (1992): The origin of khondalites: geochemical evidence from the Archean to Early Proterozoic granulitic belt in the North China Craton: Precambrian Research; 59(3-4), 207-223. |
| [10] | Dupre, B.; Gaillardet, J.; Rousseau, D. and Allegre, C. J. (1996): Major and trace element of river-born material: the Congo basin. Geochim. Cosmochim. Acta; 60: 1301–1321. |
| [11] | Elderfield, H. and Greaves, M. J. (1982): The rare earth elements in seawater. Nature; 296: 214-219. |
| [12] | Fedo, C. M.; Eriksson, K. and Krogstad, E. J. (1996): Geochemistry of shale from the Archean (~ 3.0 Ga) Buhwa Greenstone belt, Zimbabwe: Implications for provenance and source area weathering. Geochimica et Cosmochimica Acta; 60(10): 1751-1763. |
| [13] | Froelich, P. N.; Bender, M. L; Luedtke, N. A.; Heath, G. R. and Devries, T. (1982): The marine phosphorus cycle. Am. J. Sci.; 282: 474-511. |
| [14] | Gandhi, M. S. and Raja, M. (2014): Heavy mineral distribution and geochemical studies of coastal sediments between Besant Nagar and Marakkanam, Tamil Nadu, India. Journal of Radiation Research and Applied Sciences; 7: 256-268. |
| [15] | Greaves, M. J.; Elderfield, H. and Sholkovitz, E. R. (1999): Aeolian sources of rare earth elements to the Western Pacific Ocean. Marine Chemistry; 68: 31-38. |
| [16] | Hanley, M. E.; Hoggart, S. P. G.; Simmonds, D. J.; Bichot, A.; Colangelo, M. A.; Bozzeda, F.; Heurtefeux, H.; Ondiviela, B.; Ostrowski, R.; Recio, M.; Trude, R.; Zawadzka-Kahlau, E. and Thompson, R. C. (2014): Shifting sands? Coastal protection by sand banks, beaches and dunes. Coastal Engineering; 87: 136-146. |
| [17] | Jones, B. and Manning, D. C. (1994): Comparison of geochemical indices used for the interpretation of paleo-redox conditions in ancient mudstones: Chemical Geology; 111(1-4): 111-129. |
| [18] | Kawabe, I., Kitahara, Y. and Naito, K. (1991): Non-chondritic yttrium/holmium ratio and lanthanide tetrad effect observed in Pre-Cenozoic limestones. Geochem. J.; 25: 31–41. |
| [19] | Lopez, J. M. G.; Bauluz, B.; Fernández-Nieto, C. and Oliete, A. Y. (2005): Factors controlling the trace-element distribution in fine-grained rocks: the Albian kaoliniterich deposits of the Oliete Basin (NE Spain). Chemical Geology; 214(1-3): 1-19. |
| [20] | Macquaker, J. H. S.; Curtis, C. D. and Coleman, M. L. (1997): The role of iron in mudstone diagenesis: comparison of Kimmeridge Clay Formation mudstones from onshore and offshore (UKCS) localities. J. Sedim. Res.; 67: 871–878. |
| [21] | McLennan, S. M.; Hemming, S., McDaniel, D. K. and Hanson, G. N. (1993): Geochemical approaches to sedimentation, provenance, and tectonics, in Johnson, M. J., Basu, A. (eds.), Processes Controlling the Composition of Clastic Sediments: Geological Society of America, Special Paper; 284: 21-40. |
| [22] | Murray, R. W., Ten Brink, M. R. B., Gerlach, D. C., Russ III, G. P. and Jones, D. L. (1991b): Rare earth, major and trace elements in chert from the Franciscan complex and Monterey Group, California: Assessing REE sources to fine grained marine sediments. Geochimica et Cosmochimica Acta; 55: 1875-1895. |
| [23] | Nath, B. N., Bau, M., Ramlingeswara-Rao, B. and Rao, C. M., (1997): Trace and rare earth elemental variation in Arabian Sea sediments through a transect across the oxygen minimum zone. Geochimica et Cosmochimica Acta; 61: 2375-2388. |
| [24] | Nagarajan, R., Madhavaraju, J., Nagendra, R., Armstrong-Altrin, J. S. and Moutte, J. (2007): Geochemistry of Neoproterozoic shales of the Rabanpalli Formation, Bhima Basin, Northern Karnataka, southern India: implications for provenance and paleoredox conditions. Revista Mexicana de Ciencias Geológicas; 24(2): 150-160. |
| [25] | Nebsitt, H. W., Markovics, G. and Price, R. C. (1980): Chemical processes affecting alkalis and alkali earths during continental weathering. Geochim. Cosmochim. Acta; 44: 1659–1666. |
| [26] | Nothdurft, L. D., Webb, G. E. and Kamber, B. S. (2004): Rare earth element geochemistry of Late Devonian reefal carbonates, Canning Basin, Western Australia: Confirmation of seawater REE proxy in ancient limestones. Geochimica et Cosmochimica Acta; 68: 263-283. |
| [27] | Papadopoulos, A.; Christofides, G.; Pe-Piper, G.; Koroneos, A. and Papadopoulou, L. (2015): Geochemistry of beach sands from Sithonia Peninsula (Chalkidiki, Northern Greece). Mineralogy and Petrology; 109: 53-66. |
| [28] | Piper, D. Z. (1974): Rare earth elements in the sedimentary cycle. Chemical Geology; 14: 285-304. |
| [29] | Preda, M. and Cox, M. E. (2005): Chemical and mineralogical composition of marine sediments, and relation to their source and transport, Gulf of Carpentaria, Northern Australia. Journal of Marine Systems; 53: 169– 186. |
| [30] | Quinby-Hunt, M. S.; Wilde, P. and Berry, W. B. N. (1991): The provenance of low-calcic black shales. Mineralium Deposita; 26: 113–121. |
| [31] | Rollinson, H. R. (1993): Using geochemical data: evaluation, presentation and interpretation. Longman Group Ltd., 352 p. |
| [32] | Shaltami O. R. (2012): Mineral composition and environmental geochemistry of the beach sediments along the Mediterranean Coast from Benghazi to Bin Jawwad, Northeast Libya. PH. D. Thesis. Cairo Univ. Cairo, Egypt. |
| [33] | Shaltami, O. R. (2013): Mineralogical and geochemical characteristics of the Al Hilal Formation, Ras Al Hilal Area, Al Jabal Al Akhdar, NE Libya. Scientific Benghazi University Journal; 1: 41-56. |
| [34] | Suzumural, M. and Kamatani, A. (1995): Origin and distribution of inositol hexaphosphate in estuarine and coastal sediments. Limnol. Oceanogr; 40(7): 1254-1261. |
| [35] | Taylor, S. R. and McLennan, S. M. (1985): The Continental Crust: its composition and evolution. Blackwell Scientific Publishers, Oxford. |
| [36] | Thomson, J.; Crudeli, D.; De Lange, G. J.; Slomp, C. P.; Erba, E. and Corselli, C. (2004): Florisphaera profunda and the origin and diagenesis of carbonate phases in eastern Mediterranean sapropel units. Paleoceanography 9, PA3003, |
| [37] | Verma, S. P. (2005): Estadística Básica para el Manejo de Datos Experimentales: Aplicación en la Geoquímica (Geoguimiometría): México, D. F., Universidad Nacional Autónoma de México, 186 pjon. |
| [38] | Weyer, S.; Munker, C.; Rehkomper, M.; and Mezger, K. (2002): Determination of ultra-low Nb, Ta, Zr and Hf concentrations and the chondritic Zr/Hf and Nb/Ta ratios by isotope dilution analyses with multiple collector ICP-MS, Chem, Geol.; 187(3-4): 295-313. |
| [39] | White, W. M. (2001): Geochemistry: An on-line textbook. John-Hopkins University Press, 700 p. |
| [40] | Yang, S.; Jung, H. S. and Li, C. (2003): Two unique weathering regimes in the Changjiang and Huanghe drainage basins: geochemical evidence from river sediments. Sedimentary Geology; 164(1-2): 1-178. |
| [41] | Zaghloul, M. N.; Reddad, H. and Critelli, S. (2009): Source area controls on the composition of beach and fluvial sands on the southern side of the Gibraltar Strait and Western Alboran Sea (Flysch Basin, Internal and External, Domains, Northern Rif. |
| [42] | Zhang, J.; Amakawa, H. and Nozaki, Y. (1994): The comparative behaviors of yttrium and lanthanides in the seawater of the North Pacific, Geophys. Res. Lett.; 21: 2677–2680. |
| [43] | Zhang, K., J. (2004): Secular geochemical variations of the Lower Cretaceous siliciclastic rocks from central Tibet (China) indicate a tectonic transition from continental collision to back-arc rifting. Earth and Planetary Science Letters; 229: 73-89. |
APA Style
Werfalli, B. A. E., Shaltami, O. R., Alwany, R. M. A. (2025). Geochemistry of Silt Size Fraction of the Beach Sands Along the Coast Between Al Kuwifia and Tolmeita, Northeast Libya. International Journal of Biochemistry, Biophysics & Molecular Biology, 10(2), 33-52. https://doi.org/10.11648/j.ijbbmb.20251002.12
ACS Style
Werfalli, B. A. E.; Shaltami, O. R.; Alwany, R. M. A. Geochemistry of Silt Size Fraction of the Beach Sands Along the Coast Between Al Kuwifia and Tolmeita, Northeast Libya. Int. J. Biochem. Biophys. Mol. Biol. 2025, 10(2), 33-52. doi: 10.11648/j.ijbbmb.20251002.12
@article{10.11648/j.ijbbmb.20251002.12,
  author = {Basem Ahmed El Werfalli and Osama Raheel Shaltami and Ragab Mohammed Al Alwany},
  title = {Geochemistry of Silt Size Fraction of the Beach Sands Along the Coast Between Al Kuwifia and Tolmeita, Northeast Libya
},
  journal = {International Journal of Biochemistry, Biophysics & Molecular Biology},
  volume = {10},
  number = {2},
  pages = {33-52},
  doi = {10.11648/j.ijbbmb.20251002.12},
  url = {https://doi.org/10.11648/j.ijbbmb.20251002.12},
  eprint = {https://article.sciencepublishinggroup.com/pdf/10.11648.j.ijbbmb.20251002.12},
  abstract = {The present work aims to characterize the geochemistry of the beach sands along the Mediterranean Coast from Al Kuwifia to Tolmeita, Northeast Libya. The study is based on 36 samples collected from the studied beach sands from 12 stations. Three samples of each station. The samples were taken from a depth of 30 cm. The statistical treatment of the obtained data involves descriptive statistics and correlation matrix. The data include 12 major oxides and 27 trace elements, as quoted in Tables. The major elements are generally considered somewhat mobile during weathering, transportation, and post-depositional processes. The major oxides CaO and MgO are the main constituents of the carbonate minerals; calcite and aragonite. SiO2 is mainly in the form of quartz. Sometimes a high quotient of SiO2 together with the oxides; Al2O3, K2O and partly of Na2O, TiO2 and Fe2O3 are essentially allocated within the structure of the feldspars. Part of Na2O and the content of Cl belong mainly to halite. Part of Fe2O3 and TiO2 may be accommodated as iron oxyhydroxides. Part of CaO and the content of SO3 are allotted within the gypsum structure. Ba, Sr, Th, U and Rare Earth Elements (REE) are basically controlled by the carbonate fraction, while Cu, Zn, V and Cr are strongly correlated with Al2O3.
},
 year = {2025}
}
TY  - JOUR
T1  - Geochemistry of Silt Size Fraction of the Beach Sands Along the Coast Between Al Kuwifia and Tolmeita, Northeast Libya

AU  - Basem Ahmed El Werfalli
AU  - Osama Raheel Shaltami
AU  - Ragab Mohammed Al Alwany
Y1  - 2025/10/10
PY  - 2025
N1  - https://doi.org/10.11648/j.ijbbmb.20251002.12
DO  - 10.11648/j.ijbbmb.20251002.12
T2  - International Journal of Biochemistry, Biophysics & Molecular Biology
JF  - International Journal of Biochemistry, Biophysics & Molecular Biology
JO  - International Journal of Biochemistry, Biophysics & Molecular Biology
SP  - 33
EP  - 52
PB  - Science Publishing Group
SN  - 2575-5862
UR  - https://doi.org/10.11648/j.ijbbmb.20251002.12
AB  - The present work aims to characterize the geochemistry of the beach sands along the Mediterranean Coast from Al Kuwifia to Tolmeita, Northeast Libya. The study is based on 36 samples collected from the studied beach sands from 12 stations. Three samples of each station. The samples were taken from a depth of 30 cm. The statistical treatment of the obtained data involves descriptive statistics and correlation matrix. The data include 12 major oxides and 27 trace elements, as quoted in Tables. The major elements are generally considered somewhat mobile during weathering, transportation, and post-depositional processes. The major oxides CaO and MgO are the main constituents of the carbonate minerals; calcite and aragonite. SiO2 is mainly in the form of quartz. Sometimes a high quotient of SiO2 together with the oxides; Al2O3, K2O and partly of Na2O, TiO2 and Fe2O3 are essentially allocated within the structure of the feldspars. Part of Na2O and the content of Cl belong mainly to halite. Part of Fe2O3 and TiO2 may be accommodated as iron oxyhydroxides. Part of CaO and the content of SO3 are allotted within the gypsum structure. Ba, Sr, Th, U and Rare Earth Elements (REE) are basically controlled by the carbonate fraction, while Cu, Zn, V and Cr are strongly correlated with Al2O3.

VL  - 10
IS  - 2
ER  -
Arabian Gulf Oil Company, Benghazi, Libya
Department of Earth Sciences, Faculty of Science, Benghazi University, Benghazi, Libya
Department of Oil and Gas Information Technology, Higher Institute of Engineering Technologies, Benghazi, Libya
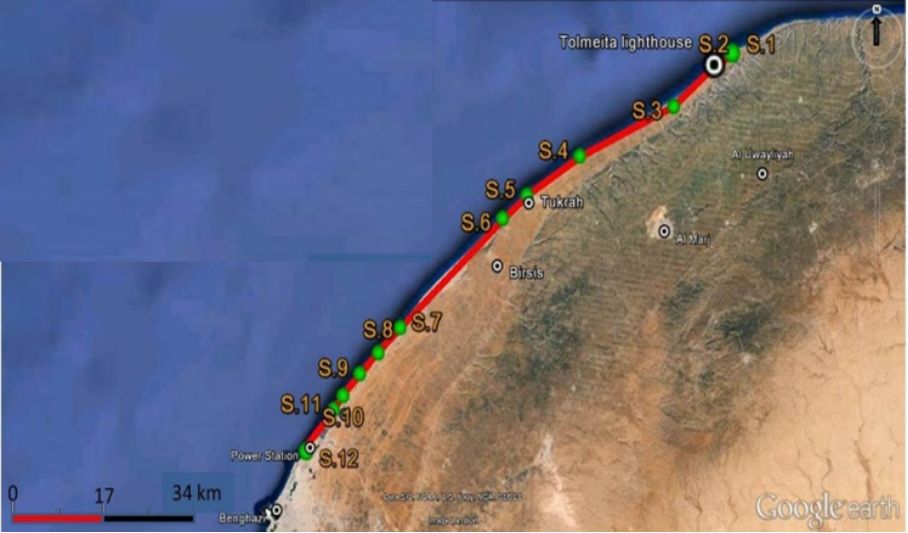
Figure 1. Location map of Libya showing the study area and the location of the sampled stations.
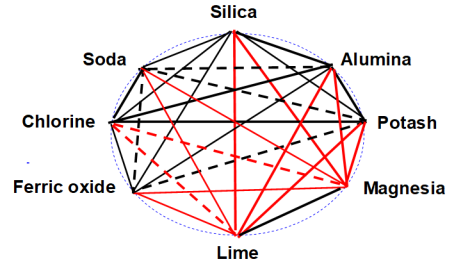
Figure 2. Correlations among the major oxides in the studied samples (intensity of lines corresponds to the strength of the correlation coefficient (< 0.4 to > 0.8)) (red line means inverse relation).
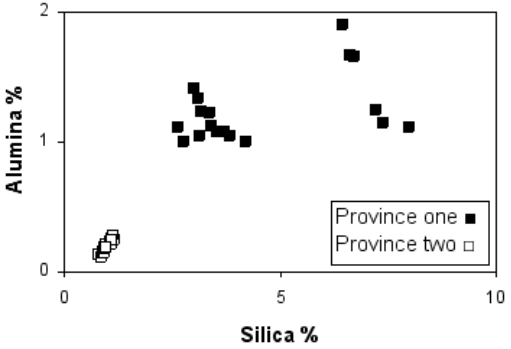
Figure 3. Relationship between silica and alumina in the study area.
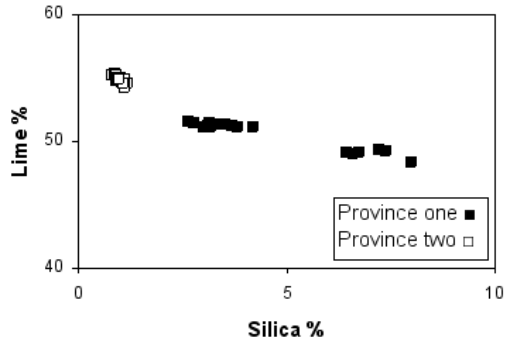
Figure 4. Relationship between silica and lime in the study area.
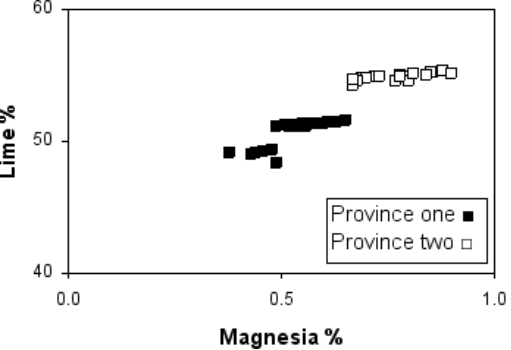
Figure 5. Relationship between magnesia and lime in the study area.
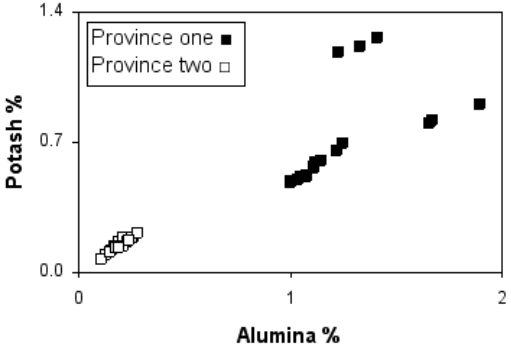
Figure 6. Relationship between alumina and potash in the study area.
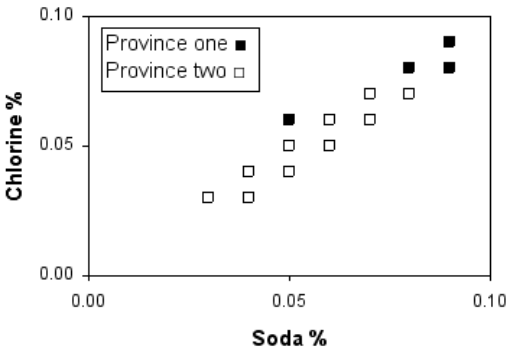
Figure 7. Relationship between soda and chlorine in the study area.
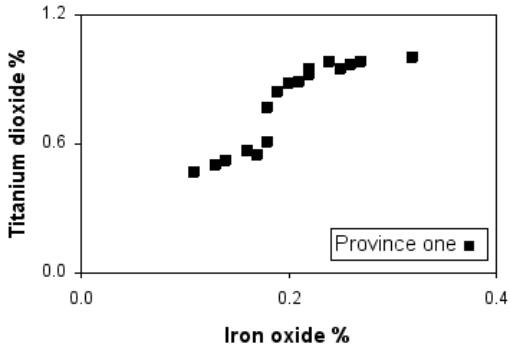
Figure 8. Relationship between iron oxide and titanium dioxide in province one.
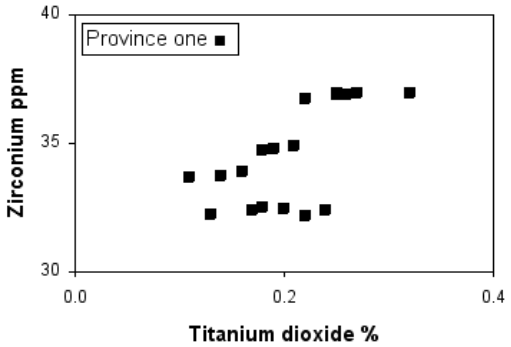
Figure 9. Relationship between titanium dioxide and zirconium in province one.
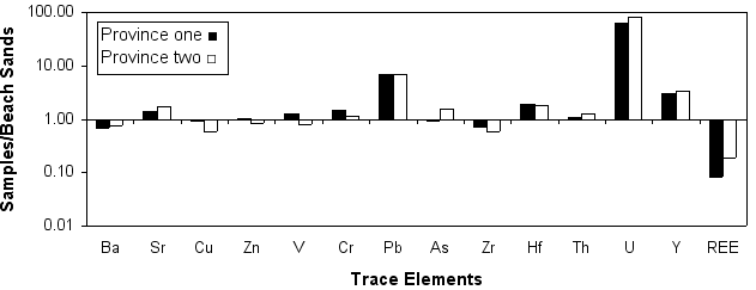
Figure 10. Trace element contents of the studied sands normalized to data of the beach sands along the Mediterranean Coast from Benghazi to Bin Jawwad, Northeast Libya as quoted by [32].
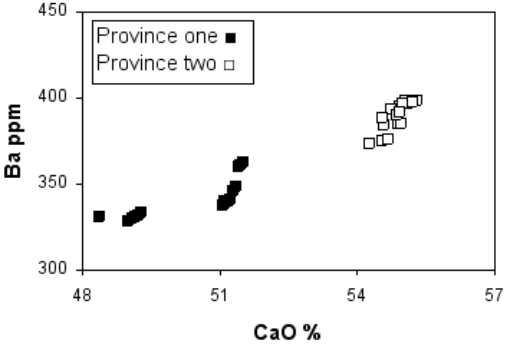
Figure 11. Relationship between lime and barium in the study area.
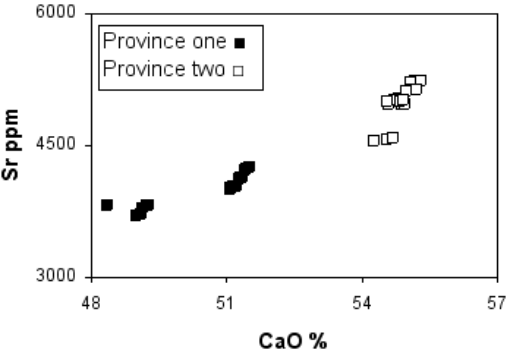
Figure 12. Relationship between lime and strontium in the study area.
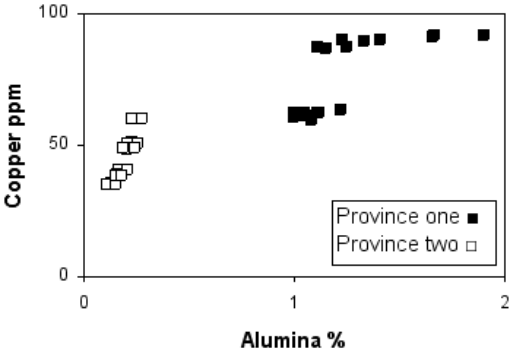
Figure 13. Relationship between alumina and copper in the study area.
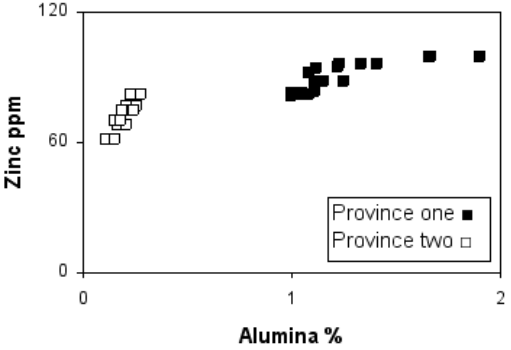
Figure 14. Relationship between alumina and zinc in the study area.
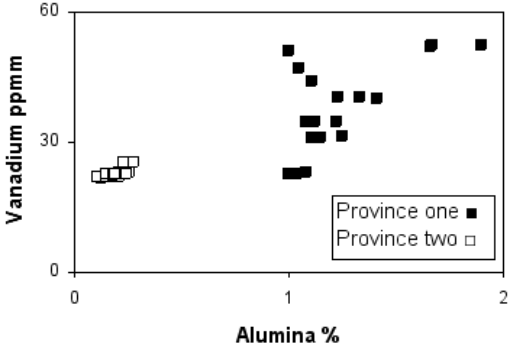
Figure 15. Relationship between alumina and vanadium in the study area.
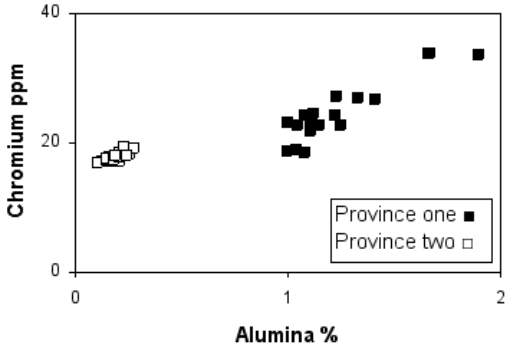
Figure 16. Relationship between alumina and chromium in the study area.
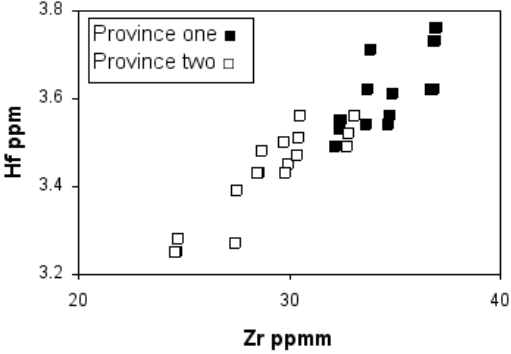
Figure 17. Relationship between Zr and Hf in the study area.
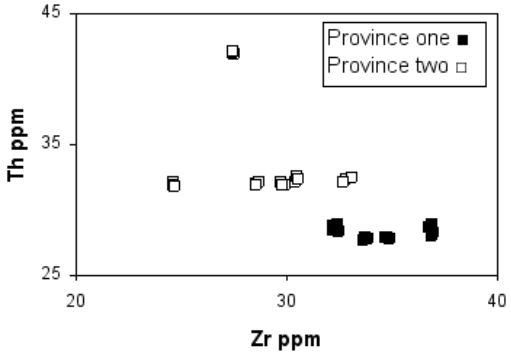
Figure 18. Relationship between Zr and Th in the study area.
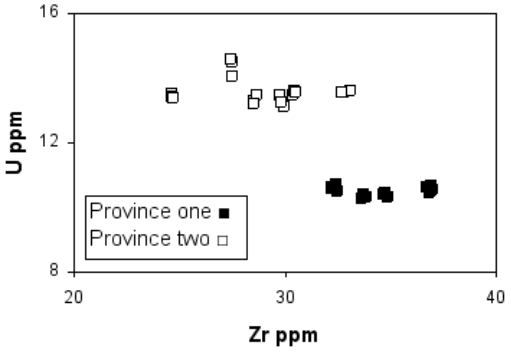
Figure 19. Relationship between Zr and U in the study area.
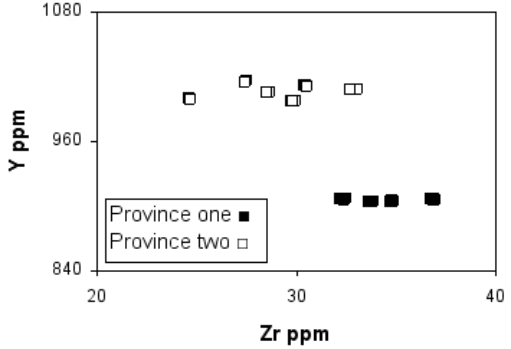
Figure 20. Relationship between Zr and Y in the study area.
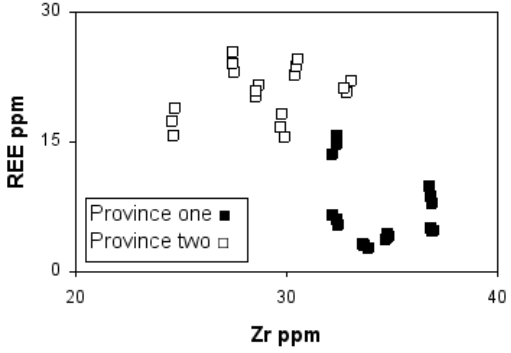
Figure 21. Relationship between Zr and REE in the study area.
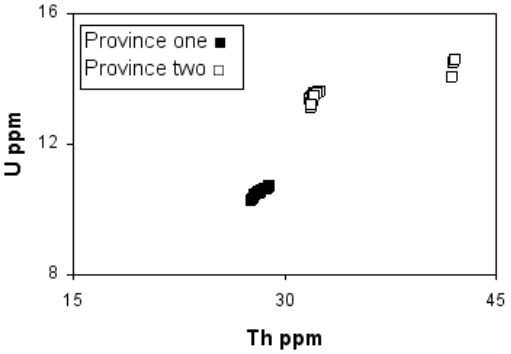
Figure 22. Relationship between Th and U in the study area.
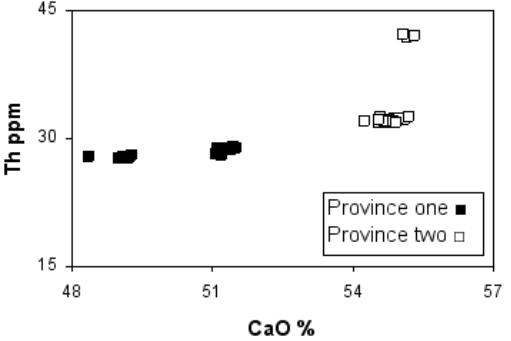
Figure 23. Relationship between CaO and Th in the study area.
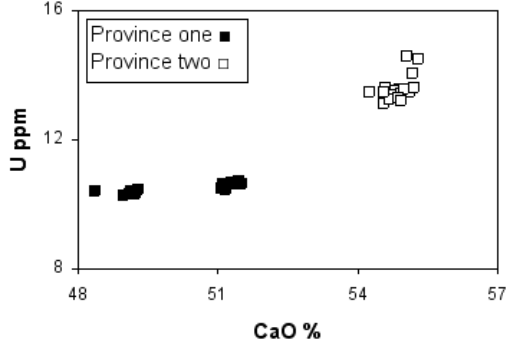
Figure 24. Relationship between CaO and U in the study area.
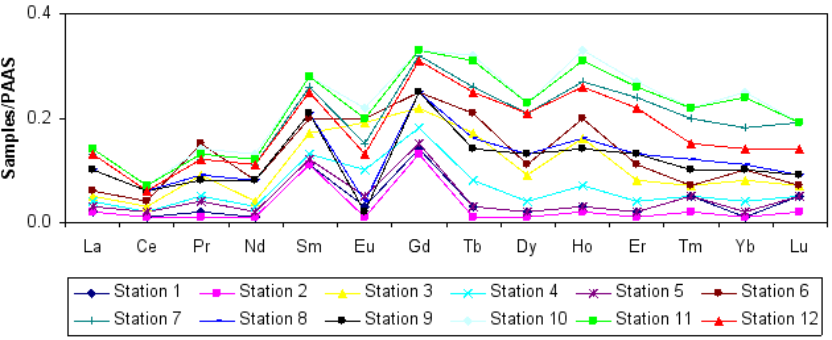
Figure 25. PAAS normalized REE diagram for the studied samples.
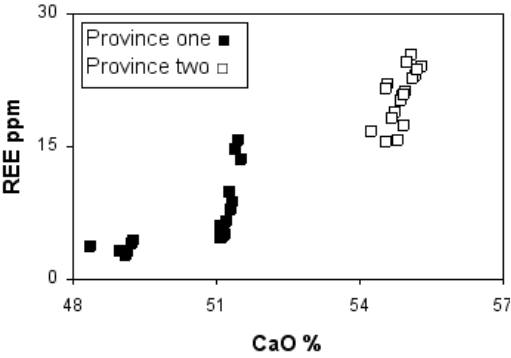
Figure 26. Relationship between CaO and REE in the study area.
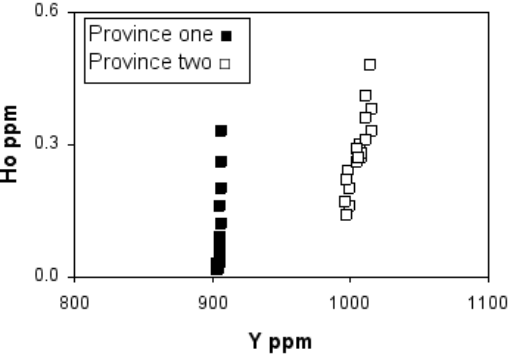
Figure 27. Relationship between Y and Ho in the study area.
Information

