1. Introduction
1.1. Background to the Study
Flooding remains one of the most frequent and destructive natural hazards worldwide, with far-reaching consequences for human lives, infrastructure, livelihoods, and ecosystems. The increasing occurrence of extreme rainfall events, coupled with rapid urbanization, land-use change, and inadequate drainage infrastructure, has intensified flood risk in many developing countries, where the capacity to anticipate and manage disasters remains limited
| [9] | Echendu, A. J. (2020). The impact of flooding on Nigeria's sustainable development goals (SDGs). Ecosystem Health and Sustainability, 6(1), Article 1791735. |
| [14] | Intergovernmental Panel on Climate Change. (2022). Climate change 2022: Impacts, adaptation and vulnerability. Contribution of Working Group II to the Sixth Assessment Report of the Intergovernmental Panel on Climate Change. Cambridge University Press. |
[9, 14]
. Although floods are natural hydrological processes, their impacts are often amplified by human activities that alter natural drainage systems and increase exposure to flood-prone environments. Consequently, flood risk is increasingly recognized as the result of the interaction between physical hazards, exposure, and socio-economic vulnerability rather than the hazard alone.
Floods account for a substantial proportion of weather-related disasters globally, affecting millions of people annually and causing extensive economic losses. According to
| [8] | Centre for Research on the Epidemiology of Disasters. (2015). EM-DAT: The international disaster database.
https://www.emdat.be/ |
[8]
, flooding remains the most frequently reported natural disaster worldwide, while the Intergovernmental Panel on Climate Change (IPCC) identifies increased flood frequency and intensity as one of the major consequences of climate change in many regions
| [14] | Intergovernmental Panel on Climate Change. (2022). Climate change 2022: Impacts, adaptation and vulnerability. Contribution of Working Group II to the Sixth Assessment Report of the Intergovernmental Panel on Climate Change. Cambridge University Press. |
[14]
. These trends are particularly evident in Sub-Saharan Africa, where rapid urban growth, inadequate infrastructure, and weak spatial planning have increased the exposure of vulnerable populations to recurrent flooding
| [1] | Abass, K. (2023). Battling with urban floods: Household experience, coping and adaptation strategies in Ghana. Cities, 140, 104430. |
| [4] | Atanga, R. A., & Tankpa, V. (2021). Climate change, flood disaster risk and food security nexus in Northern Ghana. Frontiers in Sustainable Food Systems, 5, 706721. |
[1, 4]
.
Nigeria is among the countries most severely affected by recurrent flooding. Flood events have become increasingly frequent across both urban and rural communities, with widespread impacts on settlements, agriculture, transportation, and public infrastructure. The 2022 flood disaster, described as the worst experienced in the country in over a decade, affected 32 0f 36 states, severely impacting an estimated 7.7 million people, including the displacement of about 2.4 million children, and resulted in significant damage to homes, farmlands, and critical infrastructure
| [15] | Nkwunonwo, U. C., Whitworth, M., & Baily, B. (2016). Review article: A review and critical analysis of the efforts towards urban flood risk management in the Lagos region of Nigeria. Natural Hazards and Earth System Sciences, 16(2), 349–369. |
| [20] | UNICEF. (2023). Nigeria emergency flood response: Flooding flash update.
https://www.unicef.org/nigeria/reports/nigeria-emergency-flood-response |
[15, 20]
. Beyond these large-scale disasters, seasonal flooding continues to threaten many communities due to inadequate drainage systems, indiscriminate waste disposal, floodplain encroachment, and weak enforcement of land-use regulations
| [9] | Echendu, A. J. (2020). The impact of flooding on Nigeria's sustainable development goals (SDGs). Ecosystem Health and Sustainability, 6(1), Article 1791735. |
[9]
. These recurring events highlight the need to move beyond emergency response towards integrated flood risk management that combines environmental planning, vulnerability reduction, and disaster preparedness.
Recent studies have increasingly emphasized that effective flood management requires an integrated understanding of both the physical drivers of flooding and the socio-economic characteristics that influence community vulnerability and resilience
| [5] | Aznar-Crespo, P., Aledo, A., Ortiz, G., & Vallejos-Romero, A. (2024). Generative processes of social vulnerability to flood risk: A proposal for the strategic management of social impacts. Current Sociology, 72(4), 672–696. |
| [6] | Balarabe, A., Mukhtar, I., Ahmed, A., Hassan, A. W., Umar, J. H., Salihu, S. A., & Aliyu, M. H. (2025). Assessing flood risk and community vulnerability to a hypothetical Tiga Dam failure on the Kano River, Nigeria. FUDMA Journal of Sciences, 9(11), 129–141. |
[5, 6]
. In many African communities, recurrent flooding not only damages physical infrastructure but also undermines livelihoods, threatens food security, and widens existing socio-economic inequalities, particularly where households depend heavily on agriculture and informal economic activities
| [4] | Atanga, R. A., & Tankpa, V. (2021). Climate change, flood disaster risk and food security nexus in Northern Ghana. Frontiers in Sustainable Food Systems, 5, 706721. |
| [18] | Onyenekwe, C. S., Okpara, U. T., Opata, P. I., Egyir, I. S., & Sarpong, D. B. (2022). The triple challenge: Food security and vulnerabilities of fishing and farming households in situations characterized by increasing conflict, climate shock, and environmental degradation. Land, 11(11), 1982. |
[4, 18]
. Consequently, combining geospatial techniques with socio-economic assessments has become an increasingly valuable approach for identifying vulnerable populations, understanding spatial patterns of risk, and supporting evidence-based flood risk management.
Ogbese experiences recurrent flooding that affects residential neighbourhoods, agricultural land, and public infrastructure. The town has experienced increasing physical development alongside continued dependence on agriculture, creating conditions where both settlements and livelihood assets are exposed to flood hazards. Assessing the interaction between flood hazard, socio-economic vulnerability, and land-use characteristics is therefore essential for developing effective mitigation strategies. Against this background, this study integrates household survey data with GIS-based flood hazard mapping, socio-economic vulnerability assessment, and statistical analysis to evaluate flood risk in Ogbese and provide evidence to support sustainable flood risk management and spatial planning.
1.2. Statement of the Research Problem
Ogbese presents a compelling case study of a community situated at the nexus of natural hydrological pressures and anthropogenic stressors. As one of the most commercially significant settlements in Ondo State, Ogbese is defined by the presence of the Ogbese River. While this river is a vital hydrological asset, it subjects the community to substantial flood vulnerability. The river channel has expanded over time, consistently overflowing its banks during the rainy season and resulting in fluvial flooding that inundates surrounding areas.
Compounding this natural susceptibility is the state of infrastructure; the community lacks an adequate drainage network, and existing channels are often poorly maintained. The drainage system is characterized by blockages, indiscriminate refuse dumping, and a widespread non-observance of building codes. Furthermore, the rate of urbanization in Ogbese is rapid, driven by its bustling economy. This urban expansion has led to unbridled development, where commercial and residential structures open up new fields without critical environmental impact assessments.
Crucially, agricultural activities are increasingly encroaching onto floodplains. This land-use change disrupts the soil structure, diminishing its natural resilience and infiltration capacity, thereby increasing surface runoff. Consequently, this study aims to analyze the spatial pattern and drivers of flooding in Ogbese and examine its implications for sustainable urban planning. With a location-specific investigation, this research intends to offer evidence-based solutions relevant to Ogbese and similar rapidly urbanizing environments.
Consequently, the current ad-hoc approach to development in Ogbese has outpaced the capacity of environmental planning, leaving the population exposed to escalating flood risks. Despite the recurrence of these events, there remains a paucity of location-specific empirical data that spatially quantifies the extent of flood vulnerability and analyses the interplay between anthropogenic drivers and hydrological response in the area. The primary aim of this study is therefore to spatially assess the flood risk profile of Ogbese, Ondo State, and analyze the socio-economic vulnerability of its residents to inform sustainable urban planning interventions.
1.3. Conceptual Framework
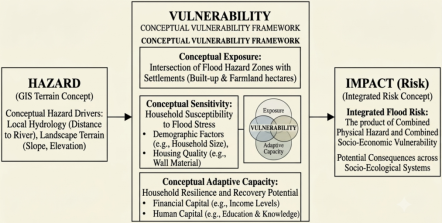
This study adopts the Vulnerability Framework adapted from
| [14] | Intergovernmental Panel on Climate Change. (2022). Climate change 2022: Impacts, adaptation and vulnerability. Contribution of Working Group II to the Sixth Assessment Report of the Intergovernmental Panel on Climate Change. Cambridge University Press. |
[14]
and
| [19] | Turner, B. L., II, Kasperson, R. E., Matson, P. A., McCarthy, J. J., Corell, R. W., Christensen, L., Eckley, N., Kasperson, J. X., Luers, A., Martello, M. L., Polsky, C., Pulsipher, A., & Schiller, A. (2003). A framework for vulnerability analysis in sustainability science. Proceedings of the National Academy of Sciences, 100(14), 8074–8079. |
[19]
. This framework posits that flood risk is not merely a product of the hazard (rainfall/river overflow) but is determined by the vulnerability of the human-environment system (
Figure 1).
Figure 1. Conceptual Flood Vulnerability and Risk Framework for Ogbese, Integrating Spatial and Socio-Economic Dimensions.
Mathematically, Flood Risk (R) is defined as a function of Hazard (H) and Vulnerability (V) (
1).
Where Hazard (H) represents the physical probability of the flood event (e.g., rainfall intensity, river discharge). Vulnerability (V) is conceptually disaggregated into three distinct components: Exposure (E), Sensitivity (S), and Adaptive Capacity (AC). The functional relationship is expressed as (
2).
In the context of Ogbese, we operationalized these theoretical variables to reflect the specific local interactions between the community and its physical environment. We define Exposure (E) as the degree to which the community spatially intersects with flood stressors; conceptually, this captures the physical proximity of residential settlements to the Ogbese River channel and the expansion of agricultural activities onto vulnerable floodplains, which we explicitly mapped using satellite imagery. We view this as being compounded by Sensitivity (S), which encompasses the underlying socio-economic and structural attributes that predispose households to damage, specifically operationalized through residents' direct experiences with displacement and severe property loss. Similarly, Adaptive Capacity (AC) represents the system's ability to withstand, adjust to, or recover from inundation. In our framework, we measure this resilience through the lens of household socio-economic capitals, specifically focusing on financial capacity via monthly income levels and human capital via formal educational attainment. Under this structural framework, overall socio-economic vulnerability functions as a direct product of exposure and sensitivity, tempered by the mitigating factor of adaptive capacity. However, even under a constant hydrological hazard scenario such as intense seasonal rainfall driven by terrain accumulation, the ultimate flood risk in Ogbese fluctuates based on the spatial intersection of these physical hazard zones with the community's baseline vulnerability profile.
2. Study Area and Methodology
2.1. Study Area
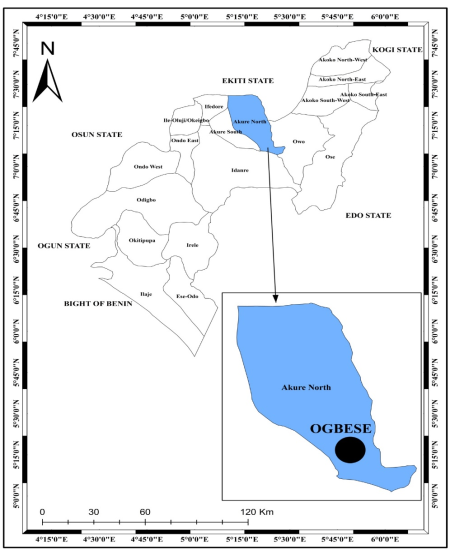
The study focuses on Ogbese, a prominent settlement situated within the Akure North Local Government Area of Ondo State, Southwestern Nigeria. Geographically, the area lies between Longitudes 5°20'0"E and 5°25'0"E and Latitudes 7°15'0"N and 7°20'0"N (
Figure 2). The area is bounded to the north by a section of the Ikere-Ise road, to the east by the Ise-Uso road, and to the south by the Akure-Owo highway. The western boundary is defined by a cut traverse running northward to intersect the Ikere-Ise road near Afolumodi village.
The drainage system is dominated by the River Ogbese, which flows in a north-south direction through the centre of the settlement. The river's hydrology significantly influences the local topography, rendering the adjacent low-lying floodplains highly susceptible to seasonal inundation.
The climate is tropical, characterized by two distinct seasons: a wet season spanning April to October and a dry season from November to March. The vegetation was originally tropical rainforest; however, anthropogenic activities—specifically intensive cultivation and agricultural expansion in the northeastern sector—have degraded the landscape into derived savannah. Patches of secondary forest remain scattered throughout the area. This loss of primary vegetative cover has reduced surface roughness and infiltration capacity, further exacerbating the area’s vulnerability to flooding. According to the 2006 National Population Commission (NPC) census, Ogbese had a population of 5,350 inhabitants. With an estimated annual growth rate of 2.4%, the population has expanded to up to 8,200 residents (estimated for 2024); increasing the pressure on land and infrastructure within flood-prone zones.
2.2. Methodology
The study adopted a mixed-method research design, integrating cross-sectional socio-economic surveys with spatial and empirical terrain modeling. This approach allowed the collection of data at a single point in time to evaluate local flood perceptions and vulnerability, while simultaneously employing a spatial analytical framework to establish how physical terrain characteristics and land use drive localized flood risk. The workflow was structured into three operational phases, beginning with primary data collection through household questionnaires, moving into the quantification of the community’s baseline vulnerability, and concluding with remote-sensing-based flood hazard mapping and multi-criteria risk modeling.
In the first phase, primary data we collected using structured, closed-ended questionnaires designed to capture respondents’ flood experiences, impacts, and adaptive capacities. To ensure our sample was statistically representative of Ogbese town's estimated population of over 8,200 individuals, the sample size was determined using the Cochran’s formula for finite populations:
where, n represents the sample size, Z is the standard normal deviation at the 95% confidence interval (1.96), p is the estimated proportion of an attribute present in the population (assumed to be 0.5 for maximum variability), q is 1 - p (0.5), and e is the acceptable margin of error. By accepting a 9% margin of error (e = 0.09) at a 5% significance level (alpha = 0.05), the minimum required sample size came to approximately 119 respondents, leading to the adoption of a final target of 120 respondents to ground the empirical validity of our survey. Systematic random sampling technique was deployed across the town to achieve representative spatial coverage, instructing our field enumerators to select every 5th building along the major distinct streets of the settlement. The questionnaires were administered through face-to-face interviews to maximize data quality, eliminate non-response bias, and maintain a high return rate, which successfully yielded a 100% response rate with all 120 copies valid for analysis. Prior the field survey, the survey instrument was subjected to rigorous content and face validation by two independent senior experts in environmental management and sociolinguistics to ensure the questions were clear, relevant, and culturally appropriate. Also, a pilot study was conducted with 12 respondents representing 10% of our target sample in a neighboring community with identical demographic and environmental characteristics, allowing us to revise minor ambiguities and run a Cronbach’s alpha reliability test, which yielded a strong internal consistency coefficient of 0.81.
During the second phase, we focused on modeling household vulnerability from our aggregated survey data using a Weighted Mean Index approach. The questionnaires were designed around a 4-point forced-choice Likert scale, intentionally omitting neutral options to eliminate central tendency bias, and standardized all sub-indicators onto a closed interval ranging from 1.0 to 4.0. On this scale, a score of 4.0 represents the absolute peak of physical exposure or sensitivity, whereas a 4.0 on the adaptive capacity scale signifies the highest level of socio-economic resilience. However, individual sub-indicator scores were computed using the mathematical formula:
where
Iis the weighted score for a given indicator, W
i is the standardized weight assigned to response category (from 1.0 to 4.0), and P
i is the proportion of the respondent population selecting that specific category. The explicit sub-indicators, questionnaire variables, standardized scale weights, and structural matrix used to establish the baseline parameters of our Flood Vulnerability Index are detailed in
Table 1.
Table 1. Operationalization and scoring Matrix for the Ogbese Flood Vulnerability Index (FVI).
Dimension andFormular | Sub-indicators | Response Categories | Assigned Weight |
Exposure (E) | E1: Flood Experience (after settling down) | No | 1.0 |
Yes | 4.0 |
E2: Rate of Flooding (Respondents’ report) | Low | 1.0 |
Moderate | 2.5 |
High | 4.0 |
Sensitivity (S) | S1: Displacement from home | SD | 1.0 |
D | 2.0 |
A | 3.0 |
SA | 4.0 |
S2: Loss/damage of property | SD | 1.0 |
D | 2.0 |
A | 3.0 |
SA | 4.0 |
Adaptive Capacity (AC) | AC1: Monthly income | Below #20,000 | 1.0 |
#21,000-40,000 | 2.0 |
#41,000-60,000 | 3.0 |
Above #60,000 | 4.0 |
AC2: Education level | No formal education | 1.0 |
Primary School | 2.0 |
Secondary School | 3.0 |
Tertiary Education | 4.0 |
The third phase focused on spatial flood hazard and risk modeling. Due to a lack of official administrative spatial boundary datasets for the Ogbese town study area, the settlement boundary was manually delineated using high-resolution satellite imagery in Google Earth Pro, relying on deep localized knowledge of the community and validating the limits with ground-truth GPS coordinate points collected during the field surveys. Landsat 8 Operational Land Imager scene was acquired from the USGS Earth-Explorer database, choosing a dry-season image to ensure optimal clear-sky observations and minimize reliance on cloud masking or pixel interpolation
| [11] | Gashaw, T., Tulu, T., Argaw, M., Worqlul, A. W., Tolessa, T., & Kindu, M. (2018). Estimating the impacts of land use/land cover changes on ecosystem service values: The case of the Andassa watershed in the Upper Blue Nile Basin of Ethiopia. Ecosystem Services, 31, 219–228. |
[11]
. The imagery was processed and classified in a GIS environment using a Random Forest classifier, a method proven to consistently outperform traditional maximum likelihood options in the Nigerian landscape by maintaining exceptionally high Kappa coefficients and overall mapping accuracies even when operating with multi-temporal datasets
| [3] | Alu, O. (2021). Predicting tropical rainforest deforestation using machine learning, remote sensing and GIS: Case study of the Cross River National Park, Nigeria. |
| [13] | Ibrahim, S. A. (2022). Improving land use/cover classification accuracy from random forest feature importance selection based on synergistic use of Sentinel data and digital elevation model in agriculturally dominated landscape. Agriculture, 13(1), 98. |
[3, 13]
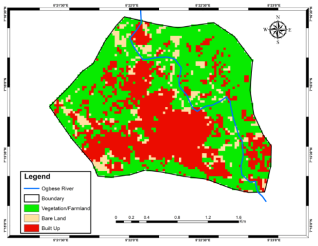
. This allowed us to divide the study area into three broad LULC zones: Built-Up footprints, Vegetation/Farmland, and Bare Land, as shown in
Figure 8. To characterize the physical terrain parameters, we obtained a Copernicus-GLO 30m Global Digital Elevation Model due to its superior vertical accuracy and performance in complex terrain configurations
| [12] | Golin, A. S., Páez Campos, H. R., Guevara Ochoa, C., Dávila, C. F., & Vives, L. S. (2024). Assessing open-access digital elevation models for hydrological applications in a large-scale plain: Drainage networks, shallow water bodies and vertical accuracy. Earth Surface Processes and Landforms, 49(15), 5269–5283. |
[12]
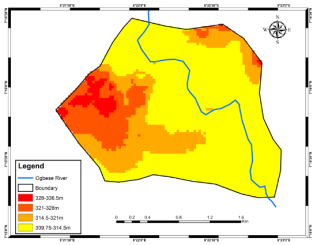
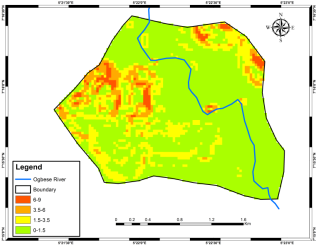
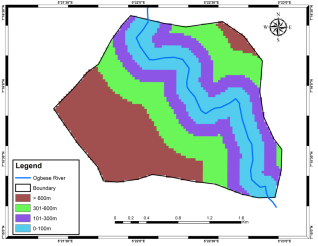
. We processed this model to extract three primary physical terrain criteria that drive hydrological accumulation: Elevation (
Figure 9), Slope (
Figure 10), and Proximity to the River channel (
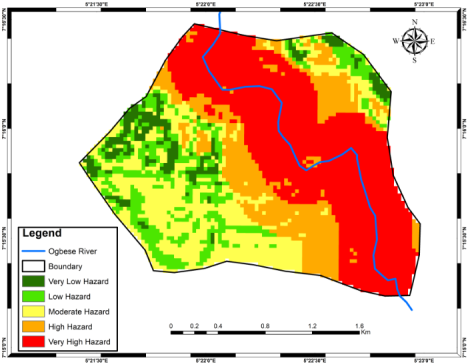
Figure 11). To delineate the spatial variances across the study area and overcome the total lack of historic event loss data, we reclassified these terrain layers into a standardized 1 to 5 susceptibility scale (representing Very Low to Very High) and integrated them within a Multi-Criteria Decision Analysis framework to generate our final Physical Flood Hazard Map (
Figure 12) using the equation:
Where,
H is the compounded Physical Flood Hazard score, W
j represents the normalized weight assigned to terrain criterion
j, and C
j represents the standardized susceptibility score of criterion
j. Given that Ogbese functions as a highly nucleated, socio-economically homogenous rural settlement, we treated socio-economic vulnerability as spatially uniform across the structural boundaries, meaning the spatial variance in risk is driven by the intersection of physical hazard zones with distinct land-use exposures. We modeled quantitative Flood Risk (
R) by extracting the standardized physical hazard values (H
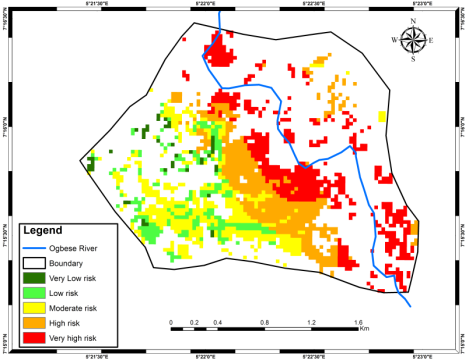
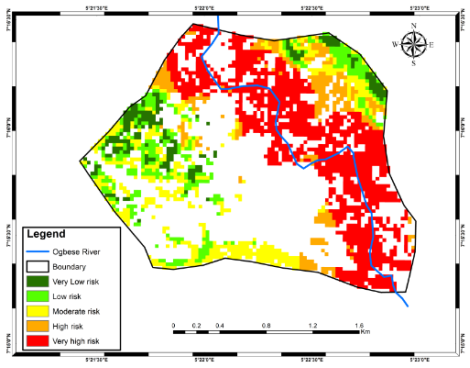
mean) strictly within the boundaries of two critical exposure layers isolated from our land cover map: Built-up Footprints for residential exposure (
Figure 13) and Vegetation/Farmland for agricultural exposure (
Figure 14). Utilizing our empirically calculated baseline Socio-Economic Vulnerability Index score of 4.661 from our survey matrix, we computed the final composite Flood Risk Score on a continuous scale of 1.0 to 25.0 using the equation:
Finally, to statistically evaluate the spatial relationship between these human landscape footprint types and the physical flood hazard zones, we conducted a Chi-Square (X2) Test of Independence using the spatial footprint hectares as weighted cases. This inferential test was explicitly designed to evaluate the null hypothesis (H0), which posits that the distribution of land use types (Built-up vs. Farmland) in Ogbese town is independent of the physical flood hazard zones, against the alternative hypothesis (H1), which states that the distribution of these land use types is significantly associated with the flood hazard zones in the study area.
3. Results
3.1. Demographic Characteristics of Respondents
The socio-economic profile of respondents, including age, gender, education, income, and duration of residencyis fundamental to understanding their perception of flood risks and their capacity for resilience.
Table 1 reveals a population distribution skewed towards an active workforce. The data indicates that 26.7% of respondents fall within the 18–25 age bracket, and 26.7% are between 33–41 years. Cumulatively, 93.3% of the respondents are under the age of 50. This dominance of a mature, active population enhances the reliability of the study, as these individuals are likely to possess a clear understanding of the community's environmental challenges. regarding gender, the distribution is nearly balanced, with males constituting 48.3% and females 51.7%, ensuring that the data reflects a non-biased, inclusive perspective of the community.
Table 2. Demographic Characteristics of the Respondents.
Characteristics | Categories | Frequency | Percentage (%) |
Age | 18-25 | 32 | 26.7 |
26-33 | 28 | 23.3 |
33-41 | 32 | 26.7 |
42-49 | 20 | 16.7 |
50-Above | 8 | 6.7 |
Gender | Male | 58 | 48.3 |
Female | 62 | 51.7 |
Education | Primary School | 30 | 25.0 |
Secondary School | 46 | 38.3 |
Tertiary Education | 22 | 18.3 |
None | 22 | 18.3 |
Residency Status | Resident | 116 | 96.7 |
Visitor | 4 | 3.3 |
Duration of Stay | 0-5 Years | 30 | 25.0 |
6-10 Years | 30 | 25.0 |
11-15 Years | 14 | 11.7 |
16+ Years | 14 | 11.7 |
Since Birth | 32 | 26.7 |
Monthly Income | Below #20,000 | 34 | 28.3 |
#21,000-40,000 | 34 | 28.3 |
#41,000 – 60,000 | 34 | 28.3 |
Above #60, 000 | 18 | 15.1 |
Total | | 120 | 100.0 |
Education levels are relatively high; 81.7% of respondents possess some form of formal education (Primary: 25%, Secondary: 38.3%, Tertiary: 18.3%). This high literacy rate suggests that the majority of the population is capable of understanding environmental concepts and can be effectively engaged in public awareness campaigns regarding flood mitigation. Residency status is crucial for the validity of historical flood data. The survey shows that 96.7% of respondents are permanent residents. Furthermore, regarding the duration of stay, a significant 26.7% have lived in Ogbese since birth, while 23.4% have resided there for over 11 years. This longevity implies that a significant portion of the sample population has witnessed major historical flood events, specifically the devastating floods of 2012 and 2022, lending high credibility to their responses.
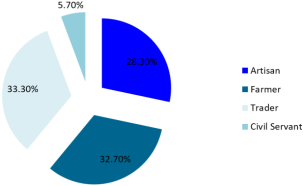
The monthly income of the respondents revealed that a combined 84.9% of the population earns ₦60,000 or less monthly, evenly split across three lowest income brackets (under ₦20,000, ₦21,000–₦40,000, and ₦41,000–₦60,000 at 28.3% each). With only 15.1% earning above ₦60,000, the data overwhelmingly indicates that the vast majority of residents live below the national average income threshold. This economic reality means the population faces persistent financial hardship, leaving them with practically zero disposable income or savings to build resilience against external shocks such as environmental disasters or seasonal flooding. A further investigation on the type of occupation of respondents reveals a community heavily reliant on informal, low-tier economic activities with a highly vulnerable financial profile. while traders constitute the single largest demographic group at 33.3%, they operate alongside substantial clusters farmers (32.7%), and artisans (28.3%), contrasted against a negligible formal public sector presence of just 5.7% civil servants. This structural dominance of the informal economy directly reflects the community's constrained income distribution (
Figure 3).
Figure 3. Respondents’ occupational status.
3.2. Nature and Occurrence of Flooding in Ogbese
To understand the flood regime, respondents were queried on their flood awareness prior to settlement, the frequency of events, and their rationale for occupying flood-prone zones.
Table 2 highlights a paradox of awareness. A substantial majority (73.3%) were aware that the area was prone to flooding before they settled there. However, despite this prior knowledge, they proceeded to develop or rent properties in these high-risk zones. Post-settlement, 81.7% confirmed they have been directly affected by flood events.
Table 3. Knowledge of Flooding Before and After Settling.
Characteristics | Categories | Frequency | Percentage (%) |
Awareness (Before) | Yes | 88 | 73.3 |
No | 32 | 26.7 |
Experience (After) | Yes | 98 | 81.7 |
No | 22 | 18.3 |
Total | | 120 | 100.0 |
3.2.1. Frequency of Occurrence
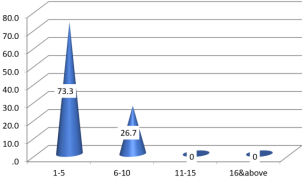
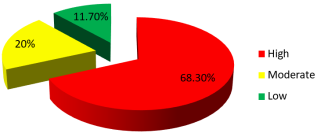
In the absence of official hydrological records, resident perception serves as a proxy for flood frequency. The majority (73.3%) indicated that flooding occurs 1–5 times annually, while 26.7% reported a frequency of 6–10 times. The respondents further revealed that the annual rate of flooding occurrence is high as supported by 68.3% of the respondents, 20% indicated that the annual rate is moderate, while just 11.7% indicated that flooding occurrence rate is low on annual basis. This high recurrence rate indicates that flooding in Ogbese is not a rare anomaly but a chronic environmental threat requiring urgent intervention (
Figures 4 and 5).
Figure 4. Annual frequency of flooding in the study area.
Figure 5. Annual rate of flooding occurrence.
3.2.2. Rationale for Occupying Floodplains
Despite the risks, 51.7% of respondents claimed they initially settled there because the specific site had not been flooded at that time, suggesting a recent expansion of the flood hazard zone. However, economic constraints are a major driver; 25% cited limited available housing options, and 13.3% cited affordability. This indicates that poverty and land scarcity are significant drivers of vulnerability in Ogbese (
Table 3).
Table 4. Reasons for Residing in Flood-Prone Areas.
Reason | Frequency | Percentage (%) |
It was affordable | 16 | 13.3 |
Land was inherited | 12 | 10.0 |
The only available option | 30 | 25.0 |
It was never flooded (at time of entry) | 62 | 51.7 |
Total | 120 | 100.0 |
3.3. Factors Responsible for Flooding
The study identified a convergence of anthropogenic and natural factors driving flood susceptibility in Ogbese, as presented in
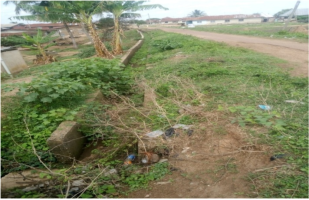
Table 4. There is a strong consensus among residents that poor waste management is a critical catalyst, with 86.7% (Strongly Agree + Agree) identifying it as a primary cause. The indiscriminate dumping of refuse in drainages and river channels obstructs water flow, exacerbating flood risks. This is compounded by the deplorable state of infrastructure; an overwhelming 91.7% of respondents identified the poor drainage system characterized by blockages and structural dilapidation—as a major culprit. Field observations (
Figure 6) corroborate this, revealing dilapidated, blocked, or non-existent drainage networks in critical areas.
Urbanization pressures have also led to the encroachment of construction and farming activities onto riverbanks. Approximately 73.4% of respondents agreed that these activities contribute to the problem, highlighting a widespread disregard for town planning setbacks and a reduction in the natural buffering capacity of the floodplain. While these human-induced factors are significant, the respondents also acknowledged the role of climatic variability. A total of 83.3% attributed a large portion of the flood incidence to excessive rainfall, a factor frequently overwhelming the compromised drainage capacity of the settlement. Opinions on river channel modifications were mixed, but qualitative interviews suggest the river is becoming shallower due to siltation, further reducing it carrying capacity.
Table 5. Perceived Factors Responsible for Flooding.
Factors | SA (%) | A (%) | D (%) | SD (%) | Total (%) |
Poor waste management | 71.7 | 15.0 | 3.3 | 10.0 | 100.0 |
Construction/Farming on river banks | 51.7 | 21.7 | 23.3 | 3.3 | 100.0 |
Population increase/Urban expansion | 31.7 | 21.7 | 8.3 | 38.3 | 100.0 |
Widening of river channel | 8.3 | 31.7 | 23.3 | 36.7 | 100.0 |
Poor drainage system | 76.7 | 15.0 | 1.7 | 6.7 | 100.0 |
Excessive rainfall | 73.3 | 10.0 | 5.0 | 13.3 | 100.0 |
(Note: SA=Strongly Agree, A=Agree, D=Disagree, SD=Strongly Disagree)
Figure 6. A typical drainage system in Ogbese showing blockage and structural failure.
3.4. Impact of Flooding
The socio-economic ramifications of flooding in the study area are profound and multifaceted, as detailed in
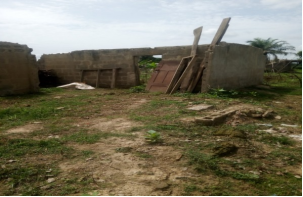
Table 5. The most pervasive impact is the destruction of property, affirmed by a massive 78.4% of respondents (Strongly Agree + Agree) (
Figure 7). This recurring destruction traps residents in a cycle of financial instability, forcing them to frequently expend meagre resources on repairs and replacements. Physical displacement is another critical consequence; 71.6% of respondents agreed that they face temporary or permanent eviction from their homes during peak flood events. Given that Ogbese is largely an agrarian community; the impact on livelihoods is equally severe. Approximately 73.3% of respondents agreed that flooding destroys farmlands, posing a critical threat to both food security and local income stability.
Beyond tangible economic losses, the study highlights a significant psychological toll. Three-quarters (75%) of the respondents agreed that flooding causes social unrest and psychological distress, with qualitative interviews revealing a pervasive "fear of rain" among those living near the riverbank. Conversely, while property damage is widespread, the loss of life appears to be less frequent. A significant 68.3% of respondents strongly disagreed that flooding cause regular fatality, a trend likely attributed to adaptive behaviours such as early evacuation before floodwaters reach lethal levels. Despite the low mortality rate, the cumulative effect of displacement, economic loss, and psychological stress underscores a high level of vulnerability within the community.
Table 6. Impact of Flooding.
Impact | SA (%) | A (%) | D (%) | SD (%) | Total (%) |
Displacement from home | 63.3 | 8.3 | 13.3 | 15.0 | 100.0 |
Destruction of properties | 71.7 | 6.7 | 18.3 | 3.3 | 100.0 |
Loss of farmland | 55.0 | 18.3 | 11.7 | 15.0 | 100.0 |
Psychological/Social impact | 43.3 | 31.7 | 11.7 | 13.3 | 100.0 |
Loss of lives | 21.7 | 8.3 | 1.7 | 68.3 | 100.0 |
(Note: SA=Strongly Agree, A=Agree, D=Disagree, SD=Strongly Disagree)
Figure 7. Structural collapse of a building resulting from flood action.
3.5. Control Measures and Institutional Response
The assessment of flood control measures reveals a significant gap in governance and infrastructure management, as detailed in
Table 6. Residents overwhelmingly favour engineering solutions, with the majority (81.7%) identifying the clearing of drainages and dredging of waterways as the most effective interventions to mitigate future flooding. However, the current operational landscape is dominated entirely by self-help efforts rather than institutional policy. The data reveals that 91.7% of control measures are undertaken by individuals, and 8.3% by community groups, while a staggering 0% of respondents attributed any flood control initiatives to the government.
This institutional void extends to post-disaster recovery and social safety nets. Arguably the most striking finding is that 100% of respondents indicated they have never received relief packages or support from the government following a flood event.
Table 7. Control Measures and Government Intervention.
Characteristics | Categories | Frequency | Percentage (%) |
Most Effective Measure | Clearing drainages /dredging | 98 | 81.7 |
Stop building/ farming on banks | 2 | 1.7 |
Stop indiscriminate waste disposal | 14 | 11.7 |
Strict law enforcement | 6 | 5.0 |
Source of Current Control | Individual | 110 | 91.7 |
Community | 10 | 8.3 |
Government | 0 | 0.0 |
Receipt of government relief | Yes | 0 | 0.0 |
No | 120 | 100.0 |
3.6. Flood Vulnerability Index
Within a potential index range of 0.25 to 16.00, a community-wide score of 4.661 places Ogbese in a state of low-to-moderate Vulnerability (
Table 8). The primary driver of this vulnerability profile is the narrow gap between physical exposure and structural sensitivity. The composite Exposure score of 3.400 is heavily driven by the fact that 81.7% of the respondents have first-hand experience with flooding, with 68.3% battling high-frequency inundations on an annual basis. This physical hazard translates directly into high Sensitivity (3.333), as seen in the widespread structural losses (S
2 = 3.468) and forced displacement (S
1 = 3.197) reported across the study area. The critical issue is that the physical impact of these floods is not matched by a strong capacity to recover. The community's Adaptive Capacity sits at a low score of 2.431. This is primarily a reflection of low income levels (AC
1 = 2.298), with 15.1% of the respondents surviving on above ₦60,000 per month. These tight financial constraints make it extremely difficult for residents to invest in flood-resilient building materials or independent channelization. Additionally, limited formal educational attainment (AC
2 = 2.564), where only 18.3% of respondents hold a tertiary qualification, further restricts access to diverse, climate-resilient livelihoods and formal disaster-response networks.
Table 8. Flood Vulnerability Index.
Dimension | Sub-indicators | WMI Score | Combined score |
Exposure (E) | E1: Flood Experience (after settling down) | 3.451 | 3.40 |
E2: Rate of Flooding (Respondents’ report) | 3.349 |
Sensitivity (S) | S1: Displacement from home | 3.197 | 3.333 |
S2: Loss/damage of property | 3.468 |
Adaptive Capacity (AC) | AC1: Monthly income | 2.298 | 2.431 |
AC2: Education level | 2.564 |
Ogbese Composite Score (V) | 4.661 |
3.7. Spatial Analysis of Flood Risk
The total land area of Ogbese town is calculated to be 454 hectares (ha). The LULC analysis (
Figure 8) revealed that the Built-Up of Ogbese is 167.25 ha (about 36.84% of the total land area), the Vegetation/farmland takes 244.9 ha (about 53.94% of the total land area), while the bareland covers 41.85 ha (9.22% of the total land area). This shows that ogbese is a town that is in transition, facing development due to increasing population. The terrain analysis showed that Ogbese sits on a low-to moderate relief with elevation range between 309 – 329m (
Figure 9), with a gentle slope between 0-9
0 (
Figure 10).
Figure 9. Elevation map of Ogbese.
Figure 11. Distance from Ogbese River.
The spatial extent of flood hazard is shown in
Figure 12. The result revealed that 5.63% of Ogbese is in the Very Low flood zone, 12.76% in the Low flood hazard, 21.20% in the moderate hazard, 17.97% in the high hazard, and 42.44% in the Very high hazard zone. This means that about 50% of the town are in danger zone of flood hazard. (
Table 9). Furthermore, the overlay analysis of the built-up and vegetation/farmland on the flood hazard zone revealed critical exposure across both residential and agricultural land use. For the built-up footprint (167.25{ha}), only 2.62% (4.38{ha}) of structural assets are situated in safe, Very Low Risk zones (
Figure 13). Also, a staggering 59.54% (99.58{ha}) of Ogbese's residential structures are concentrated directly within High and Very High physical hazard pathways (
Table 9). Similarly, the agricultural sector exhibits severe exposure. Out of 244.90{hectares} of evaluated farmlands, 47.39% (116.07{ha}) falls within the Very High Risk zone, while an additional 12.22% (29.92{ha}) is classified as High Risk (
Figure 14). Together, nearly 60% of the community's agricultural livelihood footprint is highly exposed to seasonal inundation (
Table 9).
Figure 12. Flood hazard map of Ogbese.
Figure 13. Built Up Flood risk.
Figure 14. Vegetation/farmland risk.
Table 9. Spatial Distribution of Flood Risk Classes in Ogbese Town.
Flood Hazard/Risk class | Baseline Landscape Area (ha) | Baseline Landscape (%) | Built-Up Area (ha) | Built-Up (%) | Farmland Area (ha) | Farmland (%) |
Very Low | 25.54 | 5.63 | 4.38 | 2.62 | 19.15 | 7.82 |
Low | 57.94 | 12.76 | 20.58 | 12.31 | 32.97 | 13.46 |
Moderate | 96.25 | 21.20 | 42.69 | 25.53 | 47.08 | 19.22 |
High | 81.58 | 17.97 | 47.74 | 28.55 | 29.92 | 12.22 |
Very High | 192.69 | 42.44 | 51.84 | 30.99 | 116.07 | 47.39 |
Total | 454.00 | 100.00 | 167.25 | 100.00 | 244.90 | 100.00 |
3.8. Integrated Flood Risk Index
The integration of physical flood hazard with the socio-economic vulnerability assessment produced High to Very High flood risk scores for both residential and agricultural sectors (
Table 10). The built-up areas recorded a flood risk score of 17.39, whereas agricultural farmlands recorded a slightly higher score of 17.63. These results indicate that both land-use sectors are located within areas of elevated flood risk.
Table 10. Standardized Sectoral Flood Risk Profiles (Scale 1–25).
Exposure sector | Mean physical hazard(1-5) | Socio-Economic Vulnerability (SEVI) | Final flood risk score | Qualitative risk |
Built Up (Residential) | 3.73 | 4.661 | 17.39 | High to Very High |
Farmland (Agricultural) | 3.78 | 4.661 | 17.63 | High to Very high |
3.9. Hypothesis Testing
To statistically evaluate the spatial relationship between human landscape footprint types (Residential Built-up vs. Agricultural Farmland) and flood hazard zones, a Chi-Square (X2) Test of Independence was conducted. The hypothesis is stated as:
H0 (Null Hypothesis): The distribution of land use types (Built-up vs. Farmland) in Ogbese town is independent of the physical flood hazard zones.
H1 (Alternative Hypothesis): The distribution of land use types is significantly associated with the flood hazard zones in Ogbese town.
The results revealed a highly significant relationship between the type of human landscape footprint and the physical flood hazard classes, with a calculated Pearson Chi-Square (X2) value of 27.771 across 4 degrees of freedom, an evaluated sample footprint of 413 hectares, and a p-value of less than 0.001.
Table 11. Chi-Square Tests.
| Value | df | Asymptotic Significance (2-sided) |
Pearson Chi-Square | 27.771a | 4 | .000 |
Likelihood Ratio | 28.257 | 4 | .000 |
Linear-by-Linear Association | .141 | 1 | .708 |
N of Valid Cases | 413 | | |
a. 0 cells (0.0%) have expected count less than 5. The minimum expected count is 9.36. |
We further assessed the strength of this spatial association using Cramér's
V (Table 12), which revealed a moderate and statistically significant relationship (
V = 0.259, p < 0.001). This highly significant result allows rejection of the null hypothesis that land use is randomly distributed across the hydrological landscape, statistically proving instead that human activities in Ogbese are systematically and unequally exposed to flood hazards.
Table 12. Cramer’s V test.
| Value | Approximate Significance |
Nominal by Nominal | Phi | .259 | .000 |
Cramer's V | .259 | .000 |
N of Valid Cases | 413 | |
Specifically, while we noted that residential built-up structures show a more balanced distribution across transitional risk zones, agricultural farmlands are disproportionately concentrated within the most critical pathways. Nearly half of the community's cultivated footprint, accounting for 47.39% or 116.07 hectares, is bound directly to the very high hazard floodplain. This structural arrangement highlights a profound socio-economic constraint facing the community: local agrarian livelihoods are inherently tied to the high-risk, moisture-rich alluvial dynamics of the Ogbese River channel, forcing a compromise between agricultural productivity and flood exposure.
4. Discussion of Findings
The findings of this study demonstrate that flood vulnerability in Ogbese is shaped by the interaction of socio-economic conditions, environmental change, and inadequate institutional support. Although most respondents possessed some level of formal education and were aware of the flood risk before settling in the area, this awareness did not translate into reduced exposure. Many residents continued to occupy flood-prone locations because of limited housing alternatives and financial constraints. This finding suggests that flood exposure is driven more by structural socio-economic factors than by a lack of hazard awareness, consistent with previous studies that identify poverty, rapid urbanization, and weak land-use planning as key drivers of flood vulnerability in developing countries
| [5] | Aznar-Crespo, P., Aledo, A., Ortiz, G., & Vallejos-Romero, A. (2024). Generative processes of social vulnerability to flood risk: A proposal for the strategic management of social impacts. Current Sociology, 72(4), 672–696. |
| [15] | Nkwunonwo, U. C., Whitworth, M., & Baily, B. (2016). Review article: A review and critical analysis of the efforts towards urban flood risk management in the Lagos region of Nigeria. Natural Hazards and Earth System Sciences, 16(2), 349–369. |
| [16] | Ologunorisa, T. E. (2004). An assessment of flood vulnerability zones in the Niger Delta, Nigeria. International Journal of Environmental Studies, 61(1), 31–38. |
[5, 15, 16]
. The predominance of low-income households engaged in farming, trading, and artisanal occupations further limits the community's adaptive capacity, reducing their ability to invest in resilient housing, recover from flood losses, or relocate to safer environments.
The study also reveals that flooding in Ogbese results from the combined effects of climatic and anthropogenic factors. Respondents consistently identified inadequate drainage infrastructure, indiscriminate waste disposal, excessive rainfall, and encroachment onto riverbanks as the principal causes of flooding. These perceptions were supported by field observations of blocked and deteriorated drainage channels. While intense rainfall provides the hydrological trigger, poor environmental management and increasing urban development substantially amplify flood impacts by restricting stormwater conveyance and increasing surface runoff. Similar observations have been reported by
| [17] | Olorunfemi, F. (2010). Disaster risk management in Nigeria: Flooding in perspective (Discussion Paper). Nigerian Institute of Social and Economic Research (NISER). |
[17]
and
| [9] | Echendu, A. J. (2020). The impact of flooding on Nigeria's sustainable development goals (SDGs). Ecosystem Health and Sustainability, 6(1), Article 1791735. |
[9]
, who argued that urban flooding in Nigeria is increasingly a consequence of poor planning, ineffective drainage systems, and weak enforcement of environmental regulations rather than natural factors alone.
The socio-economic consequences of flooding extend beyond damage to physical infrastructure. Property destruction, temporary displacement, loss of farmland, and psychological distress were identified as the major impacts on affected households. The high incidence of farmland loss is particularly significant because agriculture constitutes a major source of livelihood within the community. Consequently, recurrent flooding simultaneously threatens household income, food production, and residential security, thereby reinforcing existing socio-economic vulnerability
| [4] | Atanga, R. A., & Tankpa, V. (2021). Climate change, flood disaster risk and food security nexus in Northern Ghana. Frontiers in Sustainable Food Systems, 5, 706721. |
| [18] | Onyenekwe, C. S., Okpara, U. T., Opata, P. I., Egyir, I. S., & Sarpong, D. B. (2022). The triple challenge: Food security and vulnerabilities of fishing and farming households in situations characterized by increasing conflict, climate shock, and environmental degradation. Land, 11(11), 1982. |
[4, 18]
. Although fatalities were reported to be relatively infrequent, the cumulative effects of repeated flood events are likely to undermine long-term household resilience through persistent asset depletion and livelihood disruption.
A major contribution of this study lies in the integration of socio-economic assessment with GIS-based flood hazard analysis. Spatial analysis revealed that approximately 60% of Ogbese falls within High and Very High flood hazard zones, while nearly 60% of both residential built-up areas and agricultural land are located within these high-risk environments. This indicates that flood exposure is not confined to residential settlements but also threatens the community's principal economic resource. The resulting overlap between hazard-prone landscapes and critical livelihood assets illustrates how continued urban expansion and agricultural activities within floodplains have increased both physical and socio-economic exposure. Similar relationships between land-use change and increasing flood risk have been reported in rapidly urbanizing African settlements
| [1] | Abass, K. (2023). Battling with urban floods: Household experience, coping and adaptation strategies in Ghana. Cities, 140, 104430. |
| [2] | Adelekan, I. O. (2010). Vulnerability of poor urban coastal communities to flooding in Lagos, Nigeria. Environment and Urbanization, 22(2), 433–450. |
| [15] | Nkwunonwo, U. C., Whitworth, M., & Baily, B. (2016). Review article: A review and critical analysis of the efforts towards urban flood risk management in the Lagos region of Nigeria. Natural Hazards and Earth System Sciences, 16(2), 349–369. |
[1. 2, 15]
.
The Flood Vulnerability Index further showed that Ogbese exhibits moderate socio-economic vulnerability, primarily due to high exposure and sensitivity combined with relatively low adaptive capacity. However, integrating vulnerability with spatial flood hazard produced High to Very High flood risk scores for both residential and agricultural sectors. This demonstrates that vulnerability and risk are not synonymous
| [6] | Balarabe, A., Mukhtar, I., Ahmed, A., Hassan, A. W., Umar, J. H., Salihu, S. A., & Aliyu, M. H. (2025). Assessing flood risk and community vulnerability to a hypothetical Tiga Dam failure on the Kano River, Nigeria. FUDMA Journal of Sciences, 9(11), 129–141. |
[6]
; while households may possess a moderate capacity to cope with flood events, the widespread concentration of people and livelihood assets within highly hazardous locations substantially elevates overall flood risk. The slightly higher risk observed for agricultural land underscores the dependence of local livelihoods on fertile floodplain environments
| [7] | Balgah, R. A., Ngwa, K. A., Buchenrieder, G. R., & Kimengsi, J. N. (2023). Impacts of floods on agriculture-dependent livelihoods in Sub-Saharan Africa: An assessment from multiple geo-ecological zones. Land, 12(2), 334. |
| [10] | Effiong, C. J. (2025). Resilience of river-based livelihoods on flood-prone areas covering the Lower Niger River in Nigeria (Doctoral dissertation, University of Birmingham). |
[7, 10]
, making recurrent flooding both an environmental and an economic challenge.
The significant Chi-square association between land-use type and flood hazard further confirms that residential development and agricultural activities are not randomly distributed across the landscape but are disproportionately concentrated within flood-prone areas. This statistical evidence strengthens the spatial analysis by demonstrating that existing settlement and land-use patterns have increased community exposure to flooding.
Finally, the study highlights a substantial institutional gap in flood risk management. Residents overwhelmingly reported reliance on individual and community-based coping strategies, with no evidence of government-led flood control measures or post-disaster relief. This limited institutional support reduces community resilience and perpetuates a cycle of recurrent flood losses. Strengthening drainage infrastructure, enforcing land-use regulations, protecting floodplains from encroachment, and incorporating spatial vulnerability information into local planning are therefore essential for reducing flood risk in Ogbese. Furthermore, the observed concentration of residential and agricultural land within high flood hazard zones highlights the need for proactive land-use planning, stricter enforcement of development regulations, improved drainage infrastructure, and community-based flood mitigation measures.
Although, integrating spatial hazard assessment with socio-economic vulnerability provides a more comprehensive basis for identifying priority intervention areas and allocating limited resources effectively. Nevertheless, the findings should be interpreted in light of certain limitations. The socio-economic analysis relied partly on respondents' recollection of past flood experiences, which may be subject to recall bias, while the flood risk assessment was based on GIS-derived indicators rather than hydrodynamic modelling. Future studies incorporating observed hydrological data and hydraulic models would further improve the precision of flood risk assessment and support more robust planning decisions.





 Share This Article
 Twitter
 Linked In
 Facebook
 Copy
Copy Download