Research Article | | Peer-Reviewed

Climate Change Impacts on Hydrology of Jemma River Sub Basin, Upper Blue Nile, Ethiopia

Published in Hydrology (Volume 13, Issue 3)
Received: 6 June 2025     Accepted: 30 June 2025     Published: 19 July 2025
Views:       Downloads:
Abstract

Understanding the potential impacts of climate change on hydrological processes and water resources at regional and local scales is essential for developing effective adaptation strategies. This study evaluates the projected effects of climate change on the Jemma River Basin, located in the Upper Blue Nile region of Ethiopia, using future climate data derived from the second-generation Canadian Earth System Model (CanESM2) under three Representative Concentration Pathways (RCP2.6, RCP4.5, and RCP8.5). The climate projections were downscaled and bias-corrected at the catchment level using observed station data from within the basin. Hydrological modelling was conducted using the Soil and Water Assessment Tool (SWAT), while model calibration and validation were carried out with the SUFI2 algorithm in the SWAT-CUP framework. The calibration phase produced performance metrics of R² = 0.83 and NSE = 0.69, while validation results were R² = 0.84 and NSE = 0.71 for monthly streamflow simulations. To evaluate future climate-induced changes, percentage variations in precipitation, potential evapotranspiration (PET), streamflow, and temperature were analyzed for three future periods 2030s (2021-2040), 2060s (2051-2070), and 2090s (2081-2100) relative to the baseline period (1991-2010). Under RCP2.6, annual, seasonal, and monthly rainfall is generally projected to increase, except during the Kiremt (JJAS) season in the 2060s and 2090s. For RCP4.5 and RCP8.5, rainfall is expected to increase consistently across all future periods. PET projections under RCP2.6 suggest increases during Kiremt and Bega (ONDJ) but declines during Belg (FMAM). In contrast, PET is projected to rise annually and during Bega and Belg seasons under RCP4.5, with a decrease during Kiremt. For RCP8.5, PET is expected to decrease on an annual basis and during Bega and Belg, but increase in Kiremt. Temperature projections indicate a consistent upward trend across all scenarios and timeframes. Regarding streamflow, results show an increase during Belg, whereas annual, Kiremt, and Bega flows are projected to decline under all RCP scenarios and future periods. These findings highlight that the Jemma River's future flow regime is likely to be significantly influenced by climate change. Sensitivity analysis further demonstrated that projected streamflow is more responsive to variations in rainfall than to changes in PET or temperature across all scenarios.

Published in Hydrology (Volume 13, Issue 3)
DOI 10.11648/j.hyd.20251303.11
Page(s) 174-199
Creative Commons

This is an Open Access article, distributed under the terms of the Creative Commons Attribution 4.0 International License (http://creativecommons.org/licenses/by/4.0/), which permits unrestricted use, distribution and reproduction in any medium or format, provided the original work is properly cited.

Copyright

Copyright © The Author(s), 2025. Published by Science Publishing Group

Keywords

Jemma River Basin, Climate Change, CMIP5, RCPs Scenario, Streamflow, SWAT

1. Introduction
Climate change refers to long-term alterations in the statistical properties of the climate system, such as changes in the mean or variability, persisting over several decades or longer. Over the past two decades, it has emerged as a pressing concern globally due to its far-reaching consequences on human livelihoods, ecosystems, and socio-economic structures. The Intergovernmental Panel on Climate Change (IPCC), in its Fifth Assessment Report, reported a rise of approximately 0.85°C in global mean temperature between 1880 and 2012 . This warming has been accompanied by various shifts in climatic patterns, including increased frequency and intensity of extreme events such as floods and droughts .
Globally, these climatic shifts are expected to significantly affect hydrological systems at regional and local levels . In Africa, and particularly in the eastern region, water resources are central to both natural ecosystems and human development, making the continent especially vulnerable to climate variability and change . In East Africa, erratic rainfall patterns, shifting seasonal cycles, and extreme weather events are disrupting agricultural productivity and water supply systems, thereby threatening food and water security.
Although Africa contributes the least to global greenhouse gas emissions due to its relatively low industrial activity, it remains among the most vulnerable regions to climate change impacts . These impacts are particularly severe for sectors such as agriculture and water, which are highly climate-sensitive. Rising greenhouse gas concentrations have led to changes in temperature, rainfall patterns, and evapotranspiration, all of which directly affect the hydrological cycle . This, in turn, influences the quantity and distribution of surface runoff, recharge rates, and water availability, ultimately threatening sustainable development, especially in agriculture, urbanization, and industry.
For Ethiopia a country whose economy is predominantly agrarian climate change poses serious risks. A significant proportion of its landscape is semi-arid or arid, with susceptibility to drought and land degradation. The IPCC highlights that countries like Ethiopia will bear disproportionate climate impacts. Given this vulnerability, assessing climate change effects on water resources is critical to informing adaptation strategies . Ethiopia’s rainfall variability is strongly linked to ocean-atmosphere phenomena such as El Niño and La Niña . However, rainfall trends in Ethiopia are characterized by significant inter-annual and intra-seasonal variability. As noted by , Ethiopia's economic resilience is heavily reliant on agricultural activities, which, in turn, depend on water availability. Therefore, understanding how climate change may alter hydrological dynamics is vital for the future of Ethiopian agriculture.
The Ethiopian Highlands, home to the origin of the Blue Nile River, are regarded as a key hydrological zone in East Africa. This river is a critical transboundary water source, sustaining livelihoods not only in Ethiopia but also in downstream countries such as Sudan and Egypt. Ensuring the sustainable use of this resource is paramount. However, increasing water demand for irrigation, domestic use, and urban expansion particularly in regions like North West Shewa places additional pressure on available supplies in the Jemma River Basin, a tributary of the Upper Blue Nile. Despite extensive research on climate change impacts in the Upper Blue Nile basin . Earlier assessments often relied on a small number of global climate models (GCMs) from the CMIP3 framework and used Special Report on Emissions Scenarios (SRES), which do not incorporate mitigation policies or updated emissions trajectories . To improve the reliability of climate impact projections, the current study utilizes more recent Representative Concentration Pathways (RCPs) based on the CMIP5 ensemble, which provides more policy-relevant scenarios.
In this study, updated General Circulation Models (GCMs) are employed to simulate climate processes and assess future variability. The RCP scenarios (RCP2.6, RCP4.5, RCP6.0, and RCP8.5) were developed through collaborative efforts across scientific disciplines . These scenarios reflect different greenhouse gas concentration trajectories and are integral to future climate modeling.
Given the outlined challenges, this study seeks to analyzed the anticipated effects of climate change on water resources in the Jemma River Basin. The primary objectives are:
(1) to assess projected changes in precipitation, temperature, and potential evapotranspiration at the local scale using downscaled GCM data;
(2) to evaluate the impact of these changes on hydrological processes using a calibrated hydrological model;
(3) to conduct a sensitivity analysis of the Jemma Basin's hydrology in response to climate variability. The results of this study aim to support policymakers, planners, government bodies, and development partners in crafting evidence-based adaptation and mitigation strategies. Downscaled climate projections were obtained from CMIP5 GCMs using the Climate Model data for Hydrologic Modeling (CMhyd) tool and integrated into the SWAT 2012 model to simulate future hydrological responses and assess water availability across different scenarios in the Jemma River catchment.
2. Data and Methodology
2.1. Description of the Study Areas
The Jemma River sub-basin, covering approximately 15,782 km², lies within the Upper Blue Nile watershed (around 9.15-10.16° N, 37.34-38.34° E). Elevations range from 1,040 m in the lowlands characterized by hot, moist conditions to 3,840 m in the eastern highlands, which are cool and humid above 2,800 m (Figure 1). Numerous smaller streams feed into the main channel, which flows westward into the Abay River. Land use is dominated by mixed agriculture and agro-pastoral systems, with areas of pure pastoralism. Climatically, the basin spans four local zones Wurch, Dega, Woyna Dega, and Kola according to the National Meteorological Agency’s classification .
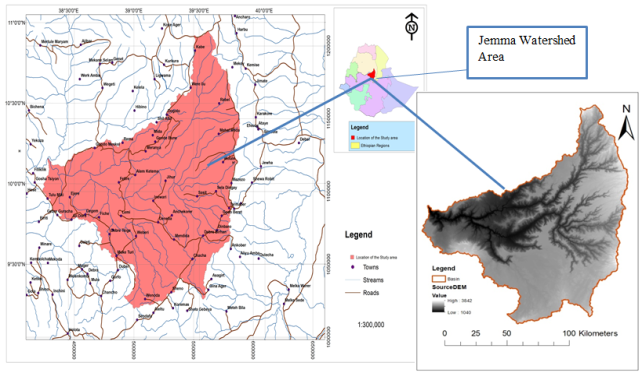
Figure 1. Location of Jemma River sub basin, Upper Blue Nile.
2.2. Data and Sources
2.2.1. Meteorological Data
Daily records (1991-2010) of rainfall, temperature, humidity, wind speed, and sunshine hours were obtained from six well-instrumented stations (Alem Ketema, Debre Birhan, Fiche, Mehal Meda, Mandiida, Kabi) via the Ethiopian National Meteorological Agency.
2.2.2. Hydrological Data
The flow analysis part consists of production of flow duration curve and mass curve figures. In order to use the river flow data of a gauged station in an un-gauged station, the data need to be converted using the formula:
Qsite=AungaugedAgauged*IungaugedIgauged*Qgauged(1)
Where:
Aungauged=Catchment area of the ungauged site
Agauged=Catchment area of the gauged station
Iungauged=Precipitation of the ungauged site
Igauged=Precipitation of the gauged site
Qungauged=Discharge of the ungauged site
Qgauged=Discharge at the gauged station
Since our site is located close to the Robi Gumero gauged station, we assumed the precipitation to be similar but the catchment area for the Robi Gumero site about 887Km2 while that of alternative site is 5412Km2. Thus, we have used the following formula to convert the gauged data at Robi Gumero to the alternative site.
Qsite=6.632*QRobi Gumero (2)
Based on the formula to get Jemma River flow data. So daily flow data for Robi Gumero gauged station for a period of 20 years from 1991 - 2010 G. C recorded was collected from Ministry of Water Irrigation & Electricity (MoWIE). The missing discharge data was filled using linear regression.
2.2.3. Climate Projections Data
CMIP5 CanESM2 outputs (1951-2100) under RCP2.6, 4.5, and 8.5 daily precipitation and temperatures were downloaded from the ESGF portal; other variables were held constant for future runs.
2.2.4. Spatial Data
A 30 m × 30 m SRTM DEM defined basin topography and stream networks; national land-use and soil maps supplied inputs for hydrologic response units (soil texture, hydraulic conductivity, bulk density, and texture fractions).
2.3. Methodology
For this study prepare high‐resolution climate inputs, CMhyd was employed to downscale daily CMIP5 CanESM2 outputs to the Jemma sub-basin following established procedures . Bias correction used the linear scaling method: monthly temperature biases were adjusted additively and precipitation multiplicatively to align corrected monthly means with observations over the 1991-2010 baseline. These correction factors were then applied to future projections under RCP2.6, RCP4.5, and RCP8.5 for the 2030s (2021-2040), 2060s (2051-2070), and 2090s (2081-2100).
Hydrological simulations were conducted with SWAT2012 in ArcSWAT. A 30 m SRTM DEM delineated 29 sub-basins and, together with soil and land-use maps, defined 278 hydrologic response units (HRUs). The model was calibrated (2000-2006) and validated (2007-2010) using SUFI2 in SWAT-CUP, with performance evaluated by Nash-Sutcliffe Efficiency and the coefficient of determination (R²).
For impact assessment, the calibrated SWAT model was forced with bias-corrected daily rainfall and temperature under each RCP scenario, while other meteorological variables and land use were held constant. Simulated streamflow for the baseline (1991-2010) was compared against the three future periods to quantify changes in monthly, seasonal, and annual flows, including extremes. Sensitivity analyses isolated the relative influence of perturbations in precipitation, temperature, and potential evapotranspiration on streamflow responses.
3. Results and Discussion
3.1. Performance Evaluation of SWAT Hydrologic Model
3.1.1. Sensitivity Analysis
Sensitivity analysis is a key technique for assessing the impact of parameter uncertainty on model performance . It evaluates how changes in individual parameters affect the output of the model. In this study, 23 model parameters were assessed, of which 15 were identified as relatively sensitive. The global sensitivity analysis ranked CN2 (Curve Number) as the most influential parameter affecting streamflow, indicated by its very low p-value and high t-statistic. In contrast, HRU_SLP (average slope steepness of the Hydrologic Response Unit) was found to be the least sensitive due to its high p-value and low t-statistic.
3.1.2. Flow Calibration and Validation
Following the sensitivity analysis, model performance was evaluated using observed and simulated discharge data for monthly and daily time steps. The calibration period was from 2000 to 2006, with a warm-up period of 1998-1999, while the validation period spanned from 2007 to 2010. Performance metrics included the Coefficient of Determination (R²), Nash-Sutcliffe Efficiency (ENS), and Percent Bias (PBIAS). The results met the performance criteria recommended by , which suggest R² > 0.6 and ENS > 0.5 for acceptable simulations.
Table 1. Statistical analysis result for Monthly calibration and validation.

No

Site

Calibration (2000-2006

Validation (2007-2010)

R2

ENS

PBIASE

R2

ENS

PBIASE

1

Jemma Basin

0.83

0.69

-20.1

0.84

0.71

-17.8

The monthly simulated streamflow closely mirrored the observed streamflow in terms of pattern and seasonality. However, some peak flows were underestimated, and base flows were slightly overestimated during the validation period. These discrepancies may be attributed to limited spatial coverage of climate gauging stations, suboptimal calibration parameter selection, and the quality of input data from some stations.
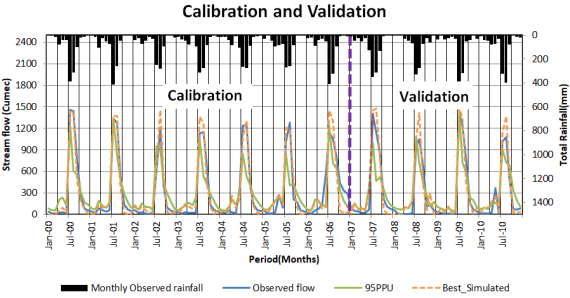
Figure 2. Monthly observed vs. simulated streamflow and rainfall at the Jemma River outlet (2000-2010).
On a daily scale, the model performance ranged from good to very good across both calibration and validation periods, again satisfying criteria.
Table 2. Daily calibration and validation statistics for the Jemma River.

No

Name

Calibration (2000-2006)

Validation (2007-2010)

R2

ENS

PBIASE

R2

ENS

PBIASE

1

Jemma Basin

0.72

0.68

21.2

0.74

0.70

23.8

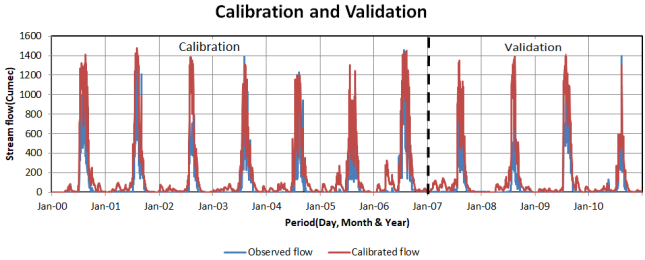
Figure 3. Daily observed vs. simulated streamflow at the Jemma River outlet (2000-2010).
Despite the overall satisfactory performance, the daily simulation showed underestimation of some peak flows and slight overestimation of base flows. These deviations may result from the sparse distribution of climate gauging stations, the selection of geophysical parameters during calibration, and the quality of observational data.
3.2. Statistical Results of Climate Projections Under RCP Scenarios
Base period analysis of rainfall, potential evapotranspiration, and temperature are:
I. Rainfall
The bias-corrected monthly average rainfall derived from RCP projections closely replicates the observed rainfall patterns over the base period (1991-2010). The temporal distribution and frequency of rainfall events are consistent with the observed data, as reflected by a high correlation coefficient of 0.91 (see Figure 4). This strong agreement indicates the reliability of the bias-corrected historical RCP rainfall data for use in further analysis.
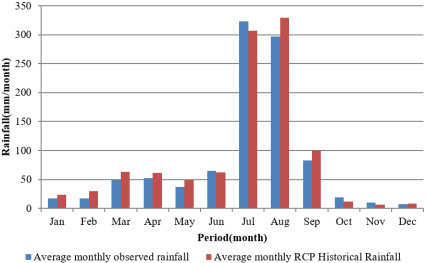
Figure 4. Comparison of observed and historical RCP mean monthly rainfall for the base period (1991-2010).
II. Temperature
Figures 5 and 6 present a comparison of observed and historical RCP temperature datasets, including both maximum and minimum values. The bias-corrected historical temperature data demonstrate a strong alignment with observed values during the base period. The seasonal variations and monthly averages of both maximum and minimum temperatures show high consistency, confirming the effectiveness of the bias correction procedure applied to the RCP projections.
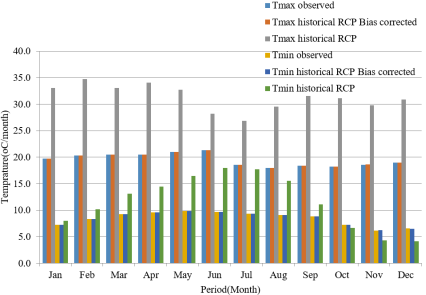
Figure 5. Comparison of monthly average maximum and minimum temperatures during the base period for bias correction at Jemma Watershed.
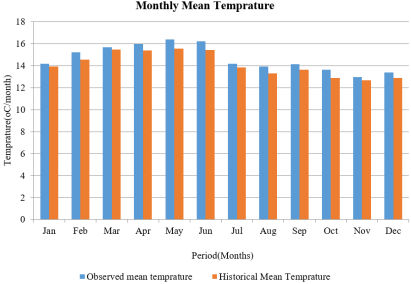
Figure 6. Comparison of observed and historical RCP mean monthly temperature during the base period.
III. Potential Evapotranspiration
The comparison of monthly average PET from observed and historical RCP datasets for the base period (1991-2010) reveals a correlation coefficient of 0.91, indicating a very strong relationship (Figure 7). The seasonal trend and monthly PET values from the bias-corrected RCP data closely mirror the observed records, reinforcing their suitability for hydrological and agricultural applications in the study area.
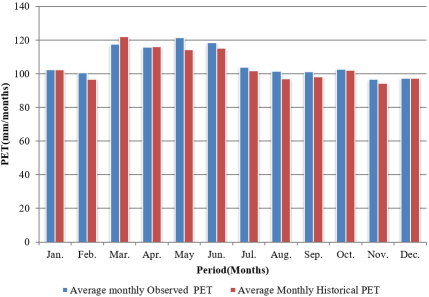
Figure 7. Observed vs. historical RCP monthly average potential evapotranspiration during the base period (1991-2010).
3.3. Projected Future Climate Variables Based on RCP Scenarios
To assess future climate trends, the time horizon was divided into three future periods of 20 years each: the 2030s (2021-2040), 2060s (2051-2070), and 2090s (2081-2100). The period 1991-2010 was selected as the reference (baseline) period.
3.3.1. RCP2.6 (Low Emissions Scenario)
I. Rainfall
Belg and Bega seasons show consistent increases in all future periods, with the highest increase of +161.58% in Bega during the 2090s. Kiremt season exhibits a slight increase in the 2030s (+4.12%) but declines in the 2060s (-6.20%) and more sharply in the 2090s (-22.53%). Annual rainfall also shows an overall increasing pattern, peaking at +17.63% in the 2060s.
Table 3. Percentage change in seasonal rainfall under RCP2.6 compared to the baseline (1991-2010).

S.NO

Watershed

Season

2030s (%)

2060s (%)

2090s (%)

1

Study Area

Belg

23.84%

81.27%

82.81%

Kiremt

4.12%

-6.20%

-22.53%

Bega

25.95%

137.29%

161.58%

Annual

8.99%

17.63%

6.71%

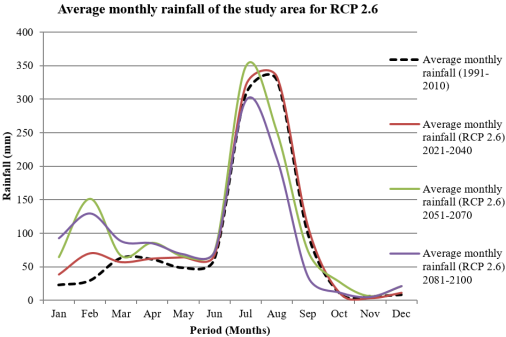
Figure 8. Mean monthly rainfall for the baseline and future periods under RCP2.6.
II. Potential Evapotranspiration (PET)
Projected PET under RCP2.6 shows variable seasonal responses across future periods (Table 4, Figure 9): A decline in PET during Belg is observed for all future periods, with the most significant decrease of -13.81% in the 2090s (February). Kiremt PET increases throughout the future periods, reaching a maximum rise of +13.02% by the 2090s. Bega and annual PET exhibit smaller and mixed changes.
Table 4. Percentage change in seasonal PET under RCP2.6 compared to the baseline (1991-2010).

S.NO

Watershed

Season

2030s (%)

2060s (%)

2090s (%)

1

Study Area

Belg

-0.98

-8.77

-13.81

Kiremt

0.05

6.98

13.02

Bega

1.88

-0.47

2.50

Annual

0.26

-0.99

0.12

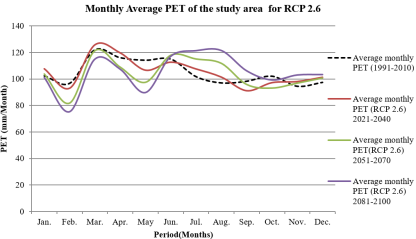
Figure 9. Monthly average PET during baseline and future periods under RCP2.6.
III. Temperature
As depicted in Figure 10, mean monthly temperatures under RCP2.6 increase in nearly all months, except for slight declines observed in June, September, and October in certain periods. The largest increases occur in the 2060s and 2090s.
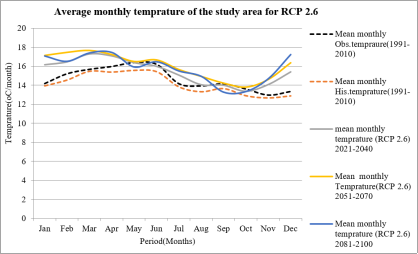
Figure 10. Monthly average temperature during baseline and future periods under RCP2.6.
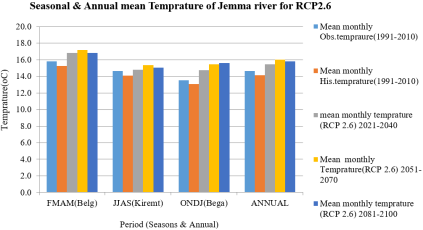
Figure 11. Average seasonal and annual mean temperatures for the Jemma River under RCP2.6.
The seasonal and annual mean temperatures (Figures 11 and 12) also exhibit a consistent upward trend across all future periods and seasons: The highest seasonal increase is observed during Belg, with temperature rises reaching +2.4°C in the 2060s and +2.5°C in the 2090s. The lowest increase is noted during Kiremt in the 2030s (+0.7°C).
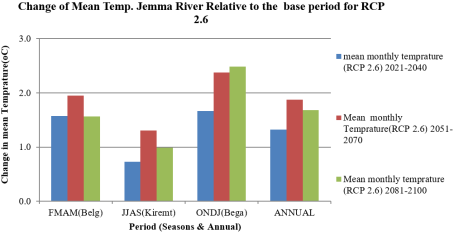
Figure 12. Changes in seasonal and annual mean temperatures from the baseline under RCP2.6.
3.3.2. RCP4.5 (Medium to High Emission Scenario)
I. Rainfall
Under the RCP4.5 scenarios, seasonal, annual, and monthly precipitation projections indicate an overall increase compared to the base period during Belg and Bega seasons (Table 5 and Figure 13). The most significant rise is projected for the Bega season (low-flow period), with a peak increase of +204.16% by the 2090s, while the Kiremt season (high-flow period) shows a decline, reaching -15.05% by the 2090s. Monthly rainfall trends similarly reflect increases across all future periods (2030s, 2060s, and 2090s) during Belg and Bega months.
Table 5. Percentage Change in Seasonal Rainfall Compared to the Baseline Period under RCP4.5.

S.NO

Watershed

Seasons

2021-2040 (%)

2051-2070 (%)

2081-2100 (%)

1

Study Area

Belg

28.86

85.42

72.84

Kiremt

-1.96

-6.31

-15.05

Bega

37.53

54.31

204.16

Annual

5.91

14.37

12.49

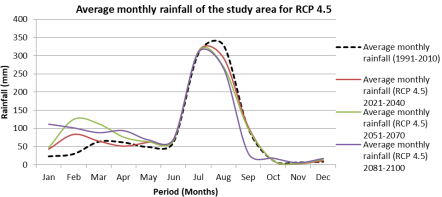
Figure 13. Monthly Average Rainfall for the Baseline and Future Periods under RCP4.5.
II. Potential Evapotranspiration
Figure 14 and Table 6 show that potential evapotranspiration (PET) under the RCP4.5 scenarios is projected to increase during the Kiremt, Bega, and Annual periods across the future timeframes. The highest increase is observed in Kiremt during the 2090s, with an estimated change of +11.00%. However, Belg season PET is projected to decline throughout the future periods, with the maximum decrease of -11.05% occurring in the 2090s.
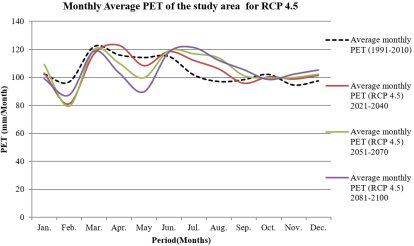
Figure 14. Monthly Average PET for the Baseline and Future Periods under RCP4.5.
Table 6. Percentage Change in Seasonal PET Compared to the Baseline Period under RCP4.5.

S.NO

Watershed

Seasons

2021-2040 (%)

2051-2070 (%)

2081-2100 (%)

1

Study Area

Belg

-4.49

-8.79

-11.05

Kiremt

4.88

9.56

11.00

Bega

1.75

3.79

2.24

Annual

0.55

1.19

0.36

III. Temperature
As shown in Figure 15, mean monthly temperatures are projected to rise across all months and future timeframes under RCP4.5, except for a slight dip observed in October. The highest increases are projected to occur during the 2090s.
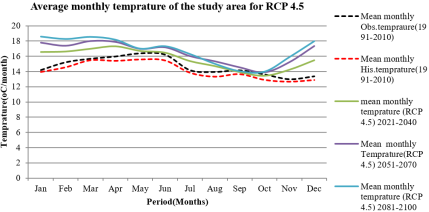
Figure 15. Monthly Average Temperature for the Baseline and Future Periods under RCP4.5.
Figure 16 illustrates seasonal and annual temperature changes for the Jemma River Basin. An upward trend is evident in all seasons, with Belg exhibiting the most pronounced warming by the 2090s.
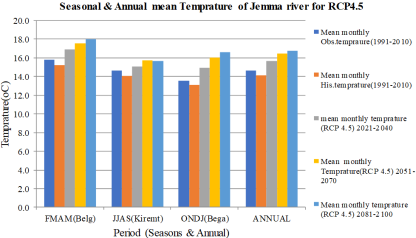
Figure 16. Seasonal and Annual Mean Temperatures for the Jemma River Basin under RCP4.5.
Figure 17 further confirms that temperature increases are consistent across all seasons and annual averages, with significant warming in the Bega season of up to +3.5°C in the 2090s. The lowest increase is observed in Kiremt during the 2030s, at +1.1°C.
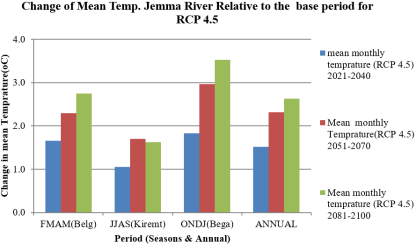
Figure 17. Projected Seasonal and Annual Temperature Change for the Jemma River Basin under RCP4.5.
3.3.3. RCP8.5 (High Emission Scenario)
I. Rainfall
Under the high-emission scenario RCP8.5, the projected mean seasonal, annual, and monthly precipitation shows an increasing trend across all future time periods (2030s, 2060s, and 2090s) when compared with the baseline period, as illustrated in Figure 18 and Table 7. Average annual rainfall is expected to increase by approximately +13.87%, +26.31%, and +44.49% in the 2030s, 2060s, and 2090s, respectively. The seasonal analysis indicates that all seasons (Belg, Kiremt, and Bega) will experience increases in precipitation, with the most significant rise projected for the Bega (dry) season. Monthly average rainfall is also projected to increase consistently throughout all months of the year during the future periods.
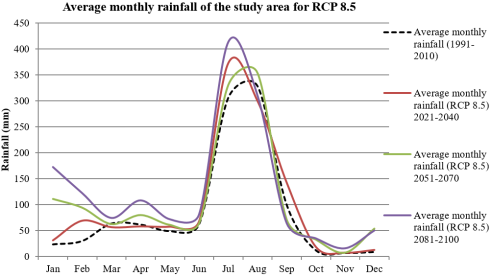
Figure 18. Monthly average rainfall for the baseline and future periods under RCP8.5.
Table 7. Percentage change in seasonal and annual rainfall relative to the baseline under RCP8.5.

S.NO

Watershed

Seasons

2021-2040 (%)

2051-2070 (%)

2081-2100 (%)

1

Study Area

Belg

19.00

46.99

84.81

Kiremt

10.88

3.05

8.98

Bega

40.48

310.55

443.27

Annual

13.87

26.31

44.49

II. Potential Evapotranspiration
As shown in Figure 19 and Table 8, projected changes in potential evapotranspiration (PET) under RCP8.5 indicate a decreasing trend during the Belg and Bega seasons for all future periods. In contrast, an increasing trend is observed for the Kiremt season during the 2060s and 2090s. The most substantial increase in PET is recorded during the Kiremt season of the 2090s, with a change of +12.40%. On an annual scale, PET changes remain relatively modest, with minor fluctuations across the periods.
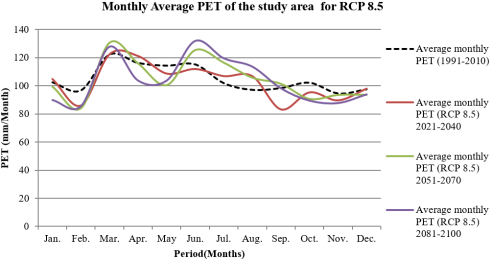
Figure 19. Monthly average PET for the baseline and future periods under RCP8.5.
Table 8. Percentage change in seasonal and annual PET compared to the baseline under RCP8.5.

S.NO

Watershed

Seasons

2021-2040 (%)

2051-2070 (%)

2081-2100 (%)

1

Study Area

Belg

-2.30

-4.00

-6.30

Kiremt

-0.67

8.99

12.40

Bega

-2.04

-4.87

-8.94

Annual

-1.68

-0.02

-1.01

III. Temperature
As shown in Figure 20, the mean monthly temperature is projected to rise across all months under RCP8.5, with the largest increases occurring in the 2090s. Seasonal and annual average temperatures (Figures 21 and 22) also exhibit consistent warming trends throughout the projection periods. The greatest increases are observed during the Bega (dry) and Belg (short rainy) seasons in the 2090s.
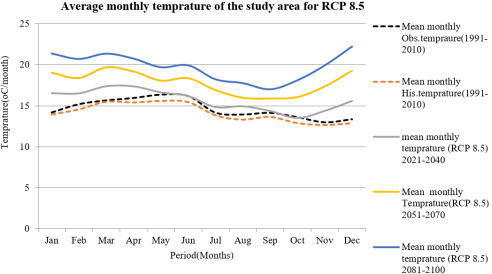
Figure 20. Monthly average temperature for the baseline and future periods under RCP8.5.
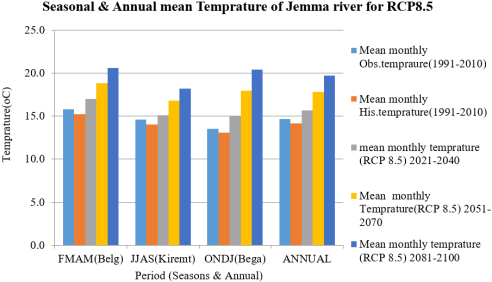
Figure 21. Average seasonal and annual temperature of the Jemma River Basin under RCP8.5.
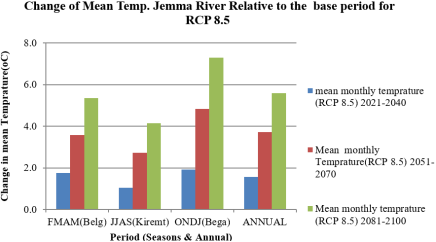
Figure 22. Seasonal and annual temperature change relative to the baseline under RCP8.5.
Overall, temperature under RCP8.5 is expected to rise more substantially compared to the lower emission scenarios (RCP2.6 and RCP4.5). The maximum projected temperature increase is observed during the Bega season, reaching approximately +4.83°C in the 2060s and +7.29°C in the 2090s. The smallest increase occurs during the Kiremt season in the 2030s, with a change of +1.04°C.
3.4. Impact of Climate Change on Water Resource Availability
River streamflow is primarily governed by the amount of rainfall received within the watershed and the rate of actual evapotranspiration . Consequently, changes in precipitation and temperature due to climate change can significantly alter river discharge patterns. For the Jemma River, the projected impacts of climate change on flow regimes were analyzed using daily, monthly, seasonal, and annual rainfall and evaporation trends under different Representative Concentration Pathway (RCP) scenarios.
Figure 23 below presents a comparison of observed, calibrated, and historical streamflow data (RCP historical scenario) for the baseline period (1991-2010), demonstrating a good fit among the datasets.
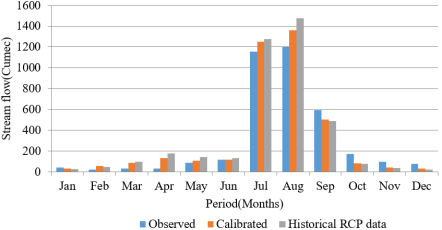
Figure 23. Average Monthly Observed, Calibrated, and Historical RCP Streamflow (1991-2010).
Impact of Climate Change on Monthly, Seasonal, and Annual Stream Flow:
To assess the influence of climate change on future streamflow, the baseline period (1991-2010) was compared with three future periods (2030s, 2060s, and 2090s) under RCP2.6, RCP4.5, and RCP8.5 scenarios. The following sections present the analysis results for each scenario.
3.4.1. Flow Analysis Under RCP2.6 (Low Emission Scenario)
Figures 24 and 25 show projected monthly streamflow changes under RCP2.6. Results indicate an increasing trend in river flow from January to March across the future periods. Conversely, a declining trend is observed from June to December, with a few exceptions: August to October in the 2030s, April, July, October, and November in the 2060s, and May and December in the 2090s.
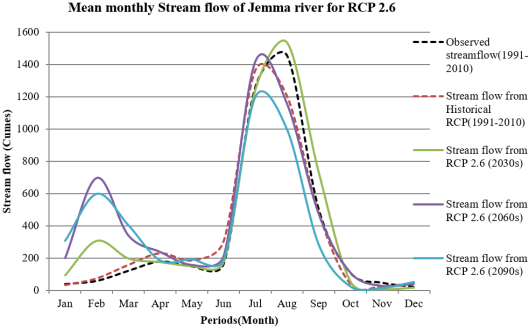
Figure 24. Average Monthly Streamflow (Baseline vs. RCP2.6).
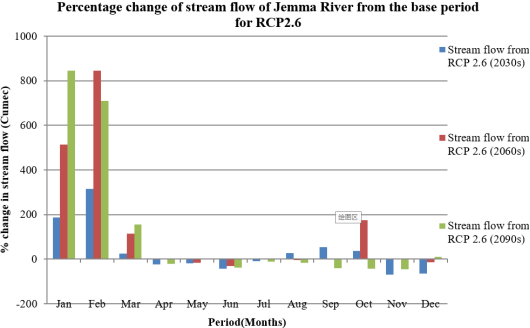
Figure 25. Monthly Percentage Change in Streamflow under RCP2.6 (relative to baseline).
Seasonal and Annual Flow Analysis under RCP2.6:
The Jemma River basin experiences three distinct seasons: Belg (short rainy season), Kiremt (main rainy/cropping season) and Bega (dry season). Figure 26 illustrates average seasonal and annual flow projections, while Figure 27 shows the percentage changes compared to the baseline. The most pronounced increase occurs in Bega (dry season), with streamflow increasing by up to +175.05% in the 2090s. Belg flow also rises significantly (+120.89%), while Kiremt shows modest variability: a slight increase in the 2030s (+10.17%) and a decrease in the 2090s (-20.33%). The annual flow is projected to increase by +13.32% in the 2030s, +22.35% in the 2060s, and +7.24% in the 2090s.
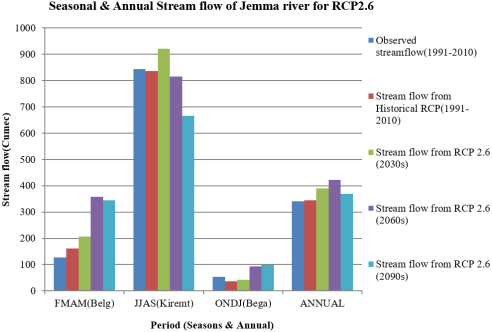
Figure 26. Average Seasonal and Annual Streamflow under RCP2.6.
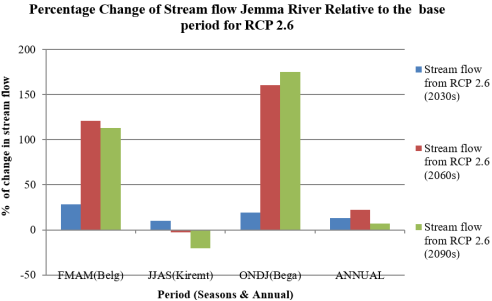
Figure 27. Percentage Change in Seasonal and Annual Flow (RCP2.6 vs. Baseline).
3.4.2. Flow Analysis Under RCP4.5 (Intermediate Emission Scenario)
Figures 28 and 29 reveal changes in monthly streamflow under RCP4.5. Kiremt and Bega seasons exhibit decreasing trends in most months, with the exception of September, which shows increases of +43% and +40.4% in the 2030s and 2060s, respectively. In contrast, all Belg season months’ exhibit increased flow in all future periods, with a peak increase of +982% in January 2090s. The largest decrease occurs in December 2030s (-68.92%).
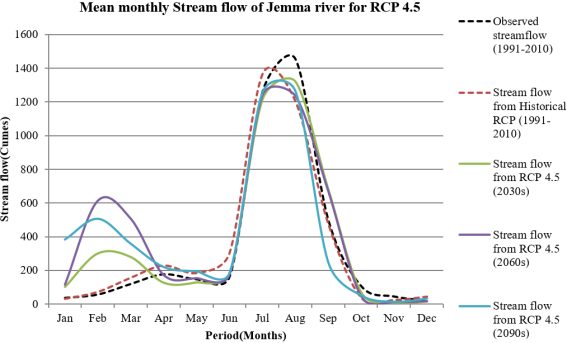
Figure 28. Average Monthly Streamflow (Baseline vs. RCP4.5).
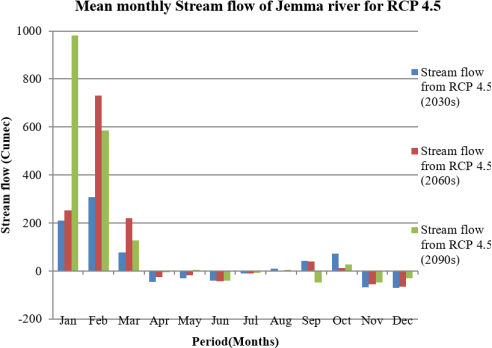
Figure 29. Monthly Percentage Change in Streamflow under RCP4.5.
Seasonal and Annual Flow Analysis under RCP4.5:
Figures 30 and 31 present seasonal and annual streamflow variations under RCP4.5. The Belg season exhibits the highest increase, reaching +123.06% in the 2060s. Bega shows a notable rise in the 2090s (+234.73%), while Kiremt displays only slight increases in the 2030s (+1.53%) but decreases in later periods.
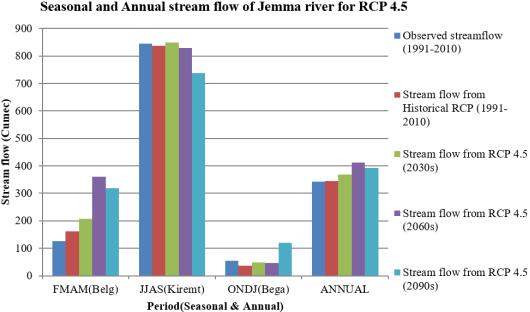
Figure 30. Average Seasonal and Annual Streamflow under RCP4.5.
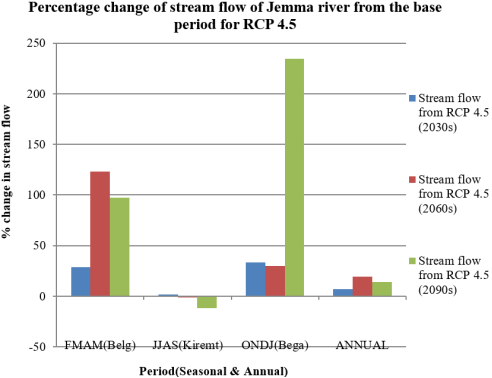
Figure 31. Percentage Change in Seasonal and Annual Flow (RCP4.5 vs. Baseline).
3.4.3. Flow Analysis Result for RCP8.5 (High Emission Scenario)
Figures 32 and 33 show monthly flow projections under RCP8.5. A significant increase in streamflow is projected during the Belg season for all future periods, with exceptions in April and May of the 2030s. Overall, the trend indicates increased flow in most months compared to the baseline.
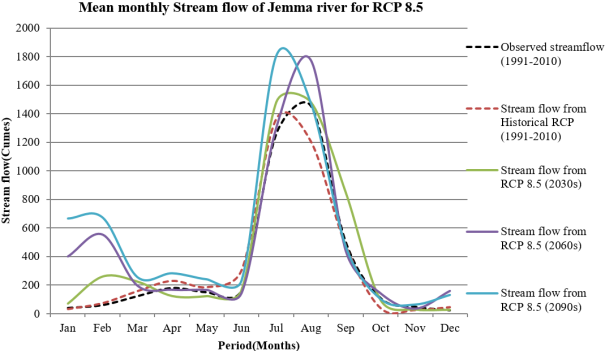
Figure 32. Average Monthly Streamflow (Baseline vs. RCP8.5).
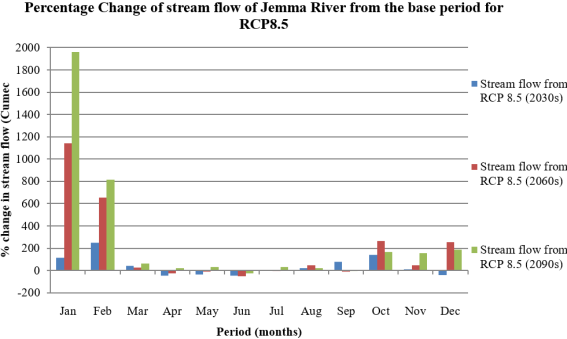
Figure 33. Monthly Percentage Change in Streamflow under RCP8.5.
Seasonal and Annual Flow Analysis under RCP8.5:
Figures 34 and 35 highlight seasonal and annual flow projections under the high-emission scenario. The largest increase is projected for Bega in the 2090s (+577.4%), while the smallest increase is expected during Kiremt in the 2060s (+9.45%). All seasons show a positive trend in future flow volumes.
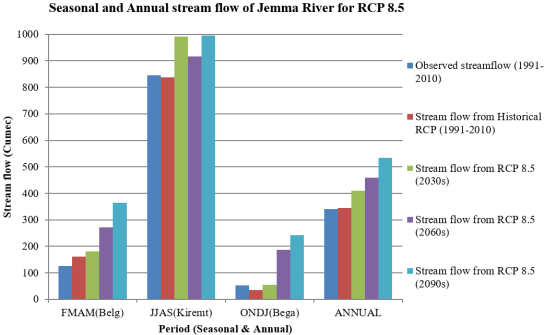
Figure 34. Average Seasonal and Annual Streamflow under RCP8.5.
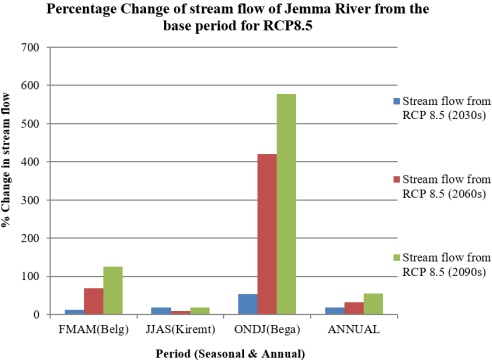
Figure 35. Percentage Change in Seasonal and Annual Flow (RCP8.5 vs. Baseline).
3.5. Sensitivity of Future Streamflow to Climate Change
The sensitivity of streamflow refers to the rate at which water availability responds to changes in climate variables, particularly precipitation (PCP) and potential evapotranspiration (PET) . In this study, future changes in simulated streamflow were assessed in relation to projected changes in rainfall and PET. The goal was to determine which climate variable exerts a greater influence on streamflow variability. Figures 36-38 illustrate the percentage changes in annual streamflow, precipitation, and PET relative to the baseline period for each RCP scenario across three future time horizons (2030s, 2060s, and 2090s). The results indicate that simulated streamflow is considerably more sensitive to variations in both rainfall and PET under all scenarios. However, the magnitude and direction of sensitivity differ across RCPs and time periods, reflecting the complexity of hydrological responses to climatic changes.
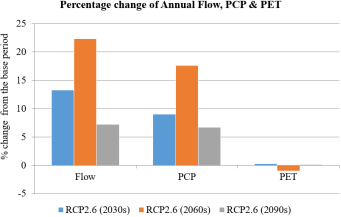
Figure 36. Percentage change in annual flow, PCP, and PET relative to the baseline under RCP2.6 (2030s, 2060s, 2090s).
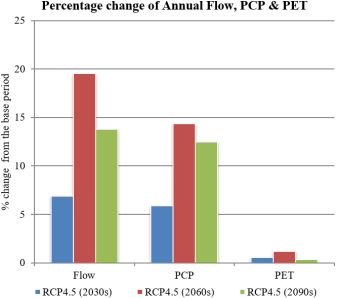
Figure 37. Percentage change in annual flow, PCP, and PET relative to the baseline under RCP4.5 (2030s, 2060s, 2090s).
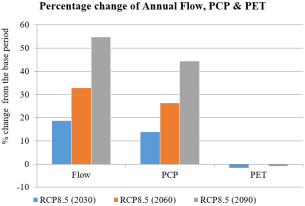
Figure 38. Percentage change in annual flow, PCP, and PET relative to the baseline under RCP8.5 (2030s, 2060s, 2090s).
3.6. Significance and Uncertainty of Climate Change Impacts on Future Streamflow
To evaluate the statistical significance of climate change impacts on streamflow, projected flow values were compared to the uncertainty bands derived from model simulations for each RCP scenario. For RCP2.6, as shown in Figure 39, streamflow in the Belg season shows a statistically significant change across all future periods, primarily driven by changes in rainfall and PET. However, for the Kiremt and Bega seasons, as well as annual flow, future projections largely fall within the uncertainty range, indicating that the impact of climate change may be statistically insignificant for these periods.
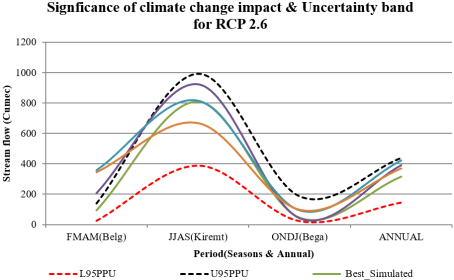
Figure 39. Projected seasonal and annual streamflow with uncertainty bands under RCP2.6.
In the case of RCP4.5, the results presented in Figure 40 suggest that Belg season flows are significantly impacted by climate change throughout the projection periods. On the other hand, Kiremt, Bega, and annual flows remain within the uncertainty bounds, indicating no significant departure from baseline conditions under the assumptions and methodologies employed in this study.
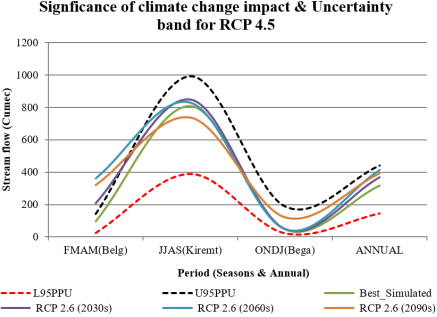
Figure 40. Projected seasonal and annual streamflow with uncertainty bands under RCP4.5.
For RCP8.5, the most extreme emission scenario, Figure 41 shows significant increases in Belg season flow across all future periods, as well as in annual flow during the 2060s and 2090s. The Bega and Kiremt seasons also exhibit significant changes by the 2090s. However, projected streamflow for the 2030s and parts of the 2060s in Kiremt, Bega, and annual periods are within the uncertainty ranges, suggesting limited statistical significance during these time frames.
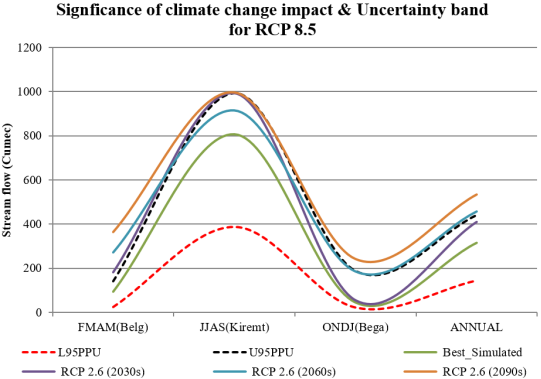
Figure 41. Projected seasonal and annual streamflow with uncertainty bands under RCP8.5.
4. Conclusion and Recommendations
4.1. Conclusion
Climate change has the potential to significantly alter future hydrological and meteorological conditions due to increased greenhouse gas emissions. Based on the analysis of projected streamflow under various climate scenarios (RCP2.6, RCP4.5, and RCP8.5), the study reveals an increase in mean annual streamflow during the Belg season and a decrease during the Kiremt season. Monthly streamflow projections also indicate increased flows during Belg and reductions during Kiremt and Bega seasons across all scenarios. Given that peak flows in the study area typically occur during Kiremt, the projected reduction suggests a potential negative impact of climate change on water availability in the basin.
Projected precipitation is expected to increase during the Belg season and decrease during the Kiremt season across all RCP scenarios. Potential evapotranspiration (PET) is projected to increase during the Kiremt season and decrease during the Belg season compared to the baseline period. The results indicate an increase in streamflow during the Belg season and a decrease during the Kiremt season under all scenarios. These changes are closely aligned with projected trends in rainfall and PET. Temperature is projected to increase consistently across all RCPs for the 2030s, 2060s, and 2090s when compared to the baseline period. Simulated streamflow shows a strong correlation with projected precipitation under all scenarios. Increased precipitation generally leads to higher streamflow, while changes in PET also significantly influence hydrological responses. This underscores the critical role of climate variables in shaping future water availability in the Jemma River Basin. The findings indicate that streamflow is particularly sensitive to changes in rainfall and PET across all climate scenarios. Therefore, based on the applied assumptions and methodologies, it is concluded that climate change will have a notable impact on future flow volumes in the Jemma River Basin.
4.2. Recommendations and Future Research Needs
Increased water availability, particularly during the Belg season, could provide opportunities for enhancing small- and large-scale irrigation activities. The rise in runoff volumes may support the sustainability of ongoing and future water infrastructure projects. Given that this study involved several models, each with inherent uncertainties, the results should be interpreted as indicative trends rather than precise forecasts. Future studies should expand the scope by incorporating additional climate and geophysical variables beyond precipitation and temperature. Moreover, the socio-economic implications of climate change impacts on water-dependent sectors warrant thorough investigation. Climate change may enhance water availability for smallholder farmers during certain seasons. However, realizing these benefits depends on farmers’ capacity to adjust cropping calendars accordingly. Therefore, mitigation and adaptation strategies should be developed to address potential risks such as flooding in lowland areas. The findings provide valuable insights into the hydrological response of the basin under changing climatic conditions. These insights are essential for planners, decision-makers, and stakeholders involved in designing adaptive water management policies and climate-resilient development strategies. The SWAT hydrological model demonstrated robustness in simulating climate change impacts in the study area. Future researchers are encouraged to apply SWAT, particularly in climate and water resource studies. This study was based on a single Global Climate Model (GCM). To improve reliability and explore a broader range of scenarios, future research should incorporate multiple GCMs. This would enhance comparative analysis and better capture uncertainties associated with climate projections.
Abbreviations

CanESM2

Second Generation Canadian Earth System Model

CMIP5

Coupled Model Intercomparison Project Phase 5

CMhyd

Climate Model Data for Hydrologic Modeling tool

CN2

Curve Number

CUP

Calibration and Uncertainty Program

DEM

Digital Elevation Model

EMI

Ethiopian Meteorology Institute

GCM

Global Climate Models

GCMs

General Circulation Models

HRU

Hydraulic Reponses Units

IPCC

The Intergovernmental Panel on Climate Change

MoWIE

Ministry of Water Irrigation & Electricity

PCP

Precipitation

PET

Potential Evapotranspiration

RCPs

Representative Concentration Pathways (RCPs)

RCP

Representative Concentration Pathway

SRES

Special Report on Emission Scenario

SRTM

Shutter Radar Topography Mission

SUFI-2

Sequential Uncertainty Fitting Version-2

SWAT

Soil and Water Assessment Tool

Acknowledgments
Supported by the Ethiopian Roads Authority. Thanks to Dr. Brook Abate and data providers (EMI, MoWIE).
Author Contributions
Yimer Assefa Yimam: Conceptualization, Data curation, Formal Analysis, Investigation, Methodology, Resources, Software, Validation, Visualization, Writing - original draft, Writing - review & editing
Brook Abate: Investigation, Supervision
Funding
This research was financially supported by the Ethiopian Roads Authority.
Data Availability Statement
Data available upon request (yimera649@gmail.com).
Conflicts of Interest
The authors declare no conflicts of interest.
References
[1] Ayele, H. S., Li, M.-H., Tung, C.-P., & Liu, T.-M. (2016). Impact of climate change on runoff in the Gilgel Abbay watershed, the upper Blue Nile Basin, Ethiopia. Water, *8*(9), 380.
[2] Bewket, W. (2012). Climate change perceptions and adaptive responses of smallholder farmers in central highlands of Ethiopia. International Journal of Environmental Studies, *69*(3), 507-523.
[3] Beg, N., Morlot, J. C., Davidson, O., Afrane-Okesse, Y., Tyani, L., Denton, F. & Parikh, J. K. (2011). Linkages between climate change and sustainable development. Climate Policy, 2(2-3), 129-144.
[4] Conway, D., Hulme, M., & Magadza, C. H. (1993). Sensitivity of runoff and soil moisture to climate change in East Africa. Journal of Hydrology, *154*(1-4), 1-20.
[5] Dagnet, Y. A., & Markus, J. (2016). Mainstreaming climate resilience into development planning: A case study from Ethiopia. Environmental Management, 58(5), 919-930.
[6] Dai, A. (2011). Drought under global warming: A review. Wiley Interdisciplinary Reviews: Climate Change, *2*(1), 45-65.
[7] Dibike, Y. B., & Coulibaly, P. (2005). Hydrologic impact of climate change in the Saguenay watershed: Comparison of downscaling methods and hydrologic models. Journal of Hydrology, *307*(1-4), 145-163.
[8] Fentaw, F., Melesse, A. M., & Mamo, G. (2018). Climate change impact on the hydrology of Tekeze Basin, Ethiopia: Projection of rainfall-runoff for future water resources planning. Water Conservation Science and Engineering, *3*(4), 267-278.
[9] Gebreluel, Goitom. "Ethiopia's Grand Renaissance Dam: ending Africa's oldest geopolitical rivalry?." The Washington Quarterly 37.2 (2014): 25-37.
[10] Haile, Tesfaye. "Causes and Characteristics of Drought in Ethiopia." Ethiopian Journal of Agricultural Sciences (1988).
[11] Hailemariam, K. (1999). Impact of climate change on the water resources of Awash River Basin, Ethiopia. Climate Research, *12*(2-3), 91-96.
[12] Huq, Saleemul, et al. "Mainstreaming adaptation to climate change in least developed countries (LDCs)." Climate Policy 4.1 (2004): 25-43.
[13] Hu, Z., Islam, S., & Gao, X. (2013). Climate change impact assessment on hydrological extreme events in the Northeast United States. Journal of Hydrology, 492, 273-285.
[14] (IPCC, 2013). Climate change 2013: The physical science basis. Contribution of Working Group I to the Fifth Assessment Report of the Intergovernmental Panel on Climate Change. Cambridge University Press.
[15] Kim, Byung-Sik, et al. "Impact assessment of climate change on extreme rainfall and IDF analysis." Journal of Korea Water Resources Association 41.4 (2008): 379-394.
[16] Korecha, Diriba, and Anthony G. Barnston. "Predictability of June-September rainfall in Ethiopia." Monthly weather review 135.2 (2007): 628-650.
[17] Mengistu, D. T., & Sorteberg, A. (2012). Sensitivity of SWAT simulated streamflow to climatic changes within the Eastern Nile River Basin. Hydrology and Earth System Sciences, *16*(2), 391-407.
[18] Muluneh, B. Evaluation of Impact of Climate Change on Water Resource Availability in the Catchments of Blue Nile Basin. Diss. MSC Thesis degree at Arba Minch university, 2008.
[19] Min, S. K., Zhang, X., Zwiers, F. W., & Hegerl, G. C. (2011). Human contribution to more-intense precipitation extremes. Nature, 470(7334), 378-381.
[20] NMSA. (2001). Initial National communication of Ethiopia to the United Nations Framework Convention on climate Change (UNFCCC). National Meteorological Services Agency, Addis Ababa.
[21] Salathé Jr, Eric P. "Comparison of various precipitation downscaling methods for the simulation of streamflow in a rain shadow river basin." International Journal of Climatology: A Journal of the Royal Meteorological Society 23.8 (2003): 887-901.
[22] Santhi, C., et al. "Validation of the swat model on a large river basin with point and nonpoint sources 1." JAWRA Journal of the American Water Resources Association 37.5 (2001): 1169-1188.
[23] Setegn, S. G., Rayner, D., Melesse, A. M., Dargahi, B., & Srinivasan, R. (2011). Impact of climate change on the hydroclimatology of Lake Tana Basin, Ethiopia. Water Resources Research, *47*(4), W04511.
[24] Shaka, Abdo Kedir. "Assessment of climate change impacts on the hydrology of gilgel abay catchment in lake tana basin, Ethiopia." ITC, 2008.
[25] Teutschbein, C., & Seibert, J. (2012). Bias correction of regional climate model simulations for hydrological climate-change impact studies: Review and evaluation of different methods. Journal of Hydrology, *456-457*, 12-29.
[26] Van Vuuren, Detlef P., et al. "A special issue on the RCPs." Climatic Change 109. 1-2 (2011): 1.
Cite This Article
  • APA Style

    Yimam, Y. A., Abate, B. (2025). Climate Change Impacts on Hydrology of Jemma River Sub Basin, Upper Blue Nile, Ethiopia. Hydrology, 13(3), 174-199. https://doi.org/10.11648/j.hyd.20251303.11

    Copy | Download

    ACS Style

    Yimam, Y. A.; Abate, B. Climate Change Impacts on Hydrology of Jemma River Sub Basin, Upper Blue Nile, Ethiopia. Hydrology. 2025, 13(3), 174-199. doi: 10.11648/j.hyd.20251303.11

    Copy | Download

    AMA Style

    Yimam YA, Abate B. Climate Change Impacts on Hydrology of Jemma River Sub Basin, Upper Blue Nile, Ethiopia. Hydrology. 2025;13(3):174-199. doi: 10.11648/j.hyd.20251303.11

    Copy | Download

  • @article{10.11648/j.hyd.20251303.11,
      author = {Yimer Assefa Yimam and Brook Abate},
      title = {Climate Change Impacts on Hydrology of Jemma River Sub Basin, Upper Blue Nile, Ethiopia
    },
      journal = {Hydrology},
      volume = {13},
      number = {3},
      pages = {174-199},
      doi = {10.11648/j.hyd.20251303.11},
      url = {https://doi.org/10.11648/j.hyd.20251303.11},
      eprint = {https://article.sciencepublishinggroup.com/pdf/10.11648.j.hyd.20251303.11},
      abstract = {Understanding the potential impacts of climate change on hydrological processes and water resources at regional and local scales is essential for developing effective adaptation strategies. This study evaluates the projected effects of climate change on the Jemma River Basin, located in the Upper Blue Nile region of Ethiopia, using future climate data derived from the second-generation Canadian Earth System Model (CanESM2) under three Representative Concentration Pathways (RCP2.6, RCP4.5, and RCP8.5). The climate projections were downscaled and bias-corrected at the catchment level using observed station data from within the basin. Hydrological modelling was conducted using the Soil and Water Assessment Tool (SWAT), while model calibration and validation were carried out with the SUFI2 algorithm in the SWAT-CUP framework. The calibration phase produced performance metrics of R² = 0.83 and NSE = 0.69, while validation results were R² = 0.84 and NSE = 0.71 for monthly streamflow simulations. To evaluate future climate-induced changes, percentage variations in precipitation, potential evapotranspiration (PET), streamflow, and temperature were analyzed for three future periods 2030s (2021-2040), 2060s (2051-2070), and 2090s (2081-2100) relative to the baseline period (1991-2010). Under RCP2.6, annual, seasonal, and monthly rainfall is generally projected to increase, except during the Kiremt (JJAS) season in the 2060s and 2090s. For RCP4.5 and RCP8.5, rainfall is expected to increase consistently across all future periods. PET projections under RCP2.6 suggest increases during Kiremt and Bega (ONDJ) but declines during Belg (FMAM). In contrast, PET is projected to rise annually and during Bega and Belg seasons under RCP4.5, with a decrease during Kiremt. For RCP8.5, PET is expected to decrease on an annual basis and during Bega and Belg, but increase in Kiremt. Temperature projections indicate a consistent upward trend across all scenarios and timeframes. Regarding streamflow, results show an increase during Belg, whereas annual, Kiremt, and Bega flows are projected to decline under all RCP scenarios and future periods. These findings highlight that the Jemma River's future flow regime is likely to be significantly influenced by climate change. Sensitivity analysis further demonstrated that projected streamflow is more responsive to variations in rainfall than to changes in PET or temperature across all scenarios.},
     year = {2025}
    }
    

    Copy | Download

  • TY  - JOUR
    T1  - Climate Change Impacts on Hydrology of Jemma River Sub Basin, Upper Blue Nile, Ethiopia
    
    AU  - Yimer Assefa Yimam
    AU  - Brook Abate
    Y1  - 2025/07/19
    PY  - 2025
    N1  - https://doi.org/10.11648/j.hyd.20251303.11
    DO  - 10.11648/j.hyd.20251303.11
    T2  - Hydrology
    JF  - Hydrology
    JO  - Hydrology
    SP  - 174
    EP  - 199
    PB  - Science Publishing Group
    SN  - 2330-7617
    UR  - https://doi.org/10.11648/j.hyd.20251303.11
    AB  - Understanding the potential impacts of climate change on hydrological processes and water resources at regional and local scales is essential for developing effective adaptation strategies. This study evaluates the projected effects of climate change on the Jemma River Basin, located in the Upper Blue Nile region of Ethiopia, using future climate data derived from the second-generation Canadian Earth System Model (CanESM2) under three Representative Concentration Pathways (RCP2.6, RCP4.5, and RCP8.5). The climate projections were downscaled and bias-corrected at the catchment level using observed station data from within the basin. Hydrological modelling was conducted using the Soil and Water Assessment Tool (SWAT), while model calibration and validation were carried out with the SUFI2 algorithm in the SWAT-CUP framework. The calibration phase produced performance metrics of R² = 0.83 and NSE = 0.69, while validation results were R² = 0.84 and NSE = 0.71 for monthly streamflow simulations. To evaluate future climate-induced changes, percentage variations in precipitation, potential evapotranspiration (PET), streamflow, and temperature were analyzed for three future periods 2030s (2021-2040), 2060s (2051-2070), and 2090s (2081-2100) relative to the baseline period (1991-2010). Under RCP2.6, annual, seasonal, and monthly rainfall is generally projected to increase, except during the Kiremt (JJAS) season in the 2060s and 2090s. For RCP4.5 and RCP8.5, rainfall is expected to increase consistently across all future periods. PET projections under RCP2.6 suggest increases during Kiremt and Bega (ONDJ) but declines during Belg (FMAM). In contrast, PET is projected to rise annually and during Bega and Belg seasons under RCP4.5, with a decrease during Kiremt. For RCP8.5, PET is expected to decrease on an annual basis and during Bega and Belg, but increase in Kiremt. Temperature projections indicate a consistent upward trend across all scenarios and timeframes. Regarding streamflow, results show an increase during Belg, whereas annual, Kiremt, and Bega flows are projected to decline under all RCP scenarios and future periods. These findings highlight that the Jemma River's future flow regime is likely to be significantly influenced by climate change. Sensitivity analysis further demonstrated that projected streamflow is more responsive to variations in rainfall than to changes in PET or temperature across all scenarios.
    VL  - 13
    IS  - 3
    ER  - 

    Copy | Download

Author Information
  • Abstract
  • Keywords
  • Document Sections

    1. 1. Introduction
    2. 2. Data and Methodology
    3. 3. Results and Discussion
    4. 4. Conclusion and Recommendations
    Show Full Outline
  • Abbreviations
  • Acknowledgments
  • Author Contributions
  • Funding
  • Data Availability Statement
  • Conflicts of Interest
  • References
  • Cite This Article
  • Author Information