Abstract
Introduction. In resource-limited countries, the performance of health-commodity supply chains is a critical determinant of access to care. Despite the documented operational advantages of the PUSH logistics model (push-based flow), its comparative economic assessment against the traditional PULL model (pull-based flow) remains limited, depriving decision-makers of robust evidence for optimal investment choices. Methods. A retrospective differential cost-effectiveness analysis was conducted over six months in Couffo Department, Benin. Two comparable health zones applying respectively the PULL model (ADD zone) and the PUSH model (KTL zone) provided a quasi-experimental framework. Direct, indirect and opportunity logistics costs were micro-costed for 32 health centres. The primary outcome was measured by the availability rate of essential commodities. Incremental cost-effectiveness ratios (ICERs) were calculated, and sensitivity analyses tested the robustness of the results. Results. The PUSH model reduced total logistics costs by 87.8% compared with the PULL model, driven by substantial transport optimisation (a 77% reduction in cost per kilometre) and the near-elimination of economic losses associated with stock-outs (USD 7,333 saved). Concurrently, it improved product availability from 94.16% to 98.80%, shortened delivery lead times, and increased stakeholder satisfaction. The ICER for availability was negative (-USD 0.40 per percentage point gained), confirming that PUSH is a dominant strategy (less costly and more effective). This conclusion remained robust across all sensitivity-analysis scenarios. Conclusion. This study provides empirical evidence that the PUSH model is economically dominant over the PULL model in the Beninese context. Its large-scale deployment represents a high-return strategic investment, enabling optimal resource allocation to strengthen health-system resilience and progress towards universal health coverage.
Keywords
Cost-effectiveness Analysis, Health Supply Chain, PUSH and PULL Logistics Models, Health Systems Efficiency, Benin,
Health Commodities Availability, Logistics Optimization
1. Introduction
The performance of health-commodity supply chains is a critical determinant of health-system effectiveness, particularly in resource-limited settings where it directly conditions access to essential care
| [1] | Yadav P. Health product supply chains in developing countries: diagnosis of the root causes of underperformance and an agenda for reform. Health Syst Reform. 2015; 1(2): 142–154.
https://doi.org/10.4161/23288604.2014.968005 |
[1]
. In such contexts, recurrent stock-outs of medicines, vaccines and medical supplies not only disrupt continuity of care but also generate substantial costs in terms of avoidable morbidity and mortality and economic inefficiency
| [2] | Gray A, Manasse HR Jr. Shortages of medicines: a complex global challenge. Bull World Health Organ. 2012; 90(3): 158–158A. https://doi.org/10.2471/BLT.11.101303 |
| [3] | Cameron A, Roubos I, Ewen M, Mantel-Teeuwisse AK, Leufkens HG, Laing RO. Differences in the availability of medicines for chronic and acute conditions in the public and private sectors of developing countries. Bull World Health Organ. 2011; 89(6): 412–421.
https://doi.org/10.2471/BLT.10.084327 |
[2, 3]
. Optimising health logistics therefore represents a major strategic lever for achieving universal health coverage
| [4] | World Health Organization, United Nations Children’s Fund (UNICEF). Operational framework for primary health care: transforming vision into action. Geneva: WHO; UNICEF; 2020. |
[4]
.
In response to these challenges, two organisational paradigms primarily structure supply-chain management: the PULL model (pull-based flow), driven by demand expressed by health facilities, and the PUSH model (push-based flow), based on centralised planning and distribution according to forecasted needs
| [1] | Yadav P. Health product supply chains in developing countries: diagnosis of the root causes of underperformance and an agenda for reform. Health Syst Reform. 2015; 1(2): 142–154.
https://doi.org/10.4161/23288604.2014.968005 |
| [5] | USAID DELIVER Project. The logistics handbook: a practical guide for the supply chain management of health commodities. Arlington (VA): USAID DELIVER Project, Task Order 1; 2011. |
[1, 5]
. While the operational literature documents the advantages of the PUSH model in improving product availability and reducing stock-outs
| [6] | Daff BM, Seck C, Belkhayat H, Sutton P. Informed push distribution of contraceptives in Senegal reduces stockouts and improves quality of family planning services. Glob Health Sci Pract. 2014; 2(2): 245–252.
https://doi.org/10.9745/GHSP-D-13-00171 |
| [7] | Krug C, Cavallaro FL, Wong KLM, Gasparrini A, Faye A, et al. Evaluation of Senegal supply chain intervention on contraceptive stockouts using routine stock data. PLoS One. 2020; 15(8): e0236659. https://doi.org/10.1371/journal.pone.0236659 |
| [8] | Vledder M, Friedman J, Sjöblom M, Brown T, Yadav P. Improving supply chain for essential drugs in low-income countries: results from a large-scale randomized experiment in Zambia. Health Syst Reform. 2019; 5(2): 158–177.
https://doi.org/10.1080/23288604.2019.1596050 |
[6-8]
, comparative economic evidence remains limited and heterogeneous, despite the existence of cost and efficiency studies in sub-Saharan Africa
| [9] | Ruhago GM, Ngalesoni FN, Msasi D, Kengia JT, Mganga M, Kapologwe NA, et al. The public health sector supply chain costs in Tanzania. PLOS Glob Public Health. 2022; 2(11): e0000960. https://doi.org/10.1371/journal.pgph.0000960 |
| [10] | Thomas D, Motomoke E, Crawford J, Defawe O, Makaya A, Ngwato JW, et al. Optimized supply chain model reduces health system costs in the Democratic Republic of the Congo. Vaccine. 2021; 39(30): 4166–4172.
https://doi.org/10.1016/j.vaccine.2021.05.083 |
| [11] | Makkawi AME, Mousnad MA, Mohamed GK. Cost-Effectiveness Analysis of Supply Chain System: Sudan's National Medical Supplies Fund 2011-2014. Glob J Qual Saf Healthc. 2020 May 26; 3(2): 72-80.
https://doi.org/10.36401/JQSH-20-6. |
[9-11]
.
This gap persists even though health decision-makers, operating under extremely constrained budgets, have an imperative need for robust evidence on the cost-effectiveness of logistics investments
| [1] | Yadav P. Health product supply chains in developing countries: diagnosis of the root causes of underperformance and an agenda for reform. Health Syst Reform. 2015; 1(2): 142–154.
https://doi.org/10.4161/23288604.2014.968005 |
| [12] | Briggs AH, Weinstein MC, Fenwick EAL, Karnon J, Sculpher MJ, Paltiel AD, et al. Model parameter estimation and uncertainty analysis: a report of the ISPOR–SMDM Modeling Good Research Practices Task Force Working Group-6. Med Decis Making. 2012; 32(5): 722–732.
https://doi.org/10.1177/0272989X12458348 |
[1, 12]
.
In Benin, Couffo Department, where both models are implemented within the supply chain, constitutes a unique operational setting for health logistics. Previously covered exclusively by the PULL model, the department has introduced the PUSH model in recent years, in line with national last-mile supply-chain guidelines
| [13] | Ministry of Health of Benin. National guidelines on the health commodity supply chain up to the last mile in Benin. Cotonou (Benin): Ministry of Health; 2022. |
[13]
. This configuration provides an opportunity to isolate and measure the specific effect of the PUSH model on supply-chain performance and costs.
The present study seeks to address this evidence gap by conducting a rigorous differential cost-effectiveness analysis of the two models. By quantifying and comparing logistics and opportunity costs alongside their outcomes for the system and stakeholders, this research provides essential evidence to guide optimal resource allocation and health-system strengthening in sub-Saharan Africa.
2. Methods
2.1. Conceptual Framework and Study Design
This study is a retrospective differential cost-effectiveness analysis conducted in Couffo Department, Benin. It adopts a comparative approach between two similar health zones, one implementing the PUSH model (KTL zone) and the other the PULL model (ADD zone), thus providing a quasi-experimental framework to assess the economic impact of the two logistics strategies. The conceptual model is based on Donabedian’s analytical framework (Inputs–Processes–Outcomes), adapted to the economic dimensions of the supply chain. The primary analytical perspective is that of the health system, with a complementary assessment of costs borne by health facilities (administrative perspective). The six-month time horizon of the analysis (September 2024 to February 2025) was considered sufficient to capture supply cycles and seasonal variations, based on an empirical review of national logistics data and discussions with stakeholders.
2.2. Study Setting and Population
The study was conducted in two health zones of Couffo Department:
ADD Zone (Aplahoue–Djakotomey–Dogbo): applying the PULL model and used as the comparison group;
KTL Zone (Klouékanmè–Toviklin–Lalo): applying the PUSH model and used as the intervention group.
These zones have comparable demographic, geographic and socio-economic characteristics, which helps minimise confounding bias in the comparative analysis. There were no major concurrent interventions during the survey period. The study population consisted of public primary health facilities (health centres) and their zonal distribution depots (DRZS). Simple random sampling was used to select 16 health centres in each zone, yielding a total of 32 facilities.
2.3. Data Collection
Data were collected between March and April 2025 through triangulation of sources and methods.
Direct logistics costs were obtained from accounting records and expenditure sheets of health centres and DRZS using a standardised extraction grid (September 2024-February 2025). Opportunity costs were estimated through interviews and time-motion observations using a semi-structured guide and observation forms.
Effectiveness indicators were derived from SIGL/e-SIGL stock records and activity reports using an audit grid for the same period. Stakeholder satisfaction was collected using a Likert-scale questionnaire, while contextual data were obtained from in-depth qualitative interviews with key actors.
2.4. Identification, Measurement and Valuation of Costs
Costs were identified using a micro-costing approach. They were valued in CFA francs (FCFA) and converted into US dollars (USD) to facilitate international comparisons (exchange rate: 1 USD ≈ 600 FCFA).
Costs were classified into four categories. Direct operational costs included transport (vehicle hire and fuel), staff mobilisation (per diems and overtime), delivery-related maintenance, and communications. These were valued using invoices, payroll records and local tariffs, with staff time converted into cost using average salaries.
Loss-related costs included the value of expired or damaged products and costs arising from stock-outs (emergency purchases, external referrals). These were estimated based on acquisition values and substitution or deferred-care costs.
Opportunity costs corresponded to the time health staff devoted to logistics instead of clinical care, valued using the average hourly wage.
Finally, investment costs covered the depreciation of equipment (vehicles, shelving), calculated using the straight-line method based on acquisition cost and useful life.
2.5. Measurement of Effects and Effectiveness Indicators
Effectiveness was assessed using one main composite indicator and complementary secondary indicators.
The primary indicator was the overall availability rate of essential health commodities, calculated as the mean availability rate for a basket of tracer products over the study period.
Secondary indicators included:
1) operational performance: proportion of facilities with no stock-outs during the period; average delivery lead time;
2) quality: reduction rate of expired or damaged products;
3) acceptability: level of satisfaction among supply-chain actors (logisticians, facility managers).
2.6. Economic and Statistical Analysis
For the differential cost-effectiveness analysis, mean costs and effects per facility were first calculated separately for each zone. The Incremental Cost-Effectiveness Ratio (ICER) was then computed as:
A negative ICER indicates that the PUSH strategy is dominant (less costly and more effective).
A one-way sensitivity analysis was performed by varying the most uncertain parameters (such as the value of time or unit transport cost) by ±20%. A scenario analysis also examined the impact of including or excluding opportunity costs.
For statistical analysis, comparisons of means (costs, delivery times) used Student’s t-test, and comparisons of proportions (satisfaction, stock-outs) used the Chi-square test or Fisher’s exact test, with a significance level of p < 0.05. Analyses were conducted using Stata version 14.
2.7. Ethical Considerations
The study received approval from the IRSP Board, which validated the research protocol in accordance with Beninese regulations on health research ethics. Administrative authorisation was obtained from the Couffo Departmental Health Directorate. Written or oral informed consent was systematically obtained from all participants. The confidentiality of financial data and the anonymity of respondents were strictly ensured.
3. Results
3.1. Sample Characteristics and Comparability of the Zones
The study included 32 health centres, evenly distributed between the two health zones. The structural and demographic characteristics of the ADD (PULL) and KTL (PUSH) zones were statistically comparable, as shown in
Table 1, ensuring that the differences observed subsequently are more likely attributable to the logistics model rather than to contextual factors.
Table 1. Comparative characteristics of the ADD and KTL health zones.
Characteristic | ADD Zone (PULL model) | KTL Zone (PUSH model) | Statistical test (p-value) |
Number of health centres included | 16 | 16 | – |
Mean population served per health centre | 29,450 (SD*: ± 3,200) | 29,226 (SD: ± 2,980) | t = 0.21; p = 0.837 |
Mean distance to the distribution depot (km) | 18.70 (SD: ± 5.20) | 17.90 (SD: ± 4.80) | t = 0.47; p = 0.642 |
Mean number of staff per health centre | 8.50 (SD: ± 1.80) | 8.70 (SD: ± 2.10) | t = −0.31; p = 0.758 |
Mean municipal poverty index | 0.45 | 0.47 | Mann–Whitney U test; p = 0.721 |
*SD: Standard deviation | | | |
3.2. Analysis of Logistics Costs
Cost analysis over the six-month period revealed major differences in both the structure and magnitude of expenditure between the two models. The PUSH model generated an overall saving of 87.80% in total logistics costs compared with the PULL model.
Table 2. Summary of logistics costs over six months (September 2024 – February 2025) for all facilities (USD).
Cost item | ADD Zone (PULL) | KTL Zone (PUSH) | Absolute difference (PUSH – PULL) | Relative change |
Direct transport costs (vehicle hire + fuel) | USD 777.83 | USD 250.00 | –USD 527.83 | –67.90% |
Remuneration for logistics operations (per diems, overtime) | USD 290.00 | USD 640.00 | +USD 350.00 | +120.70% |
Regulation and readjustment costs (returns, corrective trips) | USD 120.83 | USD 153.00 | +USD 32.17 | +26.60% |
Value of economic losses (expired/damaged products and stock-out costs*) | USD 7,333.33 | USD 0.00** | –USD 7,333.33 | –100% |
SUBTOTAL (accounted costs) | USD 8,522.00 | USD 1,043.00 | –USD 7,479.00 | –87.80% |
Estimated opportunity cost* (value of lost clinical staff time) | ~USD 3,500.00 | ~USD 640.00 | –USD 2,860.00 | –81.70% |
** Stock-out costs are incorporated into the value of alternative purchases and deferred care. Under the PUSH model, these costs were negligible and not recorded.
Analysis at facility level further refines this comparison. The mean monthly logistics cost per health centre was significantly lower in the PUSH zone.
Table 3. Mean monthly logistics costs per health centre (USD).
Cost indicator | ADD Zone (PULL) Mean (± SD) | KTL Zone (PUSH) Mean (± SD) | Difference (PUSH – PULL) | p-value |
Total operational cost (excluding losses and opportunity cost) | USD 12.71 (± 0.76) | USD 10.86 (± 0.17) | –USD 1.85 | 0,018 |
Transport cost per kilometre | USD 1.33/km (± 0.14) | USD 0.30/km (± 0.01) | –USD 1.02/km | < 0,001 |
Time devoted to logistics operations | 18.50 days/month (± 2.10) | 1.00 day/month (± 0.20) | –17.50 days/month | < 0,001 |
3.3. Analysis of Effectiveness Indicators
The PUSH model demonstrated superior performance across all selected effectiveness indicators. Availability of essential commodities increased, stock-outs were reduced, and stakeholder satisfaction was significantly higher.
Table 4. Comparison of effectiveness indicators between the PUSH and PULL models。
Effectiveness indicator | ADD Zone (PULL) | KTL Zone (PUSH) | Effect measure | 95% CI / p-value |
1. Product availability | | | | |
Availability rate of tracer products | 94.16% | 98.80% | Difference: +4.64% | 95% CI: [1.72%; 7.56%]; p = 0.003 |
2. Operational performance | | | | |
% of health structures with no stock-outs (6 months) | 9/17 (52.94%) | 15/17 (88.23%) | OR = 6.67 | 95% CI: [1.22; 36.35]; p = 0.028 |
Mean delivery lead time | 20.90 days (± 1.60) | 8.20 days (± 1.30) | Difference: –12.70 days | 95% CI: [–15.10; –10.30]; p < 0.001 |
3. Loss management | | | | |
Rate of expired/damaged products | 36.27% | 14.98% | Difference: –21.29% | 95% CI: [–34.10%; –8.50%]; p = 0.004 |
4. Stakeholder satisfaction | | | | |
% of satisfied actors (logisticians, facility managers) | 6/17 (35.30%) | 12/17 (70.60%) | OR = 4.40 | 95% CI: [1.04; 18.60]; p = 0.044 |
OR: Odds Ratio Health structures: health centres and zonal distribution depot |
3.4. Differential Cost-Effectiveness Analysis
The calculation of incremental cost-effectiveness ratios (ICERs) forms the core of the economic analysis. For the primary outcome (availability rate), the PUSH model proved to be dominant.
Table 5. Incremental Cost-Effectiveness Ratios (ICERs) of the PUSH versus PULL model.
Effectiveness measure (unit) | Incremental cost per centre per month (PUSH – PULL) | Incremental effect (PUSH – PULL) | ICER (Cost per unit of effect) | Interpretation |
Availability rate (%) | –USD 1.85 | +4.64% | USD 0.40 per % point gained | DOMINANT (Less costly and more effective) |
Probability of avoiding a stock-out (percentage points) | –USD 1.85 | +35.29 points | USD 0.05 per point gained | DOMINANT |
Reduction in delivery lead time (days) | –USD 1.85 | –12.70 days | USD 0.15 per day gained | Highly favourable |
Increase in satisfaction (percentage points) | –USD 1.85 | +35.30 points | USD 0.05 per point gained | DOMINANT |
Graphical interpretation of dominance
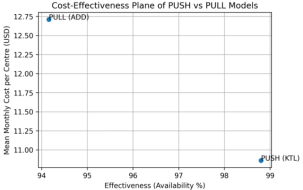
Figure 1. Cost-effectiveness plane of the PUSH and PULL models (Costs expressed in USD; 1 USD = 600 FCFA).
Figure 1 illustrates the cost-effectiveness plane comparing the PUSH and PULL supply chain models. The positioning of the PUSH model in the south-east quadrant indicates that it is both less costly and more effective than the PULL model, thereby representing a dominant strategy. In contrast, the PULL model is associated with higher costs and lower effectiveness. This graphical representation provides an initial indication that the PUSH model delivers superior economic and operational performance, justifying its consideration as a preferred option for health commodity supply chain management.
3.5. Sensitivity Analysis
To assess the robustness of the conclusions, a one-way sensitivity analysis was performed by varying key cost parameters by ±20%.
Table 6. Sensitivity analysis of the acceptability of the PUSH model (USD).
Parameter varied (±20%) | ICER range* (USD per % of availability gained) | Conclusion |
Logistics staff costs (per diems) | –0.48 to –0.32 | PUSH remains dominant (ICER always negative). |
Unit transport cost | –0.51 to –0.29 | PUSH remains dominant and the variation strengthens its cost-effectiveness. |
Value assigned to clinical staff time (opportunity cost) | –0.67 to –0.13 | Including opportunity costs makes PUSH even more dominant. |
Discount rate (0%–5%) | Negligible impact (< 2%) | Results remain stable over time. |
* Base-case ICER = –0.40 USD per % (–239 FCFA ÷ 600) |
Sensitivity-analysis conclusion:
Across all tested scenarios, including the most unfavourable, the PUSH model consistently retains its status as a dominant strategy. Its economic advantage is particularly strengthened when the opportunity cost of health-care workers’ time devoted to logistics under the PULL model is internalised.
These robust findings demonstrate that the transition from the PULL to the PUSH model in Couffo Department represents an efficient allocation of resources, generating both substantial efficiency gains and net financial savings for the health system.
4. Discussion
This study provides empirical evidence of the economic and operational gap between the PUSH and PULL logistics models as implemented in Couffo Department, Benin. The main findings, including economic gains, system-level performance improvements, limitations and direct policy implications, are discussed below.
4.1. Economic Dominance of the PUSH Model: An Efficient Restructuring of Costs
The analysis demonstrates that the PUSH model is economically dominant, generating a net saving of 87.8% in total logistics costs while simultaneously improving outcomes. This dominance results from a profound restructuring of cost components.
The first lever is the radical optimisation of transport costs, with a 77% reduction in cost per kilometre (from USD 1.33 to USD 0.30 per km). This outcome is a direct consequence of the shift from decentralised and fragmented logistics (PULL) to a centralised and planned distribution system (PUSH) consolidated through the zonal distribution depot. This flow consolidation is a core principle of logistics efficiency in resource-constrained settings
| [1] | Yadav P. Health product supply chains in developing countries: diagnosis of the root causes of underperformance and an agenda for reform. Health Syst Reform. 2015; 1(2): 142–154.
https://doi.org/10.4161/23288604.2014.968005 |
| [5] | USAID DELIVER Project. The logistics handbook: a practical guide for the supply chain management of health commodities. Arlington (VA): USAID DELIVER Project, Task Order 1; 2011. |
[1, 5]
. Similar studies in Tanzania and the Democratic Republic of the Congo have shown that optimising distribution models and consolidating flows can substantially reduce logistics and system costs
| [9] | Ruhago GM, Ngalesoni FN, Msasi D, Kengia JT, Mganga M, Kapologwe NA, et al. The public health sector supply chain costs in Tanzania. PLOS Glob Public Health. 2022; 2(11): e0000960. https://doi.org/10.1371/journal.pgph.0000960 |
| [10] | Thomas D, Motomoke E, Crawford J, Defawe O, Makaya A, Ngwato JW, et al. Optimized supply chain model reduces health system costs in the Democratic Republic of the Congo. Vaccine. 2021; 39(30): 4166–4172.
https://doi.org/10.1016/j.vaccine.2021.05.083 |
| [14] | Mwencha M, Rosen JE, Spisak C, Watson N, Kisoka N, Mberesero H. Upgrading supply chain management systems to improve availability of medicines in Tanzania: evaluation of performance and cost effects. Glob Health Sci Pract. 2017; 5(3): 399–411. https://doi.org/10.9745/GHSP-D-16-00395 |
[9, 10, 14]
.
The second lever is the near-elimination of losses associated with stock-outs, estimated at USD 7,333 over six months. This figure captures not only the value of products purchased urgently at higher prices but also the indirect costs of delayed care and unnecessary referrals. These findings are consistent with evidence showing that PUSH systems significantly reduce both the frequency and the economic impact of stock-outs, notably in Senegal, where the informed push approach dramatically reduced contraceptive stock-outs
| [6] | Daff BM, Seck C, Belkhayat H, Sutton P. Informed push distribution of contraceptives in Senegal reduces stockouts and improves quality of family planning services. Glob Health Sci Pract. 2014; 2(2): 245–252.
https://doi.org/10.9745/GHSP-D-13-00171 |
| [8] | Vledder M, Friedman J, Sjöblom M, Brown T, Yadav P. Improving supply chain for essential drugs in low-income countries: results from a large-scale randomized experiment in Zambia. Health Syst Reform. 2019; 5(2): 158–177.
https://doi.org/10.1080/23288604.2019.1596050 |
[6, 8]
. By relying on forecasting and consumption data, the PUSH model therefore mitigates this form of systemic waste.
Finally, the formalisation of personnel costs under the PUSH model (+120.7%) represents a necessary and potentially efficient externalisation of logistics functions. Our estimates indicate that the opportunity cost of clinical staff time devoted to logistics under PULL is far greater than the additional wage costs of the PUSH system. Yadav (2015) highlights this “invisible and non-specialised workforce” as a key driver of supply-chain underperformance
| [1] | Yadav P. Health product supply chains in developing countries: diagnosis of the root causes of underperformance and an agenda for reform. Health Syst Reform. 2015; 1(2): 142–154.
https://doi.org/10.4161/23288604.2014.968005 |
[1]
. By reallocating logistics tasks to dedicated professionals, the PUSH model enables task specialisation and frees valuable clinical time, a major benefit for quality of care, even if it is difficult to monetise fully
| [15] | Kruk ME, Gage AD, Arsenault C, Jordan K, Leslie HH, Roder-DeWan S, et al. High-quality health systems in the Sustainable Development Goals era: time for a revolution. Lancet Glob Health. 2018; 6(11): e1196–e1252.
https://doi.org/10.1016/S2214-109X(18)30386-3 |
[15]
. This task reallocation aligns with broader efforts to improve health-system quality, in which the availability of inputs and the organisation of support functions are fundamental determinants of care performance
| [15] | Kruk ME, Gage AD, Arsenault C, Jordan K, Leslie HH, Roder-DeWan S, et al. High-quality health systems in the Sustainable Development Goals era: time for a revolution. Lancet Glob Health. 2018; 6(11): e1196–e1252.
https://doi.org/10.1016/S2214-109X(18)30386-3 |
[15]
.
4.2. Operational Superiority: Towards a More Resilient Health System
The PUSH model generates system-wide improvements, as reflected in all effectiveness indicators.
The increase in product availability (+4.6 percentage points, reaching 98.8%) is the most striking result. In high-burden settings, uninterrupted access to essential medicines (antimalarials, antibiotics, reproductive-health products) is a critical determinant of health outcomes. Multicentre analyses have shown that medicine availability varies widely across sectors and strongly conditions effective access to treatment, particularly in low- and middle-income countries
| [3] | Cameron A, Roubos I, Ewen M, Mantel-Teeuwisse AK, Leufkens HG, Laing RO. Differences in the availability of medicines for chronic and acute conditions in the public and private sectors of developing countries. Bull World Health Organ. 2011; 89(6): 412–421.
https://doi.org/10.2471/BLT.10.084327 |
[3]
. Furthermore, the overall effectiveness of chronic-disease management in sub-Saharan Africa remains constrained by structural and organisational failures, among which continuous access to inputs is a key factor
. Through its proactive, data-driven and forecast-based approach, the PUSH model moves the system closer to the goal of “zero stock-outs” for critical products, consistent with the strengthening of primary health care and improved equitable access to essential commodities
| [4] | World Health Organization, United Nations Children’s Fund (UNICEF). Operational framework for primary health care: transforming vision into action. Geneva: WHO; UNICEF; 2020. |
| [13] | Ministry of Health of Benin. National guidelines on the health commodity supply chain up to the last mile in Benin. Cotonou (Benin): Ministry of Health; 2022. |
[4, 13]
.
The sharp reduction in delivery lead times (from 20.9 to 8.2 days) enhances system resilience and responsiveness, which is particularly important for managing health emergencies. Recent work on vaccine supply-chain improvements in Zambia has shown that reorganisation of processes and management tools can substantially improve facility-level performance and availability
, while large-scale supply-chain reforms in Zambia have demonstrated major gains in availability and efficiency
| [8] | Vledder M, Friedman J, Sjöblom M, Brown T, Yadav P. Improving supply chain for essential drugs in low-income countries: results from a large-scale randomized experiment in Zambia. Health Syst Reform. 2019; 5(2): 158–177.
https://doi.org/10.1080/23288604.2019.1596050 |
[8]
. This operational gain is directly attributable to centralised planning and disciplined route execution, core features of the PUSH model.
The increase in stakeholder satisfaction (OR = 4.40) reflects a reduced operational burden. It indicates a decline in the cognitive load and stress associated with managing shortages under the PULL model. Actors who are satisfied and confident in the supply system are better able to focus on clinical tasks and deliver high-quality care. This human dimension of logistics performance is consistent with health-system quality frameworks, which emphasise the importance of organisation, reliability and the working environment for producing high-quality care
| [15] | Kruk ME, Gage AD, Arsenault C, Jordan K, Leslie HH, Roder-DeWan S, et al. High-quality health systems in the Sustainable Development Goals era: time for a revolution. Lancet Glob Health. 2018; 6(11): e1196–e1252.
https://doi.org/10.1016/S2214-109X(18)30386-3 |
[15]
. Moreover, a structured and predictable supply system supports the strengthening of primary health care by reducing dysfunctions that undermine effective service delivery
| [4] | World Health Organization, United Nations Children’s Fund (UNICEF). Operational framework for primary health care: transforming vision into action. Geneva: WHO; UNICEF; 2020. |
[4]
.
4.3. Study Limitations and Robustness of the Conclusions
This study has limitations inherent to its design. Its cross-sectional and observational nature allows the identification of strong associations but does not permit definitive causal inference, despite the quasi-experimental configuration and the comparability of the two zones. The six-month analysis period, although sufficient to capture full supply cycles, does not reflect longer-term effects such as full equipment depreciation or changes in practices over time. Finally, the use of intermediate logistics performance indicators, although validated
| [18] | World Health Organization. Monitoring the building blocks of health systems: a handbook of indicators and their measurement strategies. Geneva: World Health Organization; 2010. |
[18]
, does not directly measure ultimate population health outcomes.
However, the one-way sensitivity analysis confirms the exceptional robustness of the main conclusions. Varying the most uncertain cost parameters (staff costs and unit transport costs) by ±20% never challenges the dominant status of the PUSH model. The Incremental Cost-Effectiveness Ratio (ICER) for availability remains consistently negative, ranging from –USD 0.48 to –USD 0.29 per percentage point gained. This resistance to parameter uncertainty substantially strengthens the credibility of the results for decision-making
| [12] | Briggs AH, Weinstein MC, Fenwick EAL, Karnon J, Sculpher MJ, Paltiel AD, et al. Model parameter estimation and uncertainty analysis: a report of the ISPOR–SMDM Modeling Good Research Practices Task Force Working Group-6. Med Decis Making. 2012; 32(5): 722–732.
https://doi.org/10.1177/0272989X12458348 |
[12]
.
4.4. Policy Implications for Strengthening the Beninese Health System
The policy implications of these robust findings are direct and compelling. Scaling up the PUSH model nationally represents a high-return strategic investment for the Beninese health system. The quantified results provide the missing economic justification for prioritising this reform.
In practical terms, this implies:
1) A phased deployment plan, prioritising areas with the highest stock-out prevalence and the highest logistics costs under the PULL model.
2) Targeted investment in human and material capital: training dedicated logisticians and acquiring an optimised distribution fleet are prerequisites whose return on investment is clearly demonstrated, in line with evidence showing that optimised models reduce system costs and improve availability
| [9] | Ruhago GM, Ngalesoni FN, Msasi D, Kengia JT, Mganga M, Kapologwe NA, et al. The public health sector supply chain costs in Tanzania. PLOS Glob Public Health. 2022; 2(11): e0000960. https://doi.org/10.1371/journal.pgph.0000960 |
| [10] | Thomas D, Motomoke E, Crawford J, Defawe O, Makaya A, Ngwato JW, et al. Optimized supply chain model reduces health system costs in the Democratic Republic of the Congo. Vaccine. 2021; 39(30): 4166–4172.
https://doi.org/10.1016/j.vaccine.2021.05.083 |
| [14] | Mwencha M, Rosen JE, Spisak C, Watson N, Kisoka N, Mberesero H. Upgrading supply chain management systems to improve availability of medicines in Tanzania: evaluation of performance and cost effects. Glob Health Sci Pract. 2017; 5(3): 399–411. https://doi.org/10.9745/GHSP-D-16-00395 |
[9, 10, 14]
.
3) Systematic integration of the model into health planning and financing instruments, including the National Health Development Plan
| [19] | Republic of Benin. National Health Development Plan (PNDS) 2018–2022. Cotonou (Benin): Ministry of Health; 2018. |
[19]
and procurement plans of technical and financial partners.
This reform is fully aligned with the goal of strengthening primary health care and progressing towards universal health coverage by ensuring equitable and reliable access to essential health commodities
| [4] | World Health Organization, United Nations Children’s Fund (UNICEF). Operational framework for primary health care: transforming vision into action. Geneva: WHO; UNICEF; 2020. |
[4]
. It represents a concrete application of resource optimisation in a constrained health system, demonstrating that efficiency and effectiveness can be improved simultaneously.
5. Conclusion
This cost-effectiveness analysis demonstrates that the PUSH logistics model is a dominant strategy compared with the PULL model in resource-limited health-system settings, as observed in Couffo Department, Benin. The findings reveal clear economic and operational superiority: PUSH reduces total logistics costs by 87.8%, improves the availability of essential commodities (98.8% versus 94.16%), reduces stock-outs and increases stakeholder satisfaction. These gains are driven by transport optimisation, centralised planning and loss reduction. Sensitivity analysis confirms the robustness of these conclusions. Consequently, scaling up the PUSH model nationally represents a strategic and cost-effective investment for optimal allocation of Benin’s health-system resources. This reform offers a practical opportunity to improve efficiency while ensuring reliable access to health commodities, supporting the achievement of universal health coverage.
Despite the robustness of the findings, further large-scale and potentially multicentre studies conducted over longer periods, and involving multiple public health disciplines—including health economics and socio-anthropology—will be necessary to confirm these results and, above all, to support the sustainability and consolidation of the deployment of the PUSH model adopted by Benin.
Abbreviations
DRZS | Zonal Distribution Depots |
ADD | Zone Aplahoue–Djakotomey–Dogbo |
KTL | Zone (Klouekanme–Toviklin–Lalo) |
SIGL/e-SIGL | Logistics Management Information System |
FCFA | Currency of Benin (1 USD ≈ 600 FCFA) |
ICER | Incremental Cost-Effectiveness Ratio |
Acknowledgments
The authors are grateful to IRSP-CAQ, the Ministry of Health, and the staff of the Couffo Departmental Directorate of Health, as well as the coordination teams and health-zone staff of KTL and ADD, for their valuable support and collaboration.
Author Contributions
Lamidhi Salami: Conceptualization, Data curation, Formal Analysis, Investigation, Methodology, Project administration, Resources, Software, Supervision, Validation, Visualization, Writing - original draft, Writing – review & editing
Petronille Acray-Zengbe: Conceptualization, Formal Analysis, Methodology, Supervision, Validation, Visualization, Writing - original draft, Writing – review & editing
Colette Azandjeme: Conceptualization, Formal Analysis, Investigation, Methodology, Project administration, Validation, Visualization, Writing - original draft, Writing – review & editing
Patrick Charles Makoutode: Conceptualization, Data curation, Formal Analysis, Methodology, Project administration, Software, Supervision, Validation, Visualization, Writing – review & editing
Chekina Elysee Eyitayo Atindehou: Conceptualization, Data curation, Formal Analysis, Investigation, Methodology, Resources, Software, Visualization, Writing – original draft
Yafou Mauricette Ursule Makin: Data curation, Formal Analysis, Investigation, Methodology, Software, Visualization, Writing – original draft
Charles Sossa Jerome: Conceptualization, Formal Analysis, Methodology, Resources, Software, Supervision, Validation, Writing – review & editing
Ghislain Emmanuel Sopoh: Conceptualization, Formal Analysis, Methodology, Resources, Software, Supervision, Validation, Writing – review & editing
Data Availability Statement
The datasets generated and analysed during the current study are available from the corresponding author upon reasonable request.
Conflicts of Interest
The authors declare no conflicts of interest.
References
| [1] |
Yadav P. Health product supply chains in developing countries: diagnosis of the root causes of underperformance and an agenda for reform. Health Syst Reform. 2015; 1(2): 142–154.
https://doi.org/10.4161/23288604.2014.968005
|
| [2] |
Gray A, Manasse HR Jr. Shortages of medicines: a complex global challenge. Bull World Health Organ. 2012; 90(3): 158–158A.
https://doi.org/10.2471/BLT.11.101303
|
| [3] |
Cameron A, Roubos I, Ewen M, Mantel-Teeuwisse AK, Leufkens HG, Laing RO. Differences in the availability of medicines for chronic and acute conditions in the public and private sectors of developing countries. Bull World Health Organ. 2011; 89(6): 412–421.
https://doi.org/10.2471/BLT.10.084327
|
| [4] |
World Health Organization, United Nations Children’s Fund (UNICEF). Operational framework for primary health care: transforming vision into action. Geneva: WHO; UNICEF; 2020.
|
| [5] |
USAID DELIVER Project. The logistics handbook: a practical guide for the supply chain management of health commodities. Arlington (VA): USAID DELIVER Project, Task Order 1; 2011.
|
| [6] |
Daff BM, Seck C, Belkhayat H, Sutton P. Informed push distribution of contraceptives in Senegal reduces stockouts and improves quality of family planning services. Glob Health Sci Pract. 2014; 2(2): 245–252.
https://doi.org/10.9745/GHSP-D-13-00171
|
| [7] |
Krug C, Cavallaro FL, Wong KLM, Gasparrini A, Faye A, et al. Evaluation of Senegal supply chain intervention on contraceptive stockouts using routine stock data. PLoS One. 2020; 15(8): e0236659.
https://doi.org/10.1371/journal.pone.0236659
|
| [8] |
Vledder M, Friedman J, Sjöblom M, Brown T, Yadav P. Improving supply chain for essential drugs in low-income countries: results from a large-scale randomized experiment in Zambia. Health Syst Reform. 2019; 5(2): 158–177.
https://doi.org/10.1080/23288604.2019.1596050
|
| [9] |
Ruhago GM, Ngalesoni FN, Msasi D, Kengia JT, Mganga M, Kapologwe NA, et al. The public health sector supply chain costs in Tanzania. PLOS Glob Public Health. 2022; 2(11): e0000960.
https://doi.org/10.1371/journal.pgph.0000960
|
| [10] |
Thomas D, Motomoke E, Crawford J, Defawe O, Makaya A, Ngwato JW, et al. Optimized supply chain model reduces health system costs in the Democratic Republic of the Congo. Vaccine. 2021; 39(30): 4166–4172.
https://doi.org/10.1016/j.vaccine.2021.05.083
|
| [11] |
Makkawi AME, Mousnad MA, Mohamed GK. Cost-Effectiveness Analysis of Supply Chain System: Sudan's National Medical Supplies Fund 2011-2014. Glob J Qual Saf Healthc. 2020 May 26; 3(2): 72-80.
https://doi.org/10.36401/JQSH-20-6.
|
| [12] |
Briggs AH, Weinstein MC, Fenwick EAL, Karnon J, Sculpher MJ, Paltiel AD, et al. Model parameter estimation and uncertainty analysis: a report of the ISPOR–SMDM Modeling Good Research Practices Task Force Working Group-6. Med Decis Making. 2012; 32(5): 722–732.
https://doi.org/10.1177/0272989X12458348
|
| [13] |
Ministry of Health of Benin. National guidelines on the health commodity supply chain up to the last mile in Benin. Cotonou (Benin): Ministry of Health; 2022.
|
| [14] |
Mwencha M, Rosen JE, Spisak C, Watson N, Kisoka N, Mberesero H. Upgrading supply chain management systems to improve availability of medicines in Tanzania: evaluation of performance and cost effects. Glob Health Sci Pract. 2017; 5(3): 399–411.
https://doi.org/10.9745/GHSP-D-16-00395
|
| [15] |
Kruk ME, Gage AD, Arsenault C, Jordan K, Leslie HH, Roder-DeWan S, et al. High-quality health systems in the Sustainable Development Goals era: time for a revolution. Lancet Glob Health. 2018; 6(11): e1196–e1252.
https://doi.org/10.1016/S2214-109X(18)30386-3
|
| [16] |
Geldsetzer P, Ortblad KF, Bärnighausen T. The efficiency of chronic disease care in sub-Saharan Africa. BMC Med. 2016; 14: 127.
https://doi.org/10.1186/s12916-016-0675-6
|
| [17] |
Linnander E, Ineza L, Bobo PM, Bechtold K. Improving management of vaccine supply chains: a multi-methods evaluation of vSTEP in Zambia. Vaccine. 2022; 40(38): 5579–5584.
https://doi.org/10.1016/j.vaccine.2022.07.027
|
| [18] |
World Health Organization. Monitoring the building blocks of health systems: a handbook of indicators and their measurement strategies. Geneva: World Health Organization; 2010.
|
| [19] |
Republic of Benin. National Health Development Plan (PNDS) 2018–2022. Cotonou (Benin): Ministry of Health; 2018.
|
Cite This Article
-
APA Style
Salami, L., Acray-Zengbe, P., Azandjeme, C., Makoutode, P. C., Atindehou, C. E. E., et al. (2026). Cost-effectiveness Analysis of the PUSH Model for Health-commodity Supply-chain Management in Couffo Department, Benin. International Journal of Health Economics and Policy, 11(1), 31-39. https://doi.org/10.11648/j.hep.20261101.13
 Copy
|
Copy
|
 Download
ACS Style
Salami, L.; Acray-Zengbe, P.; Azandjeme, C.; Makoutode, P. C.; Atindehou, C. E. E., et al. Cost-effectiveness Analysis of the PUSH Model for Health-commodity Supply-chain Management in Couffo Department, Benin. Int. J. Health Econ. Policy 2026, 11(1), 31-39. doi: 10.11648/j.hep.20261101.13
Copy
|
Download
AMA Style
Salami L, Acray-Zengbe P, Azandjeme C, Makoutode PC, Atindehou CEE, et al. Cost-effectiveness Analysis of the PUSH Model for Health-commodity Supply-chain Management in Couffo Department, Benin. Int J Health Econ Policy. 2026;11(1):31-39. doi: 10.11648/j.hep.20261101.13
Copy
|
Download
-
@article{10.11648/j.hep.20261101.13,
  author = {Lamidhi Salami and Petronille Acray-Zengbe and Colette Azandjeme and Patrick Charles Makoutode and Chekina Elysee Eyitayo Atindehou and Yafou Mauricette Ursule Makin and Charles Sossa Jerome and Ghislain Emmanuel Sopoh},
  title = {Cost-effectiveness Analysis of the PUSH Model for Health-commodity Supply-chain Management in Couffo Department, Benin},
  journal = {International Journal of Health Economics and Policy},
  volume = {11},
  number = {1},
  pages = {31-39},
  doi = {10.11648/j.hep.20261101.13},
  url = {https://doi.org/10.11648/j.hep.20261101.13},
  eprint = {https://article.sciencepublishinggroup.com/pdf/10.11648.j.hep.20261101.13},
  abstract = {Introduction. In resource-limited countries, the performance of health-commodity supply chains is a critical determinant of access to care. Despite the documented operational advantages of the PUSH logistics model (push-based flow), its comparative economic assessment against the traditional PULL model (pull-based flow) remains limited, depriving decision-makers of robust evidence for optimal investment choices. Methods. A retrospective differential cost-effectiveness analysis was conducted over six months in Couffo Department, Benin. Two comparable health zones applying respectively the PULL model (ADD zone) and the PUSH model (KTL zone) provided a quasi-experimental framework. Direct, indirect and opportunity logistics costs were micro-costed for 32 health centres. The primary outcome was measured by the availability rate of essential commodities. Incremental cost-effectiveness ratios (ICERs) were calculated, and sensitivity analyses tested the robustness of the results. Results. The PUSH model reduced total logistics costs by 87.8% compared with the PULL model, driven by substantial transport optimisation (a 77% reduction in cost per kilometre) and the near-elimination of economic losses associated with stock-outs (USD 7,333 saved). Concurrently, it improved product availability from 94.16% to 98.80%, shortened delivery lead times, and increased stakeholder satisfaction. The ICER for availability was negative (-USD 0.40 per percentage point gained), confirming that PUSH is a dominant strategy (less costly and more effective). This conclusion remained robust across all sensitivity-analysis scenarios. Conclusion. This study provides empirical evidence that the PUSH model is economically dominant over the PULL model in the Beninese context. Its large-scale deployment represents a high-return strategic investment, enabling optimal resource allocation to strengthen health-system resilience and progress towards universal health coverage.},
 year = {2026}
}
Copy
|
Download
-
TY  - JOUR
T1  - Cost-effectiveness Analysis of the PUSH Model for Health-commodity Supply-chain Management in Couffo Department, Benin
AU  - Lamidhi Salami
AU  - Petronille Acray-Zengbe
AU  - Colette Azandjeme
AU  - Patrick Charles Makoutode
AU  - Chekina Elysee Eyitayo Atindehou
AU  - Yafou Mauricette Ursule Makin
AU  - Charles Sossa Jerome
AU  - Ghislain Emmanuel Sopoh
Y1  - 2026/02/25
PY  - 2026
N1  - https://doi.org/10.11648/j.hep.20261101.13
DO  - 10.11648/j.hep.20261101.13
T2  - International Journal of Health Economics and Policy
JF  - International Journal of Health Economics and Policy
JO  - International Journal of Health Economics and Policy
SP  - 31
EP  - 39
PB  - Science Publishing Group
SN  - 2578-9309
UR  - https://doi.org/10.11648/j.hep.20261101.13
AB  - Introduction. In resource-limited countries, the performance of health-commodity supply chains is a critical determinant of access to care. Despite the documented operational advantages of the PUSH logistics model (push-based flow), its comparative economic assessment against the traditional PULL model (pull-based flow) remains limited, depriving decision-makers of robust evidence for optimal investment choices. Methods. A retrospective differential cost-effectiveness analysis was conducted over six months in Couffo Department, Benin. Two comparable health zones applying respectively the PULL model (ADD zone) and the PUSH model (KTL zone) provided a quasi-experimental framework. Direct, indirect and opportunity logistics costs were micro-costed for 32 health centres. The primary outcome was measured by the availability rate of essential commodities. Incremental cost-effectiveness ratios (ICERs) were calculated, and sensitivity analyses tested the robustness of the results. Results. The PUSH model reduced total logistics costs by 87.8% compared with the PULL model, driven by substantial transport optimisation (a 77% reduction in cost per kilometre) and the near-elimination of economic losses associated with stock-outs (USD 7,333 saved). Concurrently, it improved product availability from 94.16% to 98.80%, shortened delivery lead times, and increased stakeholder satisfaction. The ICER for availability was negative (-USD 0.40 per percentage point gained), confirming that PUSH is a dominant strategy (less costly and more effective). This conclusion remained robust across all sensitivity-analysis scenarios. Conclusion. This study provides empirical evidence that the PUSH model is economically dominant over the PULL model in the Beninese context. Its large-scale deployment represents a high-return strategic investment, enabling optimal resource allocation to strengthen health-system resilience and progress towards universal health coverage.
VL  - 11
IS  - 1
ER  -
Copy
|
Download