Climate change has been one of the most environmental problems facing the world today. Many studies were made on the issue of climate change in different parts of the countries, based on rainfall and temperature data. There was still a wide zone variation among the study area and some lapse in it. Hence, this study aims at analyzing climate variability based on temperature, rainfall and satellite image. Gridded rainfall and temperature data, and satellite image for 30 years, were used for analysis. The overall average rainfall in the last 30 years was 1036.50 mm with standard deviation of + 27.27 mm and coefficient of variation 2.63%. The annual rainfall and pattern show a considerable fluctuation, one year there is a slight positive anomaly and on the other year shows negative anomalies. Based on drought index classification, the statistical result revealed that in the area extremely dry was observed in 2002- 2004. In the year 2000, 2001 and 2011 severely dry was observed. Moderate drought was occurred in 2005 and 2015. No drought (nearly normal) that was observed in the rest observation. The total average rainfall of Kiremt season between 1990 and 2020 was found to be 762.28 mm with +18.74 mm standard deviation and coefficient of variation 2.46%. The mean maximum temperature of the study area over thirty years’ time ranging from 1990 to 2020 was 26.03°C with standard deviation +1.25°C and coefficient of variation 4.80%. From the result, there was linear correlation between mean annual rainfall and calculated NDVI value. The r2 value was 0.8749. Regarding to the graph there was negative correlation (-0.88 correlation coefficient) of mean annual temperature and mean annual NDVI value of the year 1990 to 2020, with 0.766 value of r2. From the RSCCI, in thirty years observation there was 0.013% decrement in area of dega region from 1990 to 2020, and increment of woinadega and kola by 0.004% and 0.01% respectively. The highest proportion of the area falls within dega (49.93%) of the total area. The second highest (30.54%) area falls within woinadega and kola occupied small portion (19.53%) of the study area. Based on the finding of this study, possible to predict that the study area climate would project to dega (49.53%), woinadega (30.66%) and kola (19.81%) agro-ecology for the next thirty years (2050).
| Published in | Engineering Science (Volume 11, Issue 2) |
| DOI | 10.11648/j.es.20261102.11 |
| Page(s) | 32-45 |
| Creative Commons |
This is an Open Access article, distributed under the terms of the Creative Commons Attribution 4.0 International License (http://creativecommons.org/licenses/by/4.0/), which permits unrestricted use, distribution and reproduction in any medium or format, provided the original work is properly cited. |
| Copyright |
Copyright © The Author(s), 2026. Published by Science Publishing Group |
Climate Variability, Spatial, Temporal, Remote Sensing Climatic Compound Index
No | Data required | Source | Data type | Year | Data format |
|---|---|---|---|---|---|
1 | Rainfall | National Metrological Agency | Secondary | 1990-2020 | Csv |
2 | Temperature | National Metrological Agency | Secondary | 1990-2020 | Csv |
3 | Satellite image | USGS | Secondary | 1990-2020 | TIFF |
No | Software | Version | Purpose |
|---|---|---|---|
1 | Arc GIS | 10.8 | Storing, managing, and analyzing spatial information and produce map |
2 | ERDAS IMAGINE | 2015 | Processing and analyzing satellite images |
3 | SPSS | 22 | Management and statistical analysis of data |
4 | ENVI | 5.3 | Processing and analyzing satellite images |
Year | Maximum | Minimum | Mean | SD | CV (%) |
|---|---|---|---|---|---|
1990-2000 | 1405.63 | 720.27 | 1096.75 | 18.00 | 2 |
2000-2010 | 1333.83 | 561.15 | 872.48 | 27.31 | 3.13 |
2010-2020 | 1842.5 | 722.33 | 1134.26 | 30.38 | 2.68 |
Decades | Mean Rainfall (mm) | SD | CV |
|---|---|---|---|
1990-2000 | 814.60 | 12.50 | 0.015344 |
2000-2010 | 643.61 | 21.37 | 0.0332 |
2010-2020 | 823.40 | 17.59 | 0.021359 |
Decades | Mean Rainfall (mm) | SD | CV |
|---|---|---|---|
1990-2000 | 201.48 | 7.33 | 0.04 |
2000-2010 | 171.94 | 9.00 | 0.05 |
2010-2020 | 246.95 | 17.40 | 0.07 |
Decades | Mean Rainfall (mm) | SD | CV |
|---|---|---|---|
1990-2000 | 80.67 | 5.23 | 0.06 |
2000-2010 | 56.93 | 3.38 | 0.06 |
2010-2020 | 64.81 | 3.93 | 0.06 |
PCI | Annual (%) | Kiremt (%) | Belg (%) | Bega (%) |
|---|---|---|---|---|
<10 | - | 64.52 | 19.35 | 16.13 |
10 - 15 | 38.71 | 22.58 | 54.84 | 19.35 |
16 -20 | 61.29 | 12.90 | 19.35 | 22.58 |
>20 | 38.71 | 6.45 | 41.94 |
Year | Mean (°C) | SD (°C) | CV (%) | |||
|---|---|---|---|---|---|---|
Max | Min | Max | Min | Max | Min | |
1990-2000 | 25.71 | 11.69 | 1.03 | 0.38 | 4 | 3.23 |
2001-2010 | 25.86 | 11.94 | 1.26 | 0.40 | 4.86 | 3.33 |
2011-2020 | 26.55 | 11.84 | 1.41 | 0.32 | 5.32 | 2.68 |
Vegetation Coverage per decade | |||
|---|---|---|---|
Decade | 1990-2000 | 2001-2010 | 2011-2020 |
CV | 0.05-0.17 | 0.17- 0.21 | 0.12 -0.17 |
Vegetation Coverage (%) | 5.29-16.60 | 16.60-21.30 | 11.72 -16.55 |
Classes | 1990 | 2000 | 2010 | 2020 | ||||
|---|---|---|---|---|---|---|---|---|
Area (hect) | % | Area (hect) | % | Area (hect) | % | Area (hect) | % | |
Dega | 468379.6 | 50.33 | 335034.4 | 36.00 | 373688 | 40.15 | 464659.6 | 49.93 |
Woina-dega | 283120.8 | 30.42 | 373688 | 40.15 | 355003.8 | 38.14 | 284270.7 | 30.54 |
Kola | 179190.21 | 19.25 | 221968.2 | 23.85 | 201998.8 | 21.70 | 181760.3 | 19.53 |
AEZs | Agro Ecological Zones |
CSA | Central Statistical Agency |
DN | Digital Number |
ENVI | Environment for Visualization of Image |
ERDAS | Earth Resources Data Analysis System |
ETM+ | Enhanced Thematic Mapper Plus |
GIS | Geographic Information System |
MSI | Moisture Stress Index |
NDVI | Normalized Difference Vegetation Index |
OLI | Operational Land Imager |
RS | Remote Sensing |
RSCCI | Remote Sensing Climate Compound Index |
SAVI | Adjusted-Soil Vegetation Index |
SPSS | Statistical Package for Social Sciences |
TM | Thematic Mapper |
TNDVI | Transformation Normalized Difference Vegetation Index |
USGS | United States Geological Survey |
WMO | World Meteorological Organization |
| [1] | Abbadi Girmay., Tripath, N., Soni, P., Tipdecho, T., and Phalke, A, (2013). Temporal Climate Trend of Ping Basin of Thailand and Implications for Mekong Region. Research Article on Earth Science & Climatic Change, Volume 4 ISSN: 2157-7617 JESCC, an open access journal. |
| [2] | Ashenafi Hailu, Arega Bazezew and Yechale Kebede, (2013). Variability and Trends of Temperature and Rainfall Over Three Agro-Ecological Zones in North Shewa, |
| [3] | Cheung et al., (2008). Trends and Spatial Distribution of Annual and Seasonal Rainfall in Ethiopia. |
| [4] | Dereje Ayalew, Kindie Tesfaye, Girma Mamo, Birru Yitaferu and Wondimu Bayu, (2012). Variability of Rainfall and its Current Trend in Amhara Region, Ethiopia. African Journal of Agricultural Research Vol. 7(10), pp. 1475-1486. |
| [5] | Esubalew Nebebe, (2014). GIS And Remote Sensing Techniques Application to the Spatio-Temporal Climate Variability Analysis the Case of Ziway Dugda and Dodota Woreda, Arsi Zone, Oromia Region, Ethiopia. |
| [6] | Getnet Feyisa, (2010). Comparative Analysis of Climate Variability and Impacts in Central Rift Valley and Adjacent Arsi Highlands Using GIS and Remote Sensing. Unpublished MSc thesis Faculty of Natural Science Department of Earth Sciences, Addis Ababa University. |
| [7] | Huete AR (1988). A soil adjusted vegetation index (SAVI). Remote Sens Environ 25(3): 295–309. |
| [8] | Intergovernmental Panel on Climate Change [IPCC], (2007). Climate change 2007: Impacts, Adaptation and Vulnerability. Working Group II contribution to the Intergovernmental Panel on Climate Change Fourth Assessment Report: summary for Policymakers. Cambridge University Press, Cambridge, UK. |
| [9] | Kanwal Javid, (2019). Modeling and mapping of climatic classification of Pakistan by using remote sensing climate compound index (2000 to 2018). |
| [10] | National Meteorological Agency [NMA], (2007). National Adaptation Program of Action of Ethiopia (NAPA). National Meteorological Agency, Addis Ababa. |
| [11] | Sobrino JA, Jiménez-Muñoz JC, Paolini L (2004) Land surface tem-perature retrieval from LANDSAT TM5. Remote Sens Environ 90: 434–440. |
| [12] | World Meteorological Organization, (2005). Climate and Land Degradation. Soil conservation Land Management Flood Forecasting Food Security, WMO- No 989, Geneva, Switzerland. |
| [13] | Yitea Seneshaw, (2012). Spatial-Temporal Analyses of Climate Elements, Vegetation Characteristics and Sea Surface Temperature Anomaly. |
APA Style
Taddesse, A. D., Tofu, T. K., Selato, A. W. (2026). Analyzing Spatio-temporal Climate Variability Using Geospatial Technology: A Case of North Shewa, Oromia, Ethiopia. Engineering Science, 11(2), 32-45. https://doi.org/10.11648/j.es.20261102.11
ACS Style
Taddesse, A. D.; Tofu, T. K.; Selato, A. W. Analyzing Spatio-temporal Climate Variability Using Geospatial Technology: A Case of North Shewa, Oromia, Ethiopia. Eng. Sci. 2026, 11(2), 32-45. doi: 10.11648/j.es.20261102.11
@article{10.11648/j.es.20261102.11,
  author = {Adamu Dessalegn Taddesse and Tariku Kebede Tofu and Amanuel Wolde Selato},
  title = {Analyzing Spatio-temporal Climate Variability Using Geospatial Technology: A Case of North Shewa, Oromia, Ethiopia},
  journal = {Engineering Science},
  volume = {11},
  number = {2},
  pages = {32-45},
  doi = {10.11648/j.es.20261102.11},
  url = {https://doi.org/10.11648/j.es.20261102.11},
  eprint = {https://article.sciencepublishinggroup.com/pdf/10.11648.j.es.20261102.11},
  abstract = {Climate change has been one of the most environmental problems facing the world today. Many studies were made on the issue of climate change in different parts of the countries, based on rainfall and temperature data. There was still a wide zone variation among the study area and some lapse in it. Hence, this study aims at analyzing climate variability based on temperature, rainfall and satellite image. Gridded rainfall and temperature data, and satellite image for 30 years, were used for analysis. The overall average rainfall in the last 30 years was 1036.50 mm with standard deviation of + 27.27 mm and coefficient of variation 2.63%. The annual rainfall and pattern show a considerable fluctuation, one year there is a slight positive anomaly and on the other year shows negative anomalies. Based on drought index classification, the statistical result revealed that in the area extremely dry was observed in 2002- 2004. In the year 2000, 2001 and 2011 severely dry was observed. Moderate drought was occurred in 2005 and 2015. No drought (nearly normal) that was observed in the rest observation. The total average rainfall of Kiremt season between 1990 and 2020 was found to be 762.28 mm with +18.74 mm standard deviation and coefficient of variation 2.46%. The mean maximum temperature of the study area over thirty years’ time ranging from 1990 to 2020 was 26.03°C with standard deviation +1.25°C and coefficient of variation 4.80%. From the result, there was linear correlation between mean annual rainfall and calculated NDVI value. The r2 value was 0.8749. Regarding to the graph there was negative correlation (-0.88 correlation coefficient) of mean annual temperature and mean annual NDVI value of the year 1990 to 2020, with 0.766 value of r2. From the RSCCI, in thirty years observation there was 0.013% decrement in area of dega region from 1990 to 2020, and increment of woinadega and kola by 0.004% and 0.01% respectively. The highest proportion of the area falls within dega (49.93%) of the total area. The second highest (30.54%) area falls within woinadega and kola occupied small portion (19.53%) of the study area. Based on the finding of this study, possible to predict that the study area climate would project to dega (49.53%), woinadega (30.66%) and kola (19.81%) agro-ecology for the next thirty years (2050).},
 year = {2026}
}
TY  - JOUR
T1  - Analyzing Spatio-temporal Climate Variability Using Geospatial Technology: A Case of North Shewa, Oromia, Ethiopia
AU  - Adamu Dessalegn Taddesse
AU  - Tariku Kebede Tofu
AU  - Amanuel Wolde Selato
Y1  - 2026/06/05
PY  - 2026
N1  - https://doi.org/10.11648/j.es.20261102.11
DO  - 10.11648/j.es.20261102.11
T2  - Engineering Science
JF  - Engineering Science
JO  - Engineering Science
SP  - 32
EP  - 45
PB  - Science Publishing Group
SN  - 2578-9279
UR  - https://doi.org/10.11648/j.es.20261102.11
AB  - Climate change has been one of the most environmental problems facing the world today. Many studies were made on the issue of climate change in different parts of the countries, based on rainfall and temperature data. There was still a wide zone variation among the study area and some lapse in it. Hence, this study aims at analyzing climate variability based on temperature, rainfall and satellite image. Gridded rainfall and temperature data, and satellite image for 30 years, were used for analysis. The overall average rainfall in the last 30 years was 1036.50 mm with standard deviation of + 27.27 mm and coefficient of variation 2.63%. The annual rainfall and pattern show a considerable fluctuation, one year there is a slight positive anomaly and on the other year shows negative anomalies. Based on drought index classification, the statistical result revealed that in the area extremely dry was observed in 2002- 2004. In the year 2000, 2001 and 2011 severely dry was observed. Moderate drought was occurred in 2005 and 2015. No drought (nearly normal) that was observed in the rest observation. The total average rainfall of Kiremt season between 1990 and 2020 was found to be 762.28 mm with +18.74 mm standard deviation and coefficient of variation 2.46%. The mean maximum temperature of the study area over thirty years’ time ranging from 1990 to 2020 was 26.03°C with standard deviation +1.25°C and coefficient of variation 4.80%. From the result, there was linear correlation between mean annual rainfall and calculated NDVI value. The r2 value was 0.8749. Regarding to the graph there was negative correlation (-0.88 correlation coefficient) of mean annual temperature and mean annual NDVI value of the year 1990 to 2020, with 0.766 value of r2. From the RSCCI, in thirty years observation there was 0.013% decrement in area of dega region from 1990 to 2020, and increment of woinadega and kola by 0.004% and 0.01% respectively. The highest proportion of the area falls within dega (49.93%) of the total area. The second highest (30.54%) area falls within woinadega and kola occupied small portion (19.53%) of the study area. Based on the finding of this study, possible to predict that the study area climate would project to dega (49.53%), woinadega (30.66%) and kola (19.81%) agro-ecology for the next thirty years (2050).
VL  - 11
IS  - 2
ER  -
Department of Surveying Engineering, Wachemo University, Hosanna, Ethiopia
Department of Surveying Engineering, Wachemo University, Hosanna, Ethiopia
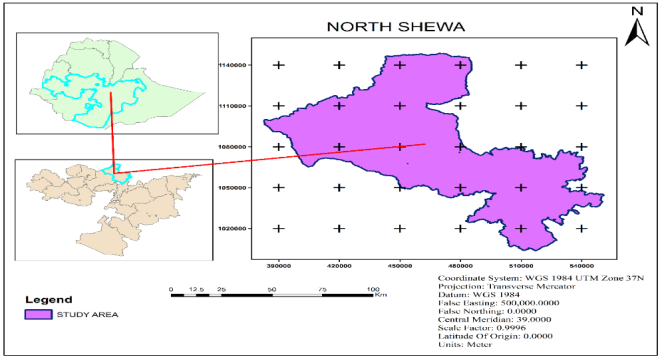
Figure 1. Location of Study Area.
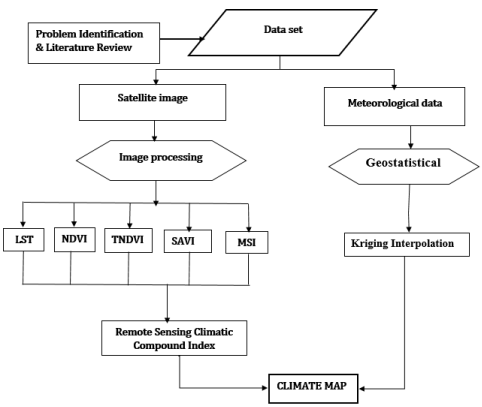
Figure 2. Methodological Scheme of the Study.
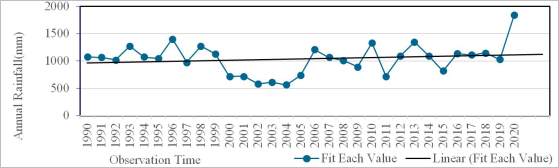
Figure 3. Total mean annual rainfall trends in the study area between 1990 and 2020.
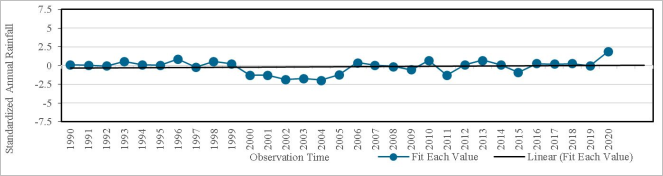
Figure 4. Standardized annual rainfall anomaly in the study site during the observation year b/n 1990 and 2020.
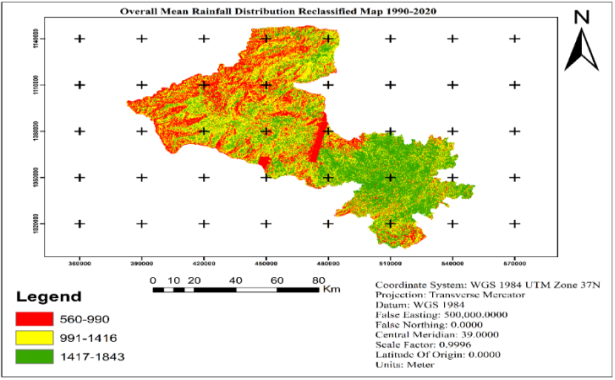
Figure 5. The Overall Mean Rainfall Distribution Reclassified Map 1990-2020.
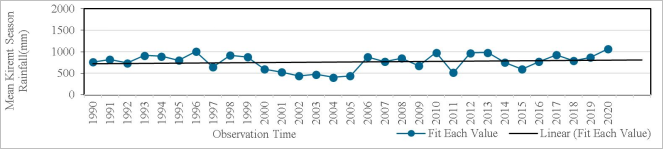
Figure 6. Trend of rainfall during kiremt season b/n 1990 and 2020.
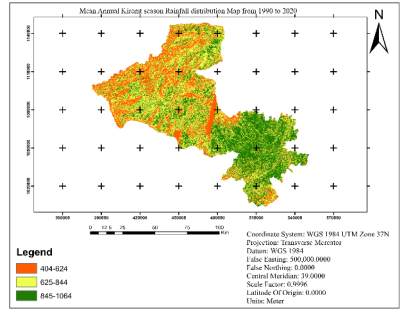
Figure 7. Mean Annual Kiremt rainfall distribution between 1990 and 2020.
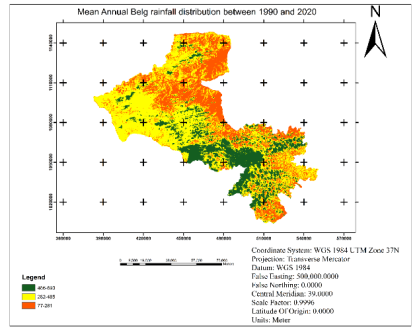
Figure 8. Mean Annual Belg rainfall distribution between 1990 and 2020.
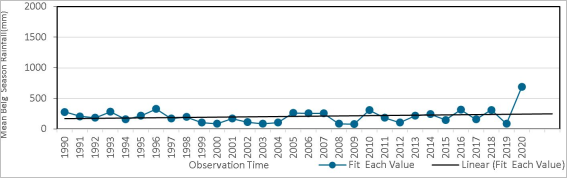
Figure 9. Shows trend of rainfall distribution in belg season from 1990 to 2020.
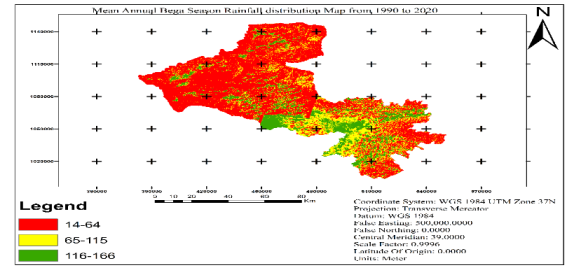
Figure 10. Mean annual Bega season rainfall distribution between 1990 and 2020.
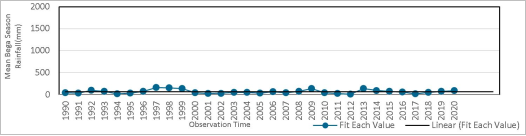
Figure 11. Shows trend of rainfall distribution in Bega season from 1990 to 2020.
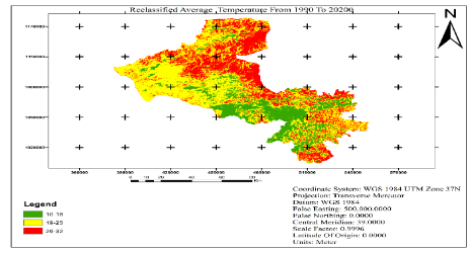
Figure 12. Reclassified average temperature between 1990 and 2020.
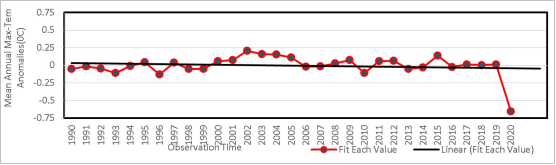
Figure 13. Mean maximum temperature variability and trend over the study area.
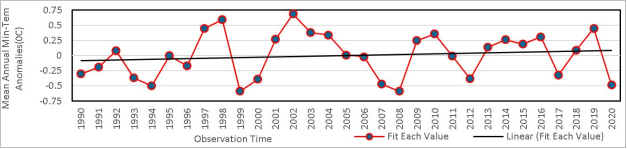
Figure 14. Mean minimum temperature variability and trend over the study area.
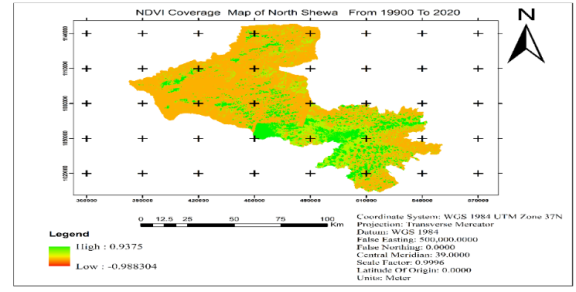
Figure 15. Depicts the overall average annual NDVI distribution 1990 to 2020.
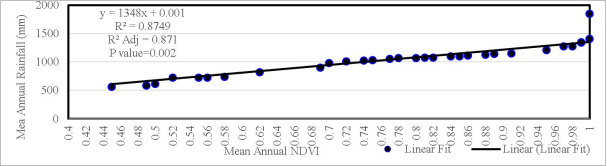
Figure 16. Shows the correlation b/n mean annual rainfall and mean annual NDVI.
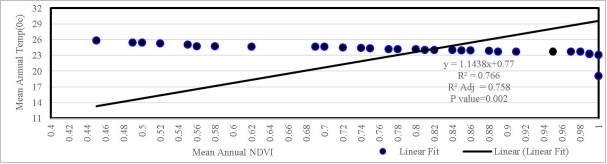
Figure 17. Shows the correlation b/n mean temperature and mean NDVI.
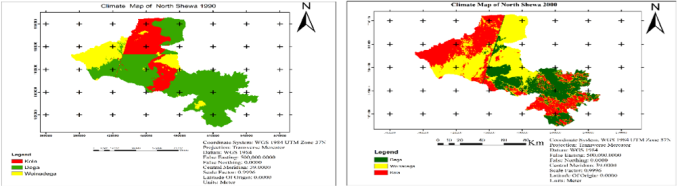
Figure 18. The climatic classification using RSCCI for year 1990 and 2000.
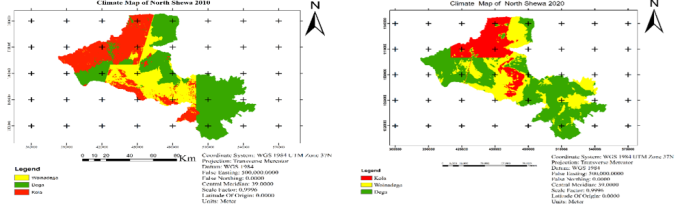
Figure 19. The climatic classification using RSCCI for year 2010 and 2020.
Information

