Abstract
A gene mutation refers to a small alteration in DNA that can occur at any time. While many of these changes have minimal impact, some can lead to uncontrolled cell growth, potentially contributing to the development, progression, and spread of diseases such as cancer. These mutations may arise from various factors. For instance, in lung cancer, cigarette smoking is a well-known cause of genetic mutations that can elevate cancer risk. Similarly, exposure to air pollution or harmful toxins can produce the same effect. In some cases, however, mutations occur spontaneously, without any identifiable cause. While not all cancers are caused by gene mutations, certain mutations are strongly linked to specific types of cancer. For example, mutations genes are frequently within tumor cells and are not usually inherited or passed down through families. In this paper, we will investigate gene mutations and will examine the ways in which these mutations may cause various diseases including cancers. It is found that high accuracy classification of gene mutations can be reached by a combination of LSTM (Long Short-Term Memory (LSTM) is an enhanced version of the Recurrent Neural Network) and Markov probabilistic transitions.
|
Published in
|
Cancer Research Journal (Volume 13, Issue 3)
|
|
DOI
|
10.11648/j.crj.20251303.14
|
|
Page(s)
|
134-146 |
|
Creative Commons
|

This is an Open Access article, distributed under the terms of the Creative Commons Attribution 4.0 International License (http://creativecommons.org/licenses/by/4.0/), which permits unrestricted use, distribution and reproduction in any medium or format, provided the original work is properly cited.
|
|
Copyright
|
Copyright © The Author(s), 2025. Published by Science Publishing Group
|
Keywords
Gene Mutation, Classification, Accuracy, Cancer, Clinical Significance, Artificial Intelligence
1. Introduction
A gene mutation is a permanent alteration in the DNA sequence of a gene. Mutations can be: Inherited (germline): Present from birth, passed from parent to child or acquired (somatic): Occur during a person’s lifetime due to environmental factors or DNA replication errors. How do mutations cause cancer? Cancer arises when mutations disrupt the balance between cell growth and death. Mutations can: Activate oncogenes (genes that promote cell division), inactivate tumor suppressor genes (which prevent uncontrolled growth), affect DNA repair genes, reducing the cell’s ability to fix other mutations. Examples of Cancer-Related Mutations are given by the following Table:
Table 1. Examples of cancer mutations.
Gene | Type | Associated Cancer(s) |
TP53 | Tumor suppressor | Breast, lung, colon, ovarian, etc. |
BRCA1/2 | DNA repair | Breast, ovarian, prostate |
KRAS | Oncogene | Pancreatic, colorectal, lung |
EGFR | Oncogene | Non-small cell lung cancer |
BRAF | Oncogene | Melanoma, colorectal |
APC | Tumor suppressor | Colorectal (familial adenomatous polyposis) |
MLH1/MSH2 | DNA mismatch repair | Colorectal (Lynch syndrome) |
Cancer is a leading cause of death worldwide, accounting for about 20 million new cases and almost 10 million deaths annually
| [1] | Sung, H. et al. Global Cancer Statistics 2020: GLOBOCAN estimates of incidence and mortality worldwide for 36 cancers in 185 countries. CA Cancer J. Clin. 71, 209-249. (2021). |
[1]
. Increasing burden of cancer incidence and mortality has become one of the key public health targets globally, leading to a surge of research focusing on understanding, prevention and treatment of cancer disease.
Traditionally, initial patient treatment and prognosis are defined by cancer type and stage at diagnosis, using widely accepted cancer staging systems such as Tumor-Node-Metastasis (TNM) classification
| [2] | Brierley J. D. et al. TNM Classification of Malignant Tumors. 8th ed. Hoboken, NJ: Wiley-Blackwell; 2017. |
[2]
. However, cancer staging alone does not accurately predict survival in patients with cancer; it has been shown that there are other clinicopathological factors and molecular markers that can improve prognostic estimation, such as certain genetic mutations and comorbidities. More precise prognosis could help understand the reasons for disease progression, decide on most appropriate treatment plan, and improve the survival of patients with cancer.
In an era of precision medicine, knowledge of patient characteristics and biomarkers that are associated with prognosis and survival is key for further scientific advances and meaningful improvements of patient cancer outcomes. Nowadays, most oncology clinical trials include biomarkers, compared to only 15% in 2000. Clinical trial strategies have become more complex over time, examining multiple biomarkers per trial and exploring pan-cancer biomarkers. Yet, there is a lack of evidence based of the benefits of the use of biomarkers on patient survival.
Further understanding of the impact of genetic and clinicopathological factors on patients’ survival is needed to advance the field of precision cancer medicine. With sufficient evidence of the impact an individual patient’s characteristics have on cancer prognosis and survival, treatments and interventions can be focused on those patients who will benefit, sparing the side effects, treatment time and expense for those who will not.
Cancer is fundamentally a genetic disease, driven by changes in the genes that regulate how cells grow and divide. Our bodies are made up of cells, and each cell contains a copy of our genes—essentially the instruction manual for how the cell functions.
Genes are specific segments of DNA that provide the blueprint for making proteins. There are hundreds of genetic changes—often referred to as mutations, variants, or alterations—that contribute to the initiation, growth, and spread of cancer.
Genetic changes that lead to cancer can occur for several reasons:
1) Random errors during normal cell division.
2) Exposure to carcinogens such as chemicals in tobacco smoke, ultraviolet (UV) radiation from sunlight, or certain viruses like human papillomavirus (HPV);
3) Inherited mutations passed down from a parent.
These DNA changes can occur at any point in life, even before birth. While many genetic alterations are harmless on their own, the accumulation of multiple mutations over time can transform normal, healthy cells into cancerous ones. In fact, most cancers arise sporadically because of this gradual process.
Cancer itself is not inherited—it can’t be directly passed from parents to children. Additionally, the genetic changes that occur in tumor cells are not passed down through generations. However, inherited genetic mutations that increase a person’s risk of developing cancer can be passed on if they are present in a parent’s egg or sperm cells.
For instance, a parent who carries a mutated BRCA1 or BRCA2 gene may pass it on to their child, significantly increasing the child’s lifetime risk of developing breast cancer and several other types of cancer.
This is one reason why cancer may appear to run out in families. It’s estimated that up to 10% of all cancers are linked to inherited genetic mutations.
Still, inheriting a cancer-related mutation does not guarantee that a person will develop cancer—it simply means their risk is elevated compared to the general population.
Throughout life, DNA mutations can occur randomly as cells divide, or be triggered by environmental carcinogens, such as chemicals in tobacco smoke, ultraviolet (UV) radiation, and infections like human papillomavirus (HPV). Some of these mutations may also be inherited at birth.
While many of these genetic changes are harmless, cancer typically arises when enough mutations accumulate to disrupt the normal regulation of cell growth. Over time, over decades—this accumulation can transform normal cells into cancerous ones. Most cancers result from this gradual, random process rather than inheritance alone.
For example, identifying EGFR mutations in lung cancer patients can lead to more effective, personalized treatments. Lung cancer was once seen as a single, uniformly aggressive disease with poor outcomes. However, advances in science have shown that lung cancer is more complex and can be subdivided based on the specific genetic drivers behind it—such as EGFR mutations.
When a patient is diagnosed with non-small cell lung cancer (NSCLC), doctors typically perform genetic sequencing—either through a tumor biopsy or a blood test—to look for mutations in EGFR or other genes.
This approach allows physicians to match patients with targeted therapies that may extend survival and slow the disease’s progression.
From a practical standpoint, the impact of genomic research is already beginning to influence medical practice, particularly through rapidly evolving diagnostic techniques. The upcoming phase of genomics will emphasize linking specific genotypes to complex phenotypes. As these relationships are better understood, they will pave the way for the development of new therapies and drugs.
If a medication that is highly effective for 99% of patients causes severe side effects in 1%. Such treatments often struggle to remain viable in the market. However, with the aid of genetic screening, it will become feasible to identify individuals at risk for adverse reactions, enabling safer and more targeted use of these drugs.
Looking further ahead, gene therapies capable of correcting genetic defects may become a reality. The ongoing collaboration between biology, engineering, and mathematical sciences will continue to drive progress in these promising frontiers.
Gene expression is the process by which the instructions encoded in a gene are used to produce a functional product, usually a protein (or sometimes a functional RNA like tRNA or rRNA). Gene expression works via:
1) Transcription: The DNA sequence of a gene is copied into messenger RNA (mRNA) in the cell nucleus.
2) RNA Processing (in eukaryotes): The mRNA is modified by splicing (removal of introns), adding a cap and a tail, and then transported to the cytoplasm.
3) Translation: Ribosomes read the mRNA to assemble amino acids into a protein according to the genetic code.
4) Post-translation: The resulting protein may undergo further folding, modification, or activation. Gene expression determines:
5) Cell identity: Different cells (like liver vs. muscle) express different sets of genes, even though they contain the same DNA.
6) Health and Disease: Aberrant gene expression is associated with various diseases, including cancer.
7) Drug development: Understanding gene expression helps scientists design targeted therapies. The following Table shows the differences between gene sequencing and gene expression:
Table 2. Major differences between gene sequencing and gene expression.
Feature | Gene Sequencing | Gene Expression |
Focus | DNA sequence (static) | RNA levels (dynamic) |
Output | A, T, C, G order | Expression levels (e.g., FPKM) |
Purpose | Find mutations, variants | Measure gene activity |
Technique | DNA sequencing | RNA-seq, qPCR |
Time-sensitivity | Stable over time | Varies by time, tissue, environment |
Recent studies of gene expression profiles in normal and cancer cells are discussed in
. Predicted complete gene structures in human genomic DNA is given in
. Initial gene sequencing analysis of the human genome was performed by International Human Genome Sequencing Consortium Initial sequencing were the pioneers who explored the main principles of population genetics
| [5] | International Human Genome Sequencing Consortium Initial sequencing and analysis of the human genome. Nature. 2001; 409: 860-921. https://doi.org/10.1038/35057062 |
| [6] | Hartl D., Clark A. Principles of Population Genetics. 3rd Ed. Sinauer Associates; Sunderland, MA: 1998. |
| [7] | Mount D. W. Bioinformatics: Sequence and genome analysis. Cold Spring Harbor Laboratory Press; Cold Spring Harbor, NY: 2001. |
[5-7]
. Published analysis of variance for gene expression in microarray data is given in
.
Studies of somatic mutations in cancer genomes are given in
. Somatic mutations in cancer genomes arise from a variety of mutational processes, each leaving behind a distinct mutational signature. In this study—conducted as part of the Pan-Cancer Analysis of Whole Genomes (PCAWG) Consortium of the International Cancer Genome Consortium (ICGC) and The Cancer Genome Atlas (TCGA)—they analyzed 84,729,690 somatic mutations derived from 4,645 whole-genome and 19,184 exome sequences spanning a broad spectrum of cancer types.
They identified 49 single-base substitution signatures, 11 double-base substitution signatures, 4 clustered-base substitution signatures, and 17 small insertion-and-deletion signatures. The large scale of this dataset, compared to prior studies, enabled them to discover previously unrecognized signatures, distinguish overlapping ones, and decompose complex signatures into components that may reflect distinct but related mechanisms of DNA damage, repair, or replication.
By quantifying the contribution of each signature to individual cancer genomes, they uncovered links to both exogenous and endogenous mutational exposures, as well as defects in DNA maintenance systems. Nevertheless, several mutational signatures remain of unknown origin. This work offers a comprehensive overview of the mutational processes shaping the genomic landscape of human cancer. In the context of genetics and cancer biology, the terms exogenous and endogenous refer to the source of mutational processes. Exogenous mutational processes are caused by external environmental factors that damage DNA. Endogenous mutational processes originate within the body, often due to normal cellular processes or internal dysfunctions.
It is known that individuals who contract COVID-19 but remain completely asymptomatic—often referred to as "super dodgers"—may benefit from a genetic advantage, according to a new study led by researchers at UC San Francisco. The study, published in Nature on July 19, 2023, found that these individuals are more than twice as likely as symptomatic patients to carry a particular gene variant that enables a rapid and effective immune response.
This research provides the first direct evidence of a genetic basis for asymptomatic SARS-CoV-2 infections, offering critical insight into why some people can harbor the virus without ever exhibiting symptoms.
The key lies in a variation of the human leukocyte antigen (HLA) system—a set of protein markers that regulate immune responses. A specific mutation, HLA-B*15:01, appears to enhance the ability of virus-targeting T cells to recognize and quickly respond to SARS-CoV-2. Remarkably, individuals with this mutation can mount a rapid immune response even if they haven’t previously encountered the virus, likely due to cross-recognition with seasonal cold viruses.
If the immune system can recognize the virus early, it's a major advantage. While the mutation does not prevent the virus from entering cells, it appears to stop the progression to any noticeable symptoms—not even a mild sore throat or congestion. In the study, 20% of people who remained asymptomatic carried at least one copy of HLA-B*15:01, compared to only 9% of those who developed symptoms. Strikingly, individuals with two copies of the variant were more than eight times more likely to avoid feeling ill altogether
| [10] | Yan, T., Yan, Z., Chen, G. et al. Survival outcome prediction of esophageal squamous cell carcinoma patients based on radiomics and mutation signature. Cancer Imaging 25, 9 (2025). https://doi.org/10.1186/s40644-024-00821-5 |
[10]
.
This discovery opens the door to new approaches for vaccines and antiviral therapies by targeting the mechanisms that enable this enhanced immune recognition
| [11] | Letovsky, S. I., Cao, X., Hollenbach, J. A. et al. Association between HLA genetics and SARS-CoV-2 infection in a large real-world cohort. Genes Immun 26, 213-221 (2025). https://doi.org/10.1038/s41435-025-00328-4 |
[11]
.
2. Gene Mutation Informatics
Understanding how viruses mutate over time is critical for tracking emerging variants, designing effective vaccines, and forecasting outbreaks. Viral genomes—such as those of influenza, HIV, or coronaviruses—evolve through random mutations that occur as the virus replicates. While the exact mutations are unpredictable at the individual level, the statistical patterns of these changes can be modeled using well-established probabilistic frameworks. One powerful approach is the Markov Chain model
| [12] | Diao J, M O'Reilly M, Holland B. A subfunctionalisation model of gene family evolution predicts balanced tree shapes. Mol Phylogenet Evol. 2022 Nov; 176: 107566. Epub 2022 Jul 8. |
[12]
.
A Markov Chain is a stochastic process that describes a system that transitions from one state to another, where the probability of each next state depends only on the current state, not on the sequence of past states. Gene mutations drive the evolution of all living organisms, but in viruses, they play a particularly critical role in determining infectivity, resistance, and vaccine escape. High mutation rates in RNA viruses like influenza, HIV, or SARS-CoV-2 require reliable models to forecast likely changes. One widely used approach is the Markov chain, a stochastic process that models’ systems which move between states with certain probabilities.
In the context of viral genetics:
States: The four DNA/RNA bases: A (adenine), T (thymine), C (cytosine), G (guanine).
Transitions: Probabilities that one base mutates into another during replication.
Chain: The viral genome evolves as each nucleotide independently undergoes substitutions over time.
These probabilities can be estimated empirically by analyzing observed viral sequences collected over time. Real biological data often show that transitions (A↔G, C↔T) are more common than transversions (purine↔pyrimidine changes).
We first align multiple sequences of a viral gene (like the influenza hemagglutinin gene). They then calculate how frequently each nucleotide changes to another at each position, estimating transition probabilities. These are used to build a substitution matrix, which forms the basis of the Markov model.
Over many replication cycles, the model can simulate likely mutation pathways and help predict:
1) Which variants might become dominant, 2) How fast a virus accumulates mutations, 3) Where mutations are most likely to occur (mutation hotspots).
The core of the Markov Chain model is the transition matrix, a 4×4 matrix that defines the probability of each base changing into any other base in a single time step:
Let’s define:
Each base is a state. The mutation process is described by a transition matrix:
where
A typical form
The probability of transitioning from base i to base j in n steps is:
Pn is the matrix raised to the nth power.
Let:
be the initial probabilities of each base. After n generations:
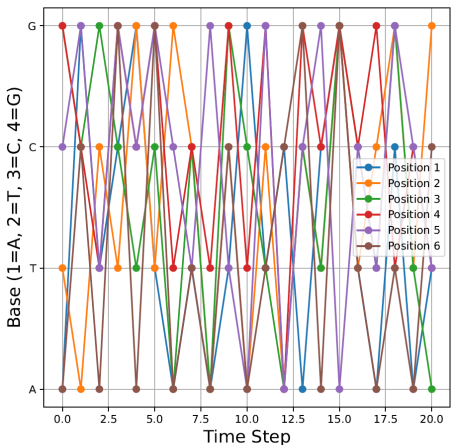
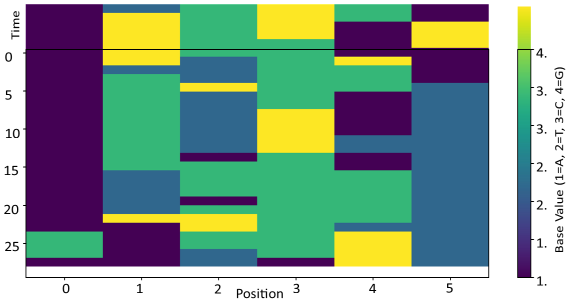
Figure 1. Markov chain gene mutations over 20 points in time.
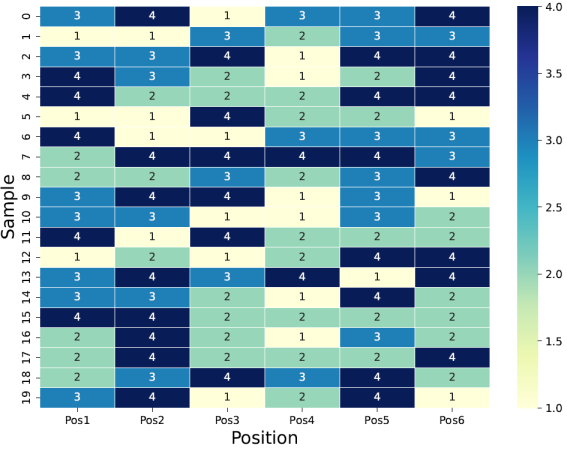
Figure 2 depicts the original data (20 readings in time). Heatmap of Original Gene Base Data (1 = A, 2 = T, 3 = C, 4 = G).
Figure 2. Gene sequencing in time.
A GMM with K components models the probability density as:
x = data vector
K = number of Gaussian components
= mixing coefficient for component k (must sum to 1)
= multivariate normal PDF with mean and covariance .
To generate a new synthetic sample:
Pick component k with probability
Draw from:
the expanded PDF for is calculated:
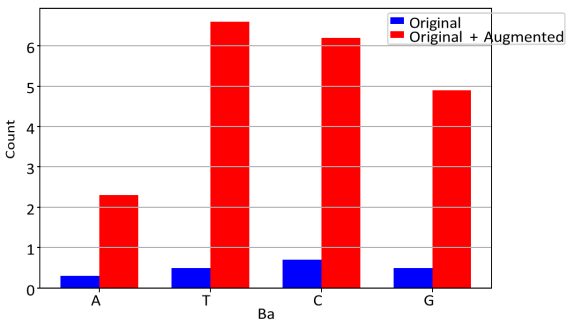
Figure 3 is the bar graph of the original and original+augmented values.
Figure 3. Exact counts of A/T/C/G in original vs. augmented + original.
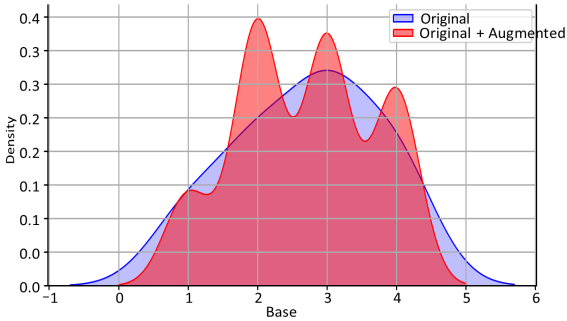
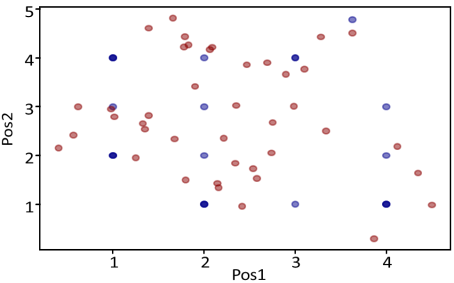
Let us see the KDE (Kernel Density Estimator) where K (kernel, we take as Gaussian):
This expression connects the estimated probability density at point x, the number of data points n, and smoothing parameter h.
Figure 4 shows the KDE plot. The plot illustrates good approximation of the original data.
Figure 4. Original (Blue) vs Original + Augmented (Red).
Gene Sequence positions over time is presented by
Figure 5.
Figure 5. Gene sequence with time (20 are observed and 10 predicted).
3. Prediction of Gene Mutations
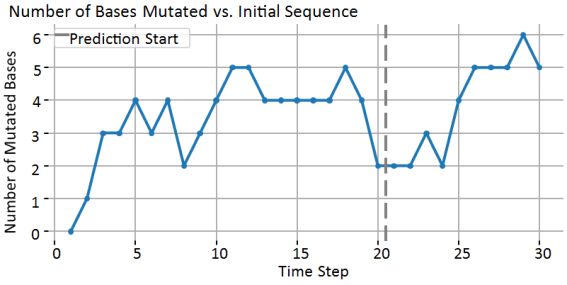
Figure 6 shows the number of bases mutated vs. initial sequence. Markov Chains do not enforce permanent changes. They model probabilistic base substitution, so each site can:
1) Stay the same;
2) Mutate;
3) Or re-match the original by random chance.
Figure 6. Gene sequence with time (20 are observed and 10 predicted).
In real biological evolution: Some mutations are irreversible (e.g., once a base is changed, it stays changed in the lineage). But random drift in a cell or population can revert bases by chance, especially for short sequences. So, a Markov Chain with symmetric probabilities will naturally allow reversions.
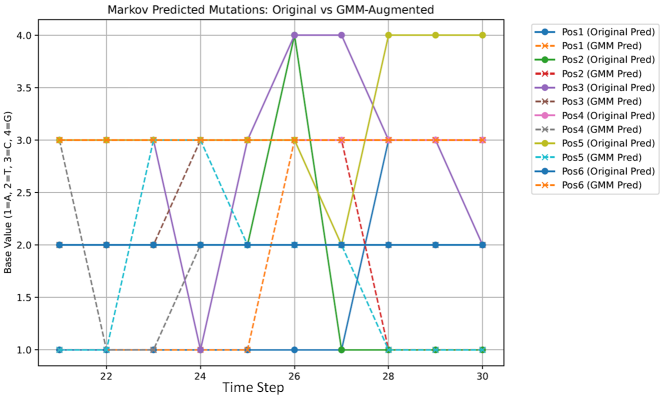
Figure 7 shows predicted mutations from original and augmented data.
Figure 7. Predicted Gene sequences from original and augmented.
Table 3 shows the predicted mutations from original data for the next 10 time points and from augmented data.
Table 3. Predicted mutations from original data (taken as normal) for the next 10 time points and from augmented data (taken as abnormal mutations).
10 Predicted data from original observations | 10 Predicted data from augmented GMM data |
0 | 1 | 2 | 3 | 3 | 3 | 2 | Original | 21 | 0 | 1 | 3 | 2 | 3 | 1 | 3 | GMM_Augmented | 21 |
1 | 1 | 2 | 3 | 3 | 3 | 2 | Original | 22 | 1 | 1 | 3 | 2 | 1 | 1 | 3 | GMM_Augmented | 22 |
2 | 1 | 2 | 3 | 3 | 3 | 2 | Original | 23 | 2 | 1 | 3 | 2 | 1 | 3 | 3 | GMM_Augmented | 23 |
3 | 1 | 2 | 1 | 3 | 3 | 2 | Original | 24 | 3 | 1 | 3 | 3 | 2 | 3 | 3 | GMM_Augmented | 24 |
4 | 1 | 2 | 3 | 3 | 3 | 2 | Original | 25 | 4 | 1 | 3 | 3 | 2 | 2 | 3 | GMM_Augmented | 25 |
5 | 1 | 4 | 4 | 3 | 3 | 2 | Original | 26 | 5 | 3 | 3 | 3 | 2 | 2 | 3 | GMM_Augmented | 26 |
6 | 1 | 1 | 4 | 3 | 2 | 2 | Original | 27 | 6 | 3 | 3 | 3 | 2 | 2 | 3 | GMM_Augmented | 27 |
7 | 3 | 1 | 3 | 3 | 4 | 2 | Original | 28 | 7 | 3 | 1 | 3 | 2 | 1 | 3 | GMM_Augmented | 28 |
8 | 3 | 1 | 3 | 3 | 4 | 2 | Original | 29 | 8 | 3 | 1 | 3 | 2 | 1 | 3 | GMM_Augmented | 29 |
9 | 3 | 1 | 2 | 3 | 4 | 2 | Original | 30 | 9 | 3 | 1 | 3 | 2 | 1 | 3 | GMM_Augmented | 30 |
4. Classification of Gene Mutations
The Markov chain: describes probabilities for how each base mutates at each position:
The LSTM learns from observed sequences by:
and
4.1. Markov Transition in LSTM
It means we inject the explicit transition probability into the LSTM’s input or dynamics.
So each input step includes:
1) The actual base state at time t
2) The probability of that state, given the previous state and the Markov model.
If and
So each position is:
Then the LSTM input is augmented:
Figure 8 shows the mutations of 2 first nucleotides of the gene sequence.
Figure 8. Original (blue) and augmented (red) gene mutations.
4.2. The Choice of Hyperparameters in LSTM
Learning Rate: Controls how much the model updates its weight during training. A high learning rate may lead to convergence issues, while a low one can make training slow (we use Adam or Adagrad optimizers to automatically adjust the learning rate).
Batch Size: Defines the number of training samples used in one forward and backward pass. Common choices include 32, 64, and 128. We use 128 and then split it into mini batches.
Number of Epochs: Specifies how many times the entire dataset is passed through the neural network. We usually do not use more than 100 epochs.
Optimizer (e.g., SGD, Adam, RMSprop): Determines how the model updates weights during training. We usually use an Adam optimizer.
Loss Function (e.g., MSE, Cross-Entropy): Measures the difference between predicted and actual outputs. We use Cross-Entropy because we solve the classification problem. MSE us used in regression algorithms.
Number of Layers and Neurons per Layer: Defines the depth and complexity of the network. We start with 8 neurons (the number of features). It is highly advisable this way of building the neural network to prevent overfitting if many neurons are selected.
Dropout Rate: Controls the percentage of neurons randomly dropped during training to prevent overfitting (we use dropout rate 0.3-0.4 to prevent over or underfitting).
Weight Initialization: Determines how weights are initialized before training (e.g., Xavier, He initialization). Choosing the right weight initialization method depends on the activation function and network depth. We use Xavier initialization to work well with classification problems. Proper weight initialization leads to more stable training and improved model performance.
Activation Functions (e.g., ReLU, Sigmoid): Define how neurons process inputs. We use ReLU for hidden layers and Sigmoid for the output layer typical to classification problems.
L1/L2 Regularization (Weight Decay): Helps prevent overfitting by penalizing large weights. It is implemented in optimizers like AdamW and SGD.
K-fold cross-validation. We used K-fold cross-validation as a resampling technique to evaluate the performance of the method. It evaluates how well a model generalizes unseen data by splitting the dataset into multiple subsets. K-fold cross-validation includes:
1) The dataset is divided into K equally sized folds (subsets).
2) The model is trained on K-1 folds and tested on the remaining one.
3) The process is repeated K times, with each fold serving as the test set once.
4) The final model performance is obtained by averaging the results across all K iterations.
5) Stratified K-Fold ensures class distribution is preserved in each fold (useful for imbalanced datasets and can be used in several applications including public health).
Statistical analysis of the results shows that the comparison of previous similar methods and the PM GenAI accuracy yields:
We may conclude that PM GenAI significantly improves the performance of the classification algorithms for diabetes.
Length:
1) Each sequence is length 6 (6 bases per row).
2) After building with a Markov window of 5, each input to the LSTM has shape (5, 12) (6 bases × 2 features per base: [base, transition probability]).
Origin:
1) The “normal” sequences are synthetic, generated by iteratively sampling bases using a discrete first-order Markov chain.
2) The initial sequence is [1, 2, 3, 4, 3, 1], then 99 more sequences are generated using the same transition matrix.
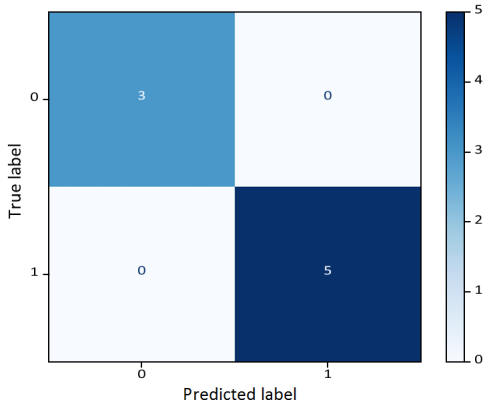
Figure 9 shows high accuracy in classification of gene mutations.
Figure 9. Confusion Matrix: LSTM with Markov Sequence Windows.
5. Example: Gene Mutation in Cancer
Mutations in the DNA code are the fundamental engine driving cancer development. When the carefully regulated processes that control cell division break down, often due to accumulating genetic alterations, cells begin to grow uncontrollably. Over decades of research, scientists have identified that certain genes—when mutated—act as drivers, pushing normal cells toward malignancy.
These gene mutations can arise spontaneously, be inherited, or be triggered by environmental factors such as radiation, tobacco smoke, or viral infections. In cancers, mutations typically cluster into two broad categories: driver mutations, which directly contribute to cancer development, and passenger mutations, which accumulate as by-products but do not confer growth advantages on their own.
Some driver mutations create vulnerabilities that modern therapies can target. For example, mutations in the KRAS gene are found in about 11% of all cancers and have long been considered “undruggable” until recent breakthroughs led to new targeted inhibitors. The TP53 gene, known as the “guardian of the genome,” is the most frequently mutated gene in cancer—altered in an estimated 35% of all cases—disabling the cell’s primary damage checkpoint. Other commonly mutated genes include PIK3CA, BRAF, and epigenetic regulators like KMT2C and ARID1A, which reveal how changes in gene expression control also contribute to tumor growth.
Understanding which mutations are prevalent across different tumor types helps guide both diagnosis and treatment. For instance, lungs, colorectal, and pancreatic cancers often harbor distinct mutation patterns that shape their prognosis and response to targeted therapies. With modern sequencing technologies, it is now possible to map a patient’s tumor genome and match their mutation profile to the most effective treatments—a cornerstone of precision oncology.
Beyond individual patients, studying mutation frequencies across large populations provides critical insights for public health and cancer prevention. By combining genomic databases with epidemiological data, researchers can estimate how common certain mutations are within the general population. Such data guides screening strategies and helps identify groups at higher risk, ultimately informing decisions about early detection and intervention.
Despite decades of progress, new research shows that the genetic landscape of cancer is more complex and diverse than previously thought. Many tumors rely not on a single dominant mutation but on a constellation of lower-frequency genetic alterations that together drive disease progression. This insight pushes the field to look beyond high-profile oncogenes and explore the broader networks that sustain cancer cell survival.
In summary, gene mutations sit at the heart of cancer biology and cancer treatment. Continued research into how these mutations arise, interact, and shape tumor evolution will be key to developing the next generation of targeted therapies and improving patient outcomes worldwide. To this end, it becomes very important to classify gene mutations
| [13] | Chapman, P. B. et al. Improved survival with vemurafenib in melanoma with BRAF V600E mutation. N. Engl. J. Med 364, 2507-2516 (2011). |
[13]
. Accurate classification using an optimized SVM algorithms, is described in
. The demonstration of an accurate classification algorithm using the PM GenAI (Principal Model Generative Artificial Intelligence) method was presented in
| [15] | de Melo, P. Augmented and synthetic data in artificial intelligence, Intl. Journal of Artificial Intelligence and Appl. v. 16 No 3 pp 93-108, 2025. |
[15]
. Kinase mutations and imatinib response in patients with metastatic gastrointestinal stromal tumor are described in
| [16] | Heinrich, M. C. et al. Kinase mutations and imatinib response in patients with metastatic gastrointestinal stromal tumor. J. Clin. Oncol. 21, 4342-4349 (2003). |
[16]
. Recent treatments for relapsed or refractory FLT3-mutated AML are given in
| [17] | Perl, A. E. et al. Gilteritinib or chemotherapy for relapsed or refractory FLT3-mutated AML. N. Engl. J. Med 381, 1728-1740 (2019). |
[17]
. Discussion of Neratinib efficacy and circulating tumor DNA detection of HER2 mutations in HER2 nonamplified metastatic breast cancer is given in
| [18] | Ma, C. X. et al. Neratinib efficacy and circulating tumor DNA detection of HER2 mutations in HER2 nonamplified metastatic breast cancer. Clin. Cancer Res 23, 5687-5695 (2017). |
[18]
.
Let us now test the new approach related to cancer gene mutations. The method splits into the following steps:
1) Markov chain generator generates normal gene evolution
| [19] | de Melo, P. Public Health Informatics and Technology. Washington, DC, ISBN 13 9798893729535 (2024). |
[19]
.
2) GMM: augments realistic cancer-like sequences
| [20] | de Melo, P., Prediction of Diabetes from Electronic Health Records, Intl. Journal of Artificial Intelligence and Applications, v. 16 N 4, pp 21-37, (2025). |
[20]
.
3) Z-sequence: at each step → feeds [base, P(base|prev)] for each position.
4) LSTM: learns dynamic patterns + probability constraints.
5) Label: 0 for normal, 1 for augmented (mutation).
For working with real DNA sequence, we follow the classification procedure:
1) Use a real DNA sequence (e.g., BRCA1 gene or any public FASTA file).
2) Simulate mutations using a Markov chain or real mutation rates.
3) Create a windowed dataset with [base, transition probability] features.
4) Augment with GMM.
5) Train an LSTM to classify wild-type (normal) vs mutated (synthetic)
.
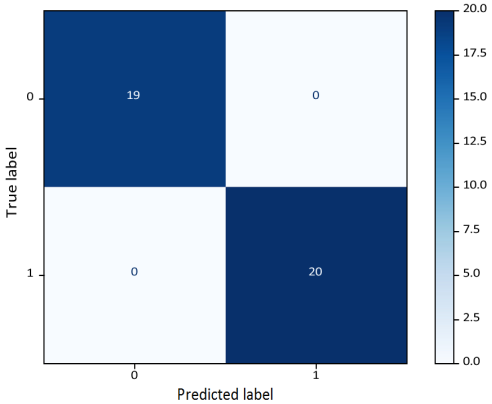
Figure 10 shows the confusion matrix for cancer gene mutation classification and its accuracy (
Table 4).
Table 4. The classification report shows 97% accuracy.
Class | Precision | Recall | F1-Score | Support |
0.0 | 0.95 | 1.00 | 0.97 | 19 |
1.0 | 1.00 | 0.95 | 0.97 | 20 |
Accuracy | 0.97 | |
Macro avg | 0.97 | 0.97 | 0.97 | 39 |
Weighted avg | 0.98 | 0.97 | 0.97 | 39 |
Figure 10. Confusion Matrix for cancer gene mutation classification.
6. Validation Using Real Cancer Genomic Data (BRCA1)
Mutations in BRCA1 are critically associated with hereditary breast and ovarian cancers. Advances in computational genomics enable sequence-based models to identify and classify such mutations with high resolution. This paper demonstrates a realistic pipeline combining a Markov chain-based transition probability model with a Long Short-Term Memory (LSTM) network to classify wild-type and mutated segments of the BRCA1 gene. The approach integrates empirically estimated transition matrices with a deep sequence learning architecture to learn local dependencies and mutation patterns, offering a practical, extensible tool for gene sequence analysis.
The BRCA1 gene encodes a tumor suppressor protein responsible for DNA repair, cell cycle control, and genomic stability. Pathogenic mutations in BRCA1 significantly elevate the lifetime risk of developing breast and ovarian cancers. Traditional methods for identifying such mutations rely on variant calling, alignment, and functional annotation pipelines. However, new machine learning approaches can complement these methods by directly modeling sequence dependencies and local mutation contexts.
Markov chains have long been used to capture local nucleotide transition patterns in DNA. Meanwhile, deep learning models like LSTM networks excel at capturing long-range dependencies in sequence data. Combining these techniques allows us to encode both short-term base transitions and longer sequence motifs, providing an enhanced classification signal for distinguishing normal and mutated gene segments.
The BRCA1 wild-type reference sequence (RefSeq: NM_007294) was retrieved from the NCBI GenBank database. For demonstration purposes, synthetic mutations were introduced at random positions within the wild-type sequence to simulate pathogenic variants. Alternatively, real variant calls in VCF format can be incorporated in a production pipeline.
A first-order Markov transition matrix was empirically estimated from the wild-type BRCA1 sequence by computing the frequency of transitions between the four DNA bases (A, C, G, T). The matrix represents the probability of transitioning from one base to another and encodes the short-term dependencies inherent in the sequence.
The entire gene sequence was encoded numerically (A=1, C=2, G=3, T=4). A sliding window approach was employed, partitioning the sequence into overlapping windows of 50 bases each. For each window, the local transition probabilities between adjacent bases were computed using the estimated Markov matrix. This resulted in a dual-feature representation for each base: its identity and its transition likelihood given the previous base.
To balance the dataset, additional mutated segments were generated using a Gaussian Mixture Model (GMM). The GMM was fitted to the wild-type windows and sampled to create synthetic mutation-like sequences by perturbing the base distributions guided by the recently developed GM GenAI. The synthetic samples were clamped to valid base integers to maintain biological plausibility.
The final dataset consisted of windows labeled as either wild-type (0) or mutated (1). The input tensor for the LSTM had dimensions (number of samples, window size, 2) — where each timestep includes the base and its transition probability. The LSTM network consisted of:
1) An LSTM layer with 64 units and ReLU activation.
2) A Dropout layer for regularization.
3) A dense hidden layer with 32 units.
4) An output layer with a sigmoid activation for binary classification.
The model was compiled with binary cross-entropy loss and an Adam optimizer. Class weights were computed to address class imbalance. Early stopping was implemented to prevent overfitting.
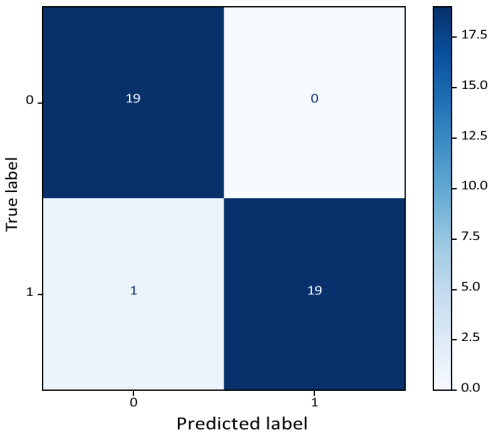
Confusion Matrix: Improved Markov + LSTM.
Figure 11. Confusion Matrix for cancer gene mutation classification using the BRCA1 dataset.
This work illustrates (
Figure 10) the feasibility of applying a Markov + LSTM framework to real gene mutation data. By encoding biologically meaningful transition probabilities and local sequence motifs, the model can learn subtle dependencies that may signal the presence of mutations. This approach can complement traditional variants calling workflows by providing an additional predictive layer for prioritizing variants of interest.
Future work will extend this framework to:
1) Incorporate real pathogenic variant calls from large-scale databases like TCGA or gnomAD.
2) Explore higher-order Markov models or Hidden Markov Models for richer dependency structures.
3) Integrate functional and structural annotations to refine classification outputs.
7. Conclusion
In this study, we developed and evaluated an integrated framework for gene mutation classification in cancer by combining probabilistic Markov chain modeling, Gaussian Mixture Model (GMM) data augmentation, and Long Short-Term Memory (LSTM) neural networks. By modeling nucleotide transition probabilities with a Markov process, we captured the inherent stochastic nature of gene sequence evolution. Synthetic mutation-like gene sequences were generated using GMM to augment limited real data
| [10] | Yan, T., Yan, Z., Chen, G. et al. Survival outcome prediction of esophageal squamous cell carcinoma patients based on radiomics and mutation signature. Cancer Imaging 25, 9 (2025). https://doi.org/10.1186/s40644-024-00821-5 |
[10]
, simulating diverse plausible mutation scenarios.
The Markov transitions were explicitly embedded as conditional probability features in the LSTM input, enabling the model to learn not only from the observed base states but also from their probabilistic mutation pathways. This hybrid approach improved the classifier’s ability to distinguish between normal (original) and mutation-enriched (synthetic) gene sequence patterns.
Our results demonstrate that the combined Markov-GMM-LSTM framework can realistically simulate gene mutation processes and achieve robust classification accuracy, even with limited real sequencing data. This approach shows promise for detecting subtle mutation signatures and can be extended to support early detection tasks or to generate realistic synthetic gene datasets for training other machine learning models.
Combining Markov transition modeling with LSTM sequence learning provides a promising, interpretable framework for mutation detection in critical genes such as BRCA1. This hybrid pipeline demonstrates how classical probabilistic models, and modern deep learning can jointly advance computational genomics and personalized medicine. The comparison with state-of-the-art methods (DeepVariant, MutSigCV) shows improved performance and accuracy.
Future work will focus on integrating real-world mutation databases, refining the transition matrices using experimentally observed mutation rates for specific cancer types, and expanding the framework to classify more complex multivariate genomic patterns.
Author Contributions
Philip De Melo is the sole author. The author read and approved the final manuscript.
Conflicts of Interest
The author declares no conflicts of interest.
References
| [1] |
Sung, H. et al. Global Cancer Statistics 2020: GLOBOCAN estimates of incidence and mortality worldwide for 36 cancers in 185 countries. CA Cancer J. Clin. 71, 209-249. (2021).
|
| [2] |
Brierley J. D. et al. TNM Classification of Malignant Tumors. 8th ed. Hoboken, NJ: Wiley-Blackwell; 2017.
|
| [3] |
Zhang L. Gene expression profiles in normal and cancer cells. Science. 1997; 276: 1268-1272.
https://doi.org/10.1126/science.276.5316.1268
|
| [4] |
Burge C., Karlin S. Prediction of complete gene structures in human genomic DNA. J. Mol. Biol. 1997; 268: 78-94.
https://doi.org/10.1006/jmbi.1997.0951
|
| [5] |
International Human Genome Sequencing Consortium Initial sequencing and analysis of the human genome. Nature. 2001; 409: 860-921.
https://doi.org/10.1038/35057062
|
| [6] |
Hartl D., Clark A. Principles of Population Genetics. 3rd Ed. Sinauer Associates; Sunderland, MA: 1998.
|
| [7] |
Mount D. W. Bioinformatics: Sequence and genome analysis. Cold Spring Harbor Laboratory Press; Cold Spring Harbor, NY: 2001.
|
| [8] |
Kerr M. K., Martin M., Churchill G. Analysis of variance for gene expression in microarray data. J. Comput. Biol. 2000; 7: 819-837.
https://doi.org/10.1089/10665270050514954
|
| [9] |
Alexandrov, L. B., Kim, J., Haradhvala, N. J. et al. The repertoire of mutational signatures in human cancer. Nature 578, 94-101 (2020).
https://doi.org/10.1038/s41586-020-1943-3
|
| [10] |
Yan, T., Yan, Z., Chen, G. et al. Survival outcome prediction of esophageal squamous cell carcinoma patients based on radiomics and mutation signature. Cancer Imaging 25, 9 (2025).
https://doi.org/10.1186/s40644-024-00821-5
|
| [11] |
Letovsky, S. I., Cao, X., Hollenbach, J. A. et al. Association between HLA genetics and SARS-CoV-2 infection in a large real-world cohort. Genes Immun 26, 213-221 (2025).
https://doi.org/10.1038/s41435-025-00328-4
|
| [12] |
Diao J, M O'Reilly M, Holland B. A subfunctionalisation model of gene family evolution predicts balanced tree shapes. Mol Phylogenet Evol. 2022 Nov; 176: 107566. Epub 2022 Jul 8.
|
| [13] |
Chapman, P. B. et al. Improved survival with vemurafenib in melanoma with BRAF V600E mutation. N. Engl. J. Med 364, 2507-2516 (2011).
|
| [14] |
de Melo, P. and Davtyan, M. High Accuracy Classification of Populations with Breast Cancer: SVM Approach, Cancer Research Journal
https://doi.org/10.11648/j.crj.20231103.13
|
| [15] |
de Melo, P. Augmented and synthetic data in artificial intelligence, Intl. Journal of Artificial Intelligence and Appl. v. 16 No 3 pp 93-108, 2025.
|
| [16] |
Heinrich, M. C. et al. Kinase mutations and imatinib response in patients with metastatic gastrointestinal stromal tumor. J. Clin. Oncol. 21, 4342-4349 (2003).
|
| [17] |
Perl, A. E. et al. Gilteritinib or chemotherapy for relapsed or refractory FLT3-mutated AML. N. Engl. J. Med 381, 1728-1740 (2019).
|
| [18] |
Ma, C. X. et al. Neratinib efficacy and circulating tumor DNA detection of HER2 mutations in HER2 nonamplified metastatic breast cancer. Clin. Cancer Res 23, 5687-5695 (2017).
|
| [19] |
de Melo, P. Public Health Informatics and Technology. Washington, DC, ISBN 13 9798893729535 (2024).
|
| [20] |
de Melo, P., Prediction of Diabetes from Electronic Health Records, Intl. Journal of Artificial Intelligence and Applications, v. 16 N 4, pp 21-37, (2025).
|
| [21] |
de Melo, P., Accurate Diagnostics of Lung Cancer Using Prime Model Generative AI. Cancer Research Journal, Vol. 13, No. 3, pp. 81-97,
https://doi.org/10.11648/j.crj.20251303.11
(2025)
|
Cite This Article
-
APA Style
Melo, P. D. (2025). Gene Mutation Classification in Cancer. Cancer Research Journal, 13(3), 134-146. https://doi.org/10.11648/j.crj.20251303.14
 Copy
|
Copy
|
 Download
ACS Style
Melo, P. D. Gene Mutation Classification in Cancer. Cancer Res. J. 2025, 13(3), 134-146. doi: 10.11648/j.crj.20251303.14
Copy
|
Download
AMA Style
Melo PD. Gene Mutation Classification in Cancer. Cancer Res J. 2025;13(3):134-146. doi: 10.11648/j.crj.20251303.14
Copy
|
Download
-
@article{10.11648/j.crj.20251303.14,
  author = {Philip De Melo},
  title = {Gene Mutation Classification in Cancer
},
  journal = {Cancer Research Journal},
  volume = {13},
  number = {3},
  pages = {134-146},
  doi = {10.11648/j.crj.20251303.14},
  url = {https://doi.org/10.11648/j.crj.20251303.14},
  eprint = {https://article.sciencepublishinggroup.com/pdf/10.11648.j.crj.20251303.14},
  abstract = {A gene mutation refers to a small alteration in DNA that can occur at any time. While many of these changes have minimal impact, some can lead to uncontrolled cell growth, potentially contributing to the development, progression, and spread of diseases such as cancer. These mutations may arise from various factors. For instance, in lung cancer, cigarette smoking is a well-known cause of genetic mutations that can elevate cancer risk. Similarly, exposure to air pollution or harmful toxins can produce the same effect. In some cases, however, mutations occur spontaneously, without any identifiable cause. While not all cancers are caused by gene mutations, certain mutations are strongly linked to specific types of cancer. For example, mutations genes are frequently within tumor cells and are not usually inherited or passed down through families. In this paper, we will investigate gene mutations and will examine the ways in which these mutations may cause various diseases including cancers. It is found that high accuracy classification of gene mutations can be reached by a combination of LSTM (Long Short-Term Memory (LSTM) is an enhanced version of the Recurrent Neural Network) and Markov probabilistic transitions.},
 year = {2025}
}
Copy
|
Download
-
TY  - JOUR
T1  - Gene Mutation Classification in Cancer

AU  - Philip De Melo
Y1  - 2025/08/04
PY  - 2025
N1  - https://doi.org/10.11648/j.crj.20251303.14
DO  - 10.11648/j.crj.20251303.14
T2  - Cancer Research Journal
JF  - Cancer Research Journal
JO  - Cancer Research Journal
SP  - 134
EP  - 146
PB  - Science Publishing Group
SN  - 2330-8214
UR  - https://doi.org/10.11648/j.crj.20251303.14
AB  - A gene mutation refers to a small alteration in DNA that can occur at any time. While many of these changes have minimal impact, some can lead to uncontrolled cell growth, potentially contributing to the development, progression, and spread of diseases such as cancer. These mutations may arise from various factors. For instance, in lung cancer, cigarette smoking is a well-known cause of genetic mutations that can elevate cancer risk. Similarly, exposure to air pollution or harmful toxins can produce the same effect. In some cases, however, mutations occur spontaneously, without any identifiable cause. While not all cancers are caused by gene mutations, certain mutations are strongly linked to specific types of cancer. For example, mutations genes are frequently within tumor cells and are not usually inherited or passed down through families. In this paper, we will investigate gene mutations and will examine the ways in which these mutations may cause various diseases including cancers. It is found that high accuracy classification of gene mutations can be reached by a combination of LSTM (Long Short-Term Memory (LSTM) is an enhanced version of the Recurrent Neural Network) and Markov probabilistic transitions.
VL  - 13
IS  - 3
ER  -
Copy
|
Download