Aim of the Study: Early detection of chronic kidney disease (CKD) remains a clinical challenge. Current diagnostic parameters often identify renal dysfunction only after significant parenchymal damage has occurred. This study introduces the Reverse Hepatorenal Index (RHI), a novel ultrasound-based parameter designed to detect early chronic renal parenchymal changes and evaluates the diagnostic accuracy of the Reverse Hepatorenal Index in detecting early chronic renal parenchymal changes compared to conventional parameters. Material andMethods: A prospective observational study was conducted on 150 participants (75 with early-stage CKD and 75 healthy controls) from January 2025 to May 2025. Ultrasound examinations were performed to measure renal and hepatic echogenicity. The RHI was calculated as the below normal values of the ratio of hepatic cortical echogenicity to renal cortical echogenicity. Serum creatinine, estimated glomerular filtration rate (eGFR), and urinary biomarkers were measured for comparison. Results: The mean RHI was significantly lower in patients with early CKD (0.78 ± 0.12) compared to healthy controls (1.15 ± 0.09) (p<0.001). RHI demonstrated a sensitivity of 86.7% and specificity of 90.7% for detecting early renal parenchymal changes at a cut-off value of 0.92. The area under the ROC curve for RHI (0.924) was superior to serum creatinine (0.756) and comparable to eGFR (0.889). Conclusion: The Reverse Hepatorenal Index represents a promising non-invasive parameter for early detection of chronic renal parenchymal changes. Its superior performance compared to traditional markers suggests potential clinical utility in CKD screening and monitoring.
This is an Open Access article, distributed under the terms of the Creative Commons Attribution 4.0 International License (http://creativecommons.org/licenses/by/4.0/), which permits unrestricted use, distribution and reproduction in any medium or format, provided the original work is properly cited.
Chronic kidney disease (CKD) represents a significant global health burden, affecting approximately 10- 15% of the adult population worldwide
[1]
Global Burden of Disease Chronic Kidney Disease Collaboration. Global, regional, and national burden of chronic kidney disease, 1990-2017: a systematic analysis for the Global Burden of Disease Study 2017. Lancet. 2020; 395(10225): 7 09-733.
[1]
. Early detection of CKD is crucial for implementing interventions that can slow disease progression and prevent end-stage renal disease. However, conventional diagnostic parameters such as serum creatinine and estimated glomerular filtration rate (eGFR) often fail to identify renal dysfunction until substantial nephron loss has occurred
[2]
Levey AS, Stevens LA, Schmid CH, et al. A new equation to estimate glomerular filtration rate. Ann Intern Med. 2009; 150(9): 604-612.
[2]
. Ultrasound examination has emerged as a valuable tool in evaluating renal morphology and structure. Changes in renal cortical echogenicity have been associated with various pathological processes, including chronic inflammation, fibrosis, and tubular atrophy
[3]
Manley JA, O'Neill WC. How echogenic is echogenic? Quantitative acoustics of the renal cortex. Am J Kidney Dis. 2001; 37(4): 706-711.
[3]
. The normal kidney typically appears hypoechoic or isoechoic compared to the adjacent liver parenchyma. However, increased renal cortical echogenicity, often described as "medical renal disease," is a non-specific finding observed in various chronic renal conditions
. The concept of comparing renal and hepatic echogenicity has been utilized in clinical practice, but primarily in a qualitative manner. Previous studies have suggested that quantitative assessment of echogenicity differences between organs may provide more objective and reproducible results
[5]
Moghazi S, Jones E, Schroepple J, et al. Correlation of renal histopathology with sonographic findings. Kidney Int. 2005; 67(4): 1515-1520.
[5]
. The hepatorenal index, traditionally defined as the ratio of renal to hepatic echogenicity, has shown promise in detecting renal pathology
[6]
Khati NJ, Hill MC, Kimmel PL. The role of ultrasound in renal insufficiency: the essentials. Ultrasound Q. 2005; 21(4): 227-244.
[6]
. This study introduces a novel parameter, the Reverse Hepatorenal Index (RHI), calculated as the ratio of hepatic cortical echogenicity to renal cortical echogenicity. We hypothesize that this inverse relationship may provide enhanced sensitivity for detecting early chronic renal parenchymal changes. The reversal of the traditional ratio is based on the observation that early renal parenchymal disease often manifests as subtle increases in cortical echogenicity, which may be more apparent when the liver serves as the numerator in the calculation. The primary objective of this study is to evaluate the diagnostic accuracy of the RHI in detecting early chronic renal parenchymal changes and to compare its performance with conventional parameters including serum creatinine, eGFR, and urinary biomarkers.
2. Methods
2.1. Study Design and Population
This prospective observational study was conducted at our institute from January 2025 to May 2025. The study protocol was approved by the Institutional Ethics Committee (Protocol No.04/01/2025), and written informed consent was obtained from all participants. A total of 150 participants were enrolled and divided into two groups: Group A: 75 patients with early-stage CKD (Stage 1-2, eGFR 60-90 mL/min/1.73m²) Group B: 75 healthy controls with normal renal function.
Inclusion Criteria: Age 18-65 years For Group A: Diagnosed with CKD Stage 1-2 based on KDIGO guidelines For Group B: No history of renal disease, normal serum creatinine, and eGFR >90 mL/min/1.73m².
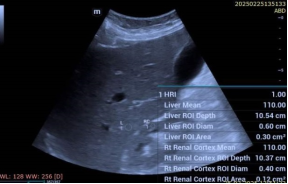
Exclusion Criteria Acute kidney injury, Hepatic disease or abnormal liver function tests, Pregnancy Body mass index >35 kg/m², Poor ultrasound image quality Ultrasound examination. All ultrasound examinations were performed using a high-resolution ultrasound system (Resona i9, Mindray) with a 2-5 MHz convex transducer. Examinations were conducted by two experienced sonographers blinded to clinical data. The following measurements were obtained: 1. Renal cortical echogenicity: Measured at the mid-portion of the kidney, avoiding renal pyramids 2. Hepatic echogenicity: Measured at the right lobe, segment VI, avoiding major vessels 3. Kidney dimensions: Length, width, and cortical thickness. Echogenicity was quantified using Smart Auto grayscale analysis software, with values ranging from 0 (black) to 255 (white) to reduce operator variation. Three measurements were taken for each organ, and the mean value was used for analysis.
Calculation of Reverse Hepatorenal Index: Was done using the standard Hepatorenal index calculation using the formula: HRI = Mean Hepatic Echogenicity / Mean Renal Cortical Echogenicity. The normal ratio was 1-1.1 and was abnormal if more than 1.1. while RHI was considered normal if it was more than 0.95 and was abnormal if less than 0.95 and hence the term reverse hepatorenal index.
Laboratory Investigations The following parameters were measured in all participants: Serum creatinine (enzymatic method) eGFR (calculated using CKD-EPI equation) Urinary albumin-to-creatinine ratio (ACR) Urinary β2-microglobulin Serum cystatin C.
2.2. Statistical Analysis
Statistical analysis was performed using SPSS version 25.0 (IBM Corporation, Armonk, NY). Continuous variables were expressed as mean ± standard deviation or median (interquartile range) based on distribution. Categorical variables were presented as frequencies and percentages. Between-group comparisons were performed using independent t-tests for normally distributed variables and Mann-Whitney U tests for non-normally distributed variables. Receiver operating characteristic (ROC) curves were constructed to evaluate diagnostic performance. The optimal cut-off value for RHI was determined using Youden's index. Correlation analysis was performed using Pearson's or Spearman's correlation coefficients as appropriate. Multiple linear regression analysis was conducted to identify independent predictors of RHI. A p-value of <0.05 was considered as statistically significant. Intraobservor Correlation Coefficient (ICC) was calculated for three observations made in group A and group B.
3. Results
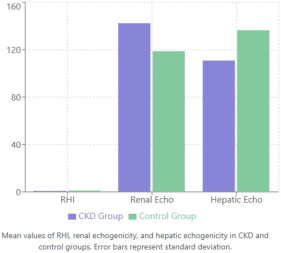
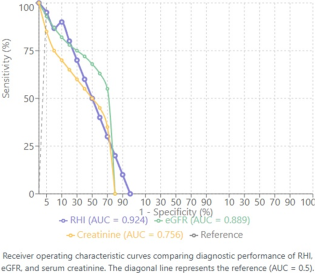
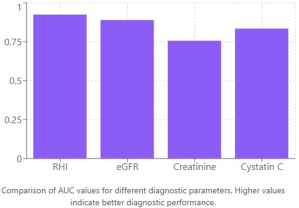
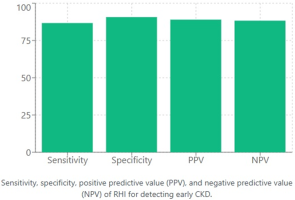
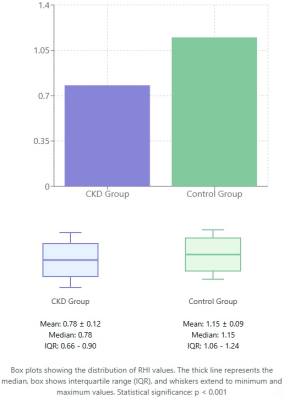
The study included 150 participants with a mean age of 48.2 ± 12.4 years. There were 48 males in group A and 37 females while group B had 39 males and 36 females. There were no significant differences in age, gender distribution, or body mass index between the two groups (Table 1). Ultrasound Findings Renal dimensions were comparable between groups, with no significant differences in kidney length or cortical thickness. However, renal cortical echogenicity was significantly higher in the CKD group compared to controls (Table 2). The mean RHI was significantly lower in the CKD group (0.78 ± 0.12) compared to the control group (1.15 ± 0.09) (p<0.001). Figure 1 demonstrates the comparison of RHI values alongside renal and hepatic echogenicity measurements between the two groups. Diagnostic Performance ROC curve analysis revealed excellent diagnostic performance of RHI for detecting early chronic renal parenchymal changes. The area under the curve (AUC) for RHI was 0.924 (95% CI: 0.886-0.962), which was superior to serum creatinine (AUC: 0.756) and comparable to eGFR (AUC: 0.889) (Figure 2). Figure 3 provides a visual comparison of AUC values across all diagnostic parameters tested. At the optimal cut-off value of 0.92, RHI demonstrated: Sensitivity: 86.7% (95% CI: 78.1-92.5%) Specificity: 90.7% (95% CI: 82.7-95.4%) Positive predictive value: 89.0% Negative predictive value: 88.3%. These diagnostic performance metrics are illustrated in Figure 4. Correlation Analysis RHI showed strong correlations with various renal function parameters: eGFR: r = 0.742, p<0.001 Serum creatinine: r = -0.689, p<0.001, Urinary ACR: r = -0.634, p<0.001, Cystatin C: r = -0.701, p<0.001. The distribution of RHI values showed minimal overlap between groups (Figures 5-7).
Table 1. Baseline Characteristics of Study Participants.
Parameter
CKD Group (n=75)
Control Group (n=75)
p-value
Age (years)
49.6 ± 11.8
45.8 ± 12.9
0.174
Male, n (%)
42 (56%)
39 (52%)
0.623
BMI (kg/m²)
26.2 ± 3.4
25.8 ± 3.1
0.456
Systolic BP (mmHg)
136 ± 16
124 ± 12
<0.001
Diastolic BP (mmHg)
86 ± 10
78 ± 8
<0.001
Serum Creatinine (mg/dL)
1.04 ± 0.20
0.82 ± 0.16
<0.001
eGFR (mL/min/1.73m²)
75.4 ± 10.2
98.6 ± 12.8
<0.001
Urinary ACR (mg/g)
65.3 ± 48.2
12.1 ± 8.8
<0.001
Values presented as mean ± standard deviation or number (percentage) BMI: Body Mass Index; BP: Blood Pressure; eGFR: estimated Glomerular Filtration Rate; ACR: Albumin-to-Creatinine Ratio. Statistical significance set at p < 0.05
Multiple Regression Analysis Multiple linear regression analysis identified eGFR (β = 0.456, p<0.001), urinary ACR (β = -0.324, p=0.002), and age (β = -0.198, p=0.018) as independent predictors of RHI. Intraclass Correlation Coefficient (ICC) was calculated to assess measurement consistency and variation (Table 3). Study showed that Overall RHI Intraobserver ICC: 0.935 ± 0.004 (excellent reliability), Group A (CKD patients): ICC 0.931 with CV 3.0% and Group B (Controls): ICC 0.940 with CV 2.6%
Values presented as mean ± standard deviation. Echogenicity measured on a grayscale with values ranging from 0 (black) to 255 (white). Statistical significance set at p < 0.05
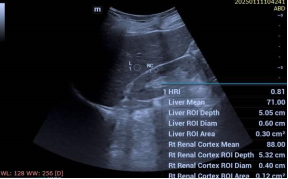
Figure 7. Group A patient with reduced RHI of 0.81.
Table 3. Intra observer correlation coefficient.
Measurement Parameter
Group A (CKD) n=75
Group B (Control) n=75
Combined n=150
ICC (95% CI)
0.934 (0.901-0.957)
0.943 (0.912-0.965)
0.938 (0.918-0.954)
Coefficient of Variation (%)
2.9%
2.5%
2.7%
RHI Reading 1 (Mean ± SD)
0.777 ± 0.119
1.099 ± 0.079
0.938 ± 0.194
RHI Reading 2 (Mean ± SD)
0.779 ± 0.121
1.101 ± 0.081
0.940 ± 0.195
RHI Reading 3 (Mean ± SD)
0.782 ± 0.118
1.098 ± 0.078
0.940 ± 0.193
Final Mean RHI
0.779 ± 0.119
1.099 ± 0.079
0.939 ± 0.194
Intraobserver Correlation Coefficient Analysis Reliability Classification: Excellent ICC (≥0.90); Good ICC (0.75-0.89); Excellent CV (≤3.0%); Good CV (3.1-5.0%)
4. Discussion
This study introduces the Reverse Hepatorenal Index as a novel ultrasound-based parameter for detecting early chronic renal parenchymal changes. Our findings demonstrate that RHI provides excellent diagnostic accuracy, with performance characteristics superior to traditional markers such as serum creatinine. The pathophysiological basis for the observed changes in RHI relates to the structural alterations that occur in chronic kidney disease. As CKD progresses, the renal cortex undergoes fibrosis, tubular atrophy, and inflammatory cell infiltration, leading to increased echogenicity
[6]
Khati NJ, Hill MC, Kimmel PL. The role of ultrasound in renal insufficiency: the essentials. Ultrasound Q. 2005; 21(4): 227-244.
[7]
Aparicio-Trejo OE, Tapia E, Sanchez-Lozada LG. Chronic kidney disease progression: the role of parenchymal damage. Curr Opin Nephrol Hypertens. 2023; 32(2): 136-144.
[6, 7]
. Conversely, the liver maintains relatively stable echogenicity in the absence of hepatic disease. This differential change creates a measurable alteration in the hepatorenal echogenicity relationship. The superiority of RHI over serum creatinine in detecting early CKD is particularly noteworthy. Serum creatinine levels typically remain within normal ranges until significant nephron loss occurs, limiting its utility in early disease detection
. In contrast, structural changes detectable by ultrasound may precede functional decline, allowing for earlier identification of at-risk patients. Our findings align with previous studies that have explored ultrasound-based parameters for CKD detection
[9]
Wang L, Zhang Y, Chen S, et al. Quantitative assessment of renal cortical echogenicity in chronic kidney disease patients: correlation with histologic findings. Ultrasound Med Biol. 2019; 45(8): 1887-1895.
[10]
Rule AD, Amer H, Cornell LD, et al. The association between age and nephrosclerosis on renal biopsy among healthy adults. Ann Intern Med. 2010; 152(9): 561-567.
[11]
O'Neill WC. Renal relevant radiology: use of ultrasound in kidney disease and nephrology procedures. Clin J Am Soc Nephrol. 2014; 9(2): 373-381.
[12]
KidneyDisease: Improving Global Outcomes (KDIGO) CKD Work Group. KDIGO 2024 Clinical Practice Guideline for the Evaluation and Management of Chronic Kidney Disease. Kidney Int. 2024; 105(4S): S117-S314.
[13]
Beland MD, Walle NL, Machan JT, Cronan JJ. Renal cortical thickness measured at ultrasound: is it better than renal length as an indicator of renal function in chronic kidney disease? AJR Am J Roentgenol. 2010; 195(2): W146-W149.
[14]
Yaprak M, Cakir O, Turan MN, et al. Role of ultrasonographic chronic kidney disease score in the assessment of chronic kidney disease. Int Urol Nephrol. 2017; 49(1): 123-131. 15. Zhang J, Li X, Wang Y, et al. Machine learning-based ultrasound radiomics for evaluation of chronic kidney disease. Eur Radiol. 2023; 33(8): 5400-5410.
[9-14]
. Wang et al. reported that increased renal cortical echogenicity correlated with histological severity in CKD patients
[9]
Wang L, Zhang Y, Chen S, et al. Quantitative assessment of renal cortical echogenicity in chronic kidney disease patients: correlation with histologic findings. Ultrasound Med Biol. 2019; 45(8): 1887-1895.
[9]
. However, their approach relied on subjective assessment rather than quantitative measurement. The RHI provides an objective, reproducible metric that can be standardized across different operators and institutions. The strong correlation between RHI and established markers of renal function (eGFR, cystatin C, and urinary ACR) supports its validity as a diagnostic tool. The multiple regression analysis further confirms that RHI reflects underlying renal function while providing additional information not captured by traditional parameters alone. The study also showed good Intra observer Correlation coefficient in both groups with an overall of 0.93 with slightly better results for control group Several clinical implications emerge from our findings. First, RHI could serve as a screening tool for early CKD detection in high-risk populations, such as patients with diabetes or hypertension. Second, serial RHI measurements might provide insights into disease progression or treatment response. Third, the non-invasive nature of ultrasound makes RHI particularly suitable for repeated assessments without the risks associated with contrast-enhanced imaging or kidney biopsy.
4.1. Limitations
This study has several limitations that warrant consideration. First, the cross-sectional design precludes assessment of RHI changes over time or its prognostic value. Second, we excluded patients with hepatic disease, which may limit the generalizability of RHI in populations with concomitant liver pathology. Third, ultrasound measurements can be influenced by technical factors such as gain settings and probe pressure, although we attempted to minimize this through standardized protocols. Additionally, the study population was limited to patients with early-stage CKD. Further research is needed to evaluate RHI performance in advanced CKD and in different etiologies of renal disease. The inter-observer variability of RHI measurements also requires further investigation to establish its reliability in routine clinical practice.
4.2. Future Directions
Several avenues for future research emerge from this study. Longitudinal studies are needed to assess the prognostic value of RHI and its ability to predict CKD progression. Investigation of RHI in specific disease populations (diabetic nephropathy, hypertensive nephrosclerosis) would provide insights into its diagnostic utility across different pathologies. Additionally, automated echogenicity measurement techniques using artificial intelligence could further standardize RHI calculation and reduce operator dependency.
5. Conclusion
The Reverse Hepatorenal Index represents a promising non-invasive parameter for early detection of chronic renal parenchymal changes. With sensitivity of 86.7% and specificity of 90.7%, RHI demonstrates superior performance compared to serum creatinine and comparable accuracy to eGFR. The quantitative nature of RHI, combined with the widespread availability of ultrasound, positions it as a valuable tool for CKD screening and monitoring. Further validation in larger, diverse populations is warranted to establish its role in routine clinical practice.
Abbreviations
RHI
Reverse Hepatorenal Index
CKD
Chronic Kidney Disease
Author Contributions
Atul Kapoor: Conceptualization, Methodology, Supervision, Writing – original draft
Global Burden of Disease Chronic Kidney Disease Collaboration. Global, regional, and national burden of chronic kidney disease, 1990-2017: a systematic analysis for the Global Burden of Disease Study 2017. Lancet. 2020; 395(10225): 7 09-733.
[2]
Levey AS, Stevens LA, Schmid CH, et al. A new equation to estimate glomerular filtration rate. Ann Intern Med. 2009; 150(9): 604-612.
[3]
Manley JA, O'Neill WC. How echogenic is echogenic? Quantitative acoustics of the renal cortex. Am J Kidney Dis. 2001; 37(4): 706-711.
Wang L, Zhang Y, Chen S, et al. Quantitative assessment of renal cortical echogenicity in chronic kidney disease patients: correlation with histologic findings. Ultrasound Med Biol. 2019; 45(8): 1887-1895.
[10]
Rule AD, Amer H, Cornell LD, et al. The association between age and nephrosclerosis on renal biopsy among healthy adults. Ann Intern Med. 2010; 152(9): 561-567.
[11]
O'Neill WC. Renal relevant radiology: use of ultrasound in kidney disease and nephrology procedures. Clin J Am Soc Nephrol. 2014; 9(2): 373-381.
[12]
KidneyDisease: Improving Global Outcomes (KDIGO) CKD Work Group. KDIGO 2024 Clinical Practice Guideline for the Evaluation and Management of Chronic Kidney Disease. Kidney Int. 2024; 105(4S): S117-S314.
[13]
Beland MD, Walle NL, Machan JT, Cronan JJ. Renal cortical thickness measured at ultrasound: is it better than renal length as an indicator of renal function in chronic kidney disease? AJR Am J Roentgenol. 2010; 195(2): W146-W149.
[14]
Yaprak M, Cakir O, Turan MN, et al. Role of ultrasonographic chronic kidney disease score in the assessment of chronic kidney disease. Int Urol Nephrol. 2017; 49(1): 123-131. 15. Zhang J, Li X, Wang Y, et al. Machine learning-based ultrasound radiomics for evaluation of chronic kidney disease. Eur Radiol. 2023; 33(8): 5400-5410.
Kapoor, A., Kapur, A. (2025). Reverse Hepatorenal Index: A New Parameter for Detection of Early Chronic Renal Parenchymal Changes. Clinical Medicine Research, 14(4), 109-114. https://doi.org/10.11648/j.cmr.20251404.12
Kapoor, A.; Kapur, A. Reverse Hepatorenal Index: A New Parameter for Detection of Early Chronic Renal Parenchymal Changes. Clin. Med. Res.2025, 14(4), 109-114. doi: 10.11648/j.cmr.20251404.12
Kapoor A, Kapur A. Reverse Hepatorenal Index: A New Parameter for Detection of Early Chronic Renal Parenchymal Changes. Clin Med Res. 2025;14(4):109-114. doi: 10.11648/j.cmr.20251404.12
@article{10.11648/j.cmr.20251404.12,
  author = {Atul Kapoor and Aprajita Kapur},
  title = {Reverse Hepatorenal Index: A New Parameter for Detection of Early Chronic Renal Parenchymal Changes
},
  journal = {Clinical Medicine Research},
  volume = {14},
  number = {4},
  pages = {109-114},
  doi = {10.11648/j.cmr.20251404.12},
  url = {https://doi.org/10.11648/j.cmr.20251404.12},
  eprint = {https://article.sciencepublishinggroup.com/pdf/10.11648.j.cmr.20251404.12},
  abstract = {Aim of the Study: Early detection of chronic kidney disease (CKD) remains a clinical challenge. Current diagnostic parameters often identify renal dysfunction only after significant parenchymal damage has occurred. This study introduces the Reverse Hepatorenal Index (RHI), a novel ultrasound-based parameter designed to detect early chronic renal parenchymal changes and evaluates the diagnostic accuracy of the Reverse Hepatorenal Index in detecting early chronic renal parenchymal changes compared to conventional parameters. Material and Methods: A prospective observational study was conducted on 150 participants (75 with early-stage CKD and 75 healthy controls) from January 2025 to May 2025. Ultrasound examinations were performed to measure renal and hepatic echogenicity. The RHI was calculated as the below normal values of the ratio of hepatic cortical echogenicity to renal cortical echogenicity. Serum creatinine, estimated glomerular filtration rate (eGFR), and urinary biomarkers were measured for comparison. Results: The mean RHI was significantly lower in patients with early CKD (0.78 ± 0.12) compared to healthy controls (1.15 ± 0.09) (pConclusion: The Reverse Hepatorenal Index represents a promising non-invasive parameter for early detection of chronic renal parenchymal changes. Its superior performance compared to traditional markers suggests potential clinical utility in CKD screening and monitoring.},
 year = {2025}
}
TY  - JOUR
T1  - Reverse Hepatorenal Index: A New Parameter for Detection of Early Chronic Renal Parenchymal Changes

AU  - Atul Kapoor
AU  - Aprajita Kapur
Y1  - 2025/07/18
PY  - 2025
N1  - https://doi.org/10.11648/j.cmr.20251404.12
DO  - 10.11648/j.cmr.20251404.12
T2  - Clinical Medicine Research
JF  - Clinical Medicine Research
JO  - Clinical Medicine Research
SP  - 109
EP  - 114
PB  - Science Publishing Group
SN  - 2326-9057
UR  - https://doi.org/10.11648/j.cmr.20251404.12
AB  - Aim of the Study: Early detection of chronic kidney disease (CKD) remains a clinical challenge. Current diagnostic parameters often identify renal dysfunction only after significant parenchymal damage has occurred. This study introduces the Reverse Hepatorenal Index (RHI), a novel ultrasound-based parameter designed to detect early chronic renal parenchymal changes and evaluates the diagnostic accuracy of the Reverse Hepatorenal Index in detecting early chronic renal parenchymal changes compared to conventional parameters. Material and Methods: A prospective observational study was conducted on 150 participants (75 with early-stage CKD and 75 healthy controls) from January 2025 to May 2025. Ultrasound examinations were performed to measure renal and hepatic echogenicity. The RHI was calculated as the below normal values of the ratio of hepatic cortical echogenicity to renal cortical echogenicity. Serum creatinine, estimated glomerular filtration rate (eGFR), and urinary biomarkers were measured for comparison. Results: The mean RHI was significantly lower in patients with early CKD (0.78 ± 0.12) compared to healthy controls (1.15 ± 0.09) (pConclusion: The Reverse Hepatorenal Index represents a promising non-invasive parameter for early detection of chronic renal parenchymal changes. Its superior performance compared to traditional markers suggests potential clinical utility in CKD screening and monitoring.
VL  - 14
IS  - 4
ER  -