1. Introduction
Global climate change has emerged as one of the most pressing challenges of the 21st century, with profound implications for public health
| [1] | Goniewicz, K., Burkle, F. M., Amir Khorram-Manesh, A. Transforming global public health: Climate collaboration, political challenges, and systemic change. Journal of Infection and Public Health, Volume 18, Issue 1, 2025. https://doi.org/10.1016/j.jiph.2024.102615 |
| [2] | Ergin, E., Altinel, B., Aktas, E. A mixed method study on global warming, climate change and the role of public health nurses from the perspective of nursing students. Nurse Education Today, Volume 107, 2021. https://doi.org/10.1016/j.nedt.2021.105144 |
[1, 2]
. Climate variability and air quality are increasingly recognized as significant determinants of public health outcomes. The relationship between public health and climate change is cyclical: worsening environmental conditions drive health challenges, and health-focused climate action can mitigate those impacts. Addressing these intersections requires a multidisciplinary, equity-centered approach, recognizing that the health of people and the planet are intrinsically linked
| [1] | Goniewicz, K., Burkle, F. M., Amir Khorram-Manesh, A. Transforming global public health: Climate collaboration, political challenges, and systemic change. Journal of Infection and Public Health, Volume 18, Issue 1, 2025. https://doi.org/10.1016/j.jiph.2024.102615 |
[1]
. The interplay between atmospheric conditions and health-related events has been explored globally, with studies revealing associations between meteorological parameters and diseases such as hypertension, cardiovascular and circulatory diseases conditions
| [3] | Brook, R. D., et al. (2010). Particulate matter air pollution and cardiovascular disease: An update to the scientific statement from the American Heart Association. Circulation, 121(21), 2331–2378. https://doi.org/10.1161/CIR.0b013e3181dbece1 |
| [4] | Pope, C. A., Dockery, D. W. (2006). Health Effects of Fine Particulate Air Pollution: Lines that Connect. Journal of the Air & Waste Management Association, 56(6), 709–742. https://doi.org/10.1080/10473289.2006.10464485 |
| [5] | Thompson, E. J., Alexander, S. E., Moneghetti, K., Howden, E. J. The interplay of climate change and physical activity: Implications for cardiovascular health. American Heart Journal Plus: Cardiology Research and Practice, Volume 47, 2024, ISSN 2666-6022, https://doi.org/10.1016/j.ahjo.2024.100474 . |
[3-5]
. These relationships are particularly pronounced in insular regions, where unique climatic dynamics, limited healthcare resources, and heightened vulnerability to environmental changes amplify their impact
| [6] | Carvalho, F., et al. (2022). Weather and Air Quality Factors Contribution to the Hospital Admissions of Patients with Respiratory Diseases: Case Study of Faial Island (Azores). Int J Environ Sci Nat Res, 31(1), 556305. https://doi.org/10.19080/IJESNR.2022.31.556305 |
| [7] | Åström, D. O., et al. (2013). Heat wave impact on morbidity and mortality in the elderly population: A review of recent studies. Maturitas, 69(2), 99–105. https://doi.org/10.1016/j.maturitas.2011.02.009 |
[6, 7]
.
The Azores, an archipelago in the North Atlantic, exemplify such a setting. Located at the crossroads of atmospheric systems like the Azores High and influenced by subtropical and maritime climates, the islands experience marked variability in temperature, precipitation, and air quality
| [8] | Carvalho, F. S.; Meirelles, M. G.; Henriques, D.; Porteiro, J.; Navarro, P.; Vasconcelos, H. C. Climate Change and Extreme Events in Northeast Atlantic and Azores Islands Region. Climate 2023, 11, 238. https://doi.org/10.3390/cli11120238 |
| [9] | IPCC (2021). Climate Change 2021: The Physical Science Basis. Contribution of Working Group I to the Sixth Assessment Report. Intergovernmental Panel on Climate Change. https://www.ipcc.ch/report/ar6/wg1/ |
[8, 9]
. In another regions, the recent evidence on adverse effects of particulate air pollution on public health has led to more stringent standards for levels of particulate matter in outdoor air in the United States and in other countries
. Understanding how these dynamics affect public health is crucial, particularly as climate change intensifies environmental stressors worldwide
| [11] | Stafoggia, M., et al. (2017). Long-term exposure to ambient air pollution and incidence of cerebrovascular events: Results from 11 European cohorts within the ESCAPE project. Environmental Health Perspectives, 125(3), 357–364. https://doi.org/10.1289/EHP1237 |
[11]
. Cardiovascular diseases, including hypertension and circulatory system disorders, are among the leading causes of morbidity and mortality globally, with environmental factors playing a significant role in their etiology and exacerbation
| [12] | World Health Organization. (2020). Noncommunicable Diseases: Progress Monitor 2020. World Health Organization. ISBN: 978 92 4 000049 0. |
| [13] | Mittleman, M. A., et al. (1993). Triggering of acute myocardial infarction by heavy physical exertion. New England Journal of Medicine, 329(23), 1677–1683. https://doi.org/10.1056/NEJM199312023292301 |
[12, 13]
. In the Azores, data from the Regional Department of Health and Sports show that the leading cause of death is diseases of the circulatory system
| [14] | Regional Secretariat for Health and Sports/Regional Health Directorate. Azores (RSHS). Indicadores de Saúde 2017 – 2022. SRSD/DRS, 2017 - 2022. 172 p. |
[14]
.
Table 1 presents the number of deaths for the four diseases that have the highest numbers.
Table 1. Total Number of Deaths, by Cause of Death. Source: RSHS, 2022.
Number of cases/Year | 2013 | 2014 | 2015 | 2016 | 2017 | 2018 | 2019 |
Neoplasms | 617 | 563 | 576 | 598 | 594 | 656 | 663 |
Circulatory System Diseases | 743 | 762 | 777 | 790 | 718 | 688 | 705 |
Respiratory System Diseases | 333 | 335 | 276 | 312 | 274 | 295 | 234 |
Endocrine, Nutritional and Metabolic Diseases | 179 | 144 | 161 | 140 | 152 | 151 | 121 |
⁞ | ⁞ | ⁞ | ⁞ | ⁞ | ⁞ | ⁞ | ⁞ |
Total | 2443 | 2315 | 2305 | 2408 | 2246 | 2295 | 2271 |
For the years between 2013 and 2019, deaths attributed to circulatory system diseases contributed between 30% and 32.8% of total deaths.
The link between air pollutants and increased risk for cardiovascular events is supported by animal models but the exact underlying mechanism is still not known, and many theories have been proposed
| [15] | Yadav, R., Deora, S., Yadav, G. Air pollution and its impact on cardiovascular health – It's time to act fast! Indian Heart Journal, Volume 73, Issue 1, 2021, Pages 1-6, ISSN 0019-4832, https://doi.org/10.1016/j.ihj.2021.01.021 |
[15]
. Low temperatures, large diurnal thermal amplitudes, and high relative humidity have been linked to increased hospital admissions for cardiovascular conditions
| [16] | Brook, R. D., Rajagopalan, S., Pope, C. A., Brook, J. R., Bhatnagar, A., Diez-Roux, A. V., Holguin, F., Hong, Y., Luepker, R. V., Mittleman, M. A., Peters, A., Siscovick, D., Smith, S. C., Jr, Whitsel, L., Kaufman, J. D. (2010). Particulate matter air pollution and cardiovascular disease: An update to the scientific statement from the American Heart Association. Circulation, 121(21), 2331–2378. https://doi.org/10.1161/CIR.0b013e3181dbece1 |
| [17] | Wang, G., Fan Yang, F., Lin, G., Wang, Z., Zhang, X. Modification of low temperature-related hospital admissions for cardiovascular diseases by multiple green space indicators at multiple spatial scales: Evidence from Guangzhou, China, (20023). International Journal of Hygiene and Environmental Health, 251, ISSN 1438-4639, https://doi.org/10.1016/j.ijheh.2023.114193 |
| [18] | Rastegar, A., Ghorbanian, M., Hosseinzadeh, A., Saghi, M. H., Iranpour, S., Mohammadi, A. A., Poureshgh, Y., Rahmanzadeh, E., Hekmatshoar, R., Oghazyan, A., Fattahi, M., Nguyen, P. U. (2024). Investigating the impact of air pollution and temperature changes on emergency admissions (cardiovascular + respiratory) disease in the city of Bojnord, northeastern Iran. Heliyon, 10, (7). ISSN 2405-8440, https://doi.org/10.1016/j.heliyon.2024.e27900 |
[16-18]
. Additionally, air pollutants such as NO
2: nitrogen dioxide, SO
2: sulfur dioxide, and PM10: particulate matter smaller than 10 µm have been shown to aggravate these conditions by inducing systemic inflammation and oxidative stress, this result has been discussed in previous studies
| [19] | Bourdrel, T., Bind, M. A., Béjot, Y., Morel, O., & Argacha, J. F. (2017). Cardiovascular effects of air pollution. Archives of Cardiovascular Diseases, 110(11), 634-642. ISSN 1875-2136, https://doi.org/10.1016/j.acvd.2017.05.003 |
| [20] | Collart, P., Dubourg, D., Levêque, A., Sierra, N. B., Coppieters, Y. (2018). Short-term effects of nitrogen dioxide on hospital admissions for cardiovascular disease in Wallonia, Belgium. International Journal of Cardiology, 255, 231-236, ISSN 0167-5273, https://doi.org/10.1016/j.ijcard.2017.12.058 |
[19, 20]
. Air quality is important for the protection of human health, the environment and our cultural heritage and it is an issue that will acquire increased significance in the future due to the adverse effects of climate change
| [21] | Evagelopoulos, V.; Charisiou, N. D.; Logothetis, M.; Evagelopoulos, G.; Logothetis, C. Cloud-Based Decision Support System for Air Quality Management. Climate 2022, 10, 39. https://doi.org/10.3390/cli10030039 |
[21]
. Traditional time-series studies have focused on assessing health effects using single-pollutant models adjusting for weather variables. However, ambient pollutants are present in different mixtures on air and their joint effects on health could be distinct from the simple sum of independent effects
| [22] | Rodríguez-Villamizar, L. A., Rojas-Roa, N. Y., Fernández-Niño, J. A. Short-term joint effects of ambient air pollutants on emergency department visits for respiratory and circulatory diseases in Colombia, 2011–2014, Environmental Pollution, Volume 248, 2019, Pages 380-387, ISSN 0269-7491, https://doi.org/10.1016/j.envpol.2019.02.028 |
[22]
. According to
, as cited by Evagelopoulos
| [21] | Evagelopoulos, V.; Charisiou, N. D.; Logothetis, M.; Evagelopoulos, G.; Logothetis, C. Cloud-Based Decision Support System for Air Quality Management. Climate 2022, 10, 39. https://doi.org/10.3390/cli10030039 |
[21]
in terms of PM10, the threshold for the protection of human health has been set at 40 mg/m3 over the course of a year, while a concentration of 50 mg/m3 shall not be exceeded for more than 35 days a year. Similarly, for PM2.5: particulate matter smaller than 2.5 µm, the annual threshold has been set at 20 mg/m
3. Exposure to ambient air pollution increases mortality and morbidity and shortens life expectancy
| [25] | Cohen, A. J., Brauer, M., Burnett, R., Anderson, H. R., Frostad, J., Estep, K.,... & Murray, C. J. (2017). Estimates and 25-year trends of the global burden of disease attributable to ambient air pollution: an analysis of data from the Global Burden of Diseases Study 2015. The Lancet, 389(10082), 1907-1918. http://dx.doi.org/10.1016/S0140-6736(17)30505-6 |
[25]
. The European Society of Cardiology presents a discussion between the relationship between air pollution and cardiovascular diseases, addressing public health recommendations
| [26] | Newby, D. E., Mannucci, P. M., Tell, G. S., Baccarelli, A. A., Brook, R. D., Donaldson, K.,... & Mills, N. L. (2015). Expert position paper on air pollution and cardiovascular disease. European Heart Journal, 36(2), 83-93. https://doi.org/10.1093/eurheartj/ehu458 |
[26]
.
Previous studies demonstrated that cold weather elevates blood pressure levels, particularly in hypertensive patients, increasing the risk of acute cardiovascular events
| [27] | Yifan Xu, Y., Han, Y., Chen, W., Chatzidiakou, L., Yan, L., Krause, A., Li Y., Zhang, H., Wang, T., Xue, T., Chan, Q., Barratt, B., Jones, R. L., Liu, J., Wu, Y., Zhao, M., Zhang, J., Kelly, F. J., Zhu, T. (2024). Susceptibility of hypertensive individuals to acute blood pressure increases in response to personal-level environmental temperature decrease. Environment International, 185. ISSN 0160-4120, https://doi.org/10.1016/j.envint.2024.108567 |
| [28] | Shiue, I., Perkins, D. R., & Bearman, N. (2015). Postprocedural disorders of circulatory system admissions peaked at physically equivalent temperature 0–10°C in Germany in 2009–2011. International Journal of Cardiology, 178, 10–11. ttps://doi.org/10.1016/j.ijcard.2014.10.127 |
[27, 28]
. Similarly, high wind speeds and fluctuating humidity have been implicated in triggering circulatory system disorders
| [29] | Abrignani MG, Lombardo A, Braschi A, Renda N, Abrignani V. (2022). Climatic influences on cardiovascular diseases. World J Cardiol. 2022; 14(3): 152-169. https://doi.org/10.4330/wjc.v14.i3.152 |
[29]
. In subtropical and temperate maritime regions, such as the Azores, these phenomena may exert compounded effects, given the high seasonal variability in climatic and air quality parameters
| [30] | Agbo, E. P., Edet, C. O. (2022). Meteorological analysis of the relationship between climatic parameters: understanding the dynamics of the troposphere. Theor Appl Climatol 150, 1677–1698. https://doi.org/10.1007/s00704-022-04226-x |
[30]
.
Despite the growing body of evidence linking environmental factors with health outcomes, research focusing on insular and maritime climates remains limited. The Azores, as a case study, offer unique insights into how local climate variability and air pollution intersect to shape public health risks. Leveraging over a decade of meteorological, air quality, and epidemiological data (2010–2019), this study aims to address this knowledge gap by exploring the associations between weather conditions, air quality parameters, and hospital admissions for hypertension, cardiovascular, and circulatory diseases in Faial Island. The selection of the 2010–2019 was based on several considerations:
1) Data Availability: Comprehensive and high-quality data for epidemiological, meteorological, and air quality parameters were consistently available for this period. This ensured robust statistical analyses and reliable results.
2) Temporal Scope: A decade-long study period allows the capture of seasonal patterns, inter-annual variability, and long-term trends in the relationships between environmental factors and health outcomes. This is particularly crucial in regions with significant climate variability, such as the Azores.
3) Relevance to Current Climate Trends: The chosen period aligns with recent global and regional changes in climatic and environmental conditions, providing insights that remain relevant for current and future public health strategies.
These hospital data include all recorded hospital admissions, encompassing both inpatient treatments and cases treated in the Emergency Unit, for individuals diagnosed with hypertension, cardiovascular, and circulatory system diseases during the study period (2010–2019). The dataset represents the entire population of patients admitted with these conditions within the hospital’s catchment area, ensuring comprehensive coverage and eliminating selection bias.
Through advanced statistical methods, including time series analysis and PCA, we aim to uncover seasonal patterns and identify the most critical environmental determinants of health outcomes. Our findings will contribute to the development of adaptive healthcare strategies, particularly in vulnerable insular communities, as they confront the dual challenges of climate change and public health management.
2. Material and Methods
2.1. Materials
The research was conducted on Faial Island, in the Azores region, located in the North Atlantic Ocean. This island is characterized by a temperate maritime climate, influenced by atmospheric systems such as the Azores Anticyclone and the seasonal climate variability typical of the North Atlantic. The region was chosen due to its sensitivity to weather and environmental changes and the availability of detailed epidemiological, meteorological and air quality data.
2.1.1. Study Area
The study area of this work comprises the North Atlantic Ocean, with particular emphasis on the region where the Azores are located,
Figure 1 in
| [8] | Carvalho, F. S.; Meirelles, M. G.; Henriques, D.; Porteiro, J.; Navarro, P.; Vasconcelos, H. C. Climate Change and Extreme Events in Northeast Atlantic and Azores Islands Region. Climate 2023, 11, 238. https://doi.org/10.3390/cli11120238 |
[8]
. The Azores are a group of nine volcanic islands located in the North Atlantic Ocean, about 1,500 kilometers west of Portugal and 3,900 kilometers east of North America. They are positioned roughly between 37° and 40° of latitude north and 25° and 31° of longitude west. The archipelago is part of Portugal and is divided into three groups: the Eastern Group (São Miguel and Santa Maria), the Central Group (Terceira, Graciosa, São Jorge, Pico, and Faial), and the Western Group (Flores and Corvo).
The Azores archipelago is in the subtropical region of the North Atlantic and therefore heavily influenced by the North Atlantic Subtropical Anticyclone, also known as the Azores High. As it is a quasi-stationary high-pressure system, its position, intensity, development, and orientation determine the nature and characteristics of the air masses that reach the region, as well as the frequency and paths of waves and lows of the Polar Front of the North Atlantic which is also an important modeling system of weather in the Azores. According to the Köppen-Geiger Climate Classification, the climate is considered predominantly humid temperate, without a dry season, with precipitation in all months of the year and with a temperate summer
| [6] | Carvalho, F., et al. (2022). Weather and Air Quality Factors Contribution to the Hospital Admissions of Patients with Respiratory Diseases: Case Study of Faial Island (Azores). Int J Environ Sci Nat Res, 31(1), 556305. https://doi.org/10.19080/IJESNR.2022.31.556305 |
[6]
.
The islands are influenced by the Gulf Stream, which brings warm water from the tropics, moderating temperatures throughout the year.
Faial island, located in the central group of the Azores archipelago, has an area of approximately 173 km², with an estimated population of two hundred and thirty-six thousand, six hundred, fifty-seven inhabitants, after a population decrease of 4.1% in the last decade. This island has a temperate oceanic climate. Local factors, such as island topography, and global factors, like air pollutant transport and ocean warming, interact to affect climate and air quality. These factors provide an opportunity to better understand their influence on human health.
2.1.2. Characterization of Data
Epidemiological: The Statistics Service of Horta Hospital on the island of Faial made available data on the number of hospital admissions of individuals (hospitalized and including those treated in the Emergency Unit) diagnosed with HIR: hypertension, CAR: cardiovascular and CIR: circulatory diseases, covering the period from 2010 to 2019.
Meteorological: Information for the period (2010 – 2019) about RR: precipitation, FF: wind speed, Tmax: maximum weekly temperature, Tmin: minimum weekly temperature, HR: relative humidity, DP: dew point, and Pnmm: atmospheric mean sea level, were made available by the Portuguese Institute of the Sea and Atmosphere, to which belongs to the automatic surface station located at the Observatory Príncipe Alberto de Monaco (Faial) (https://www.ipma.pt).
Air Quality: concentrations data of NO2, SO2, O3: ozone and suspended particles PM10, covering the period 2010-2019, were collected at the Espalhafatos station (Faial), Azores Air Quality Monitoring –
" https://ambiente.azores.gov.pt/qualidadedoar/DadosTempoReal.aspx.
2.2. Methods
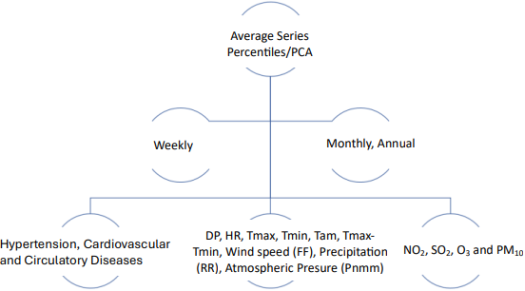
Figure 1 summarizes the steps of the principal methods used in the analysis of epidemiological, meteorological and air quality data used in this study.
Figure 1. Steps of the principal methods used in the analysis of epidemiological, meteorological and air quality data.
The time series was created based on weekly data for each meteorological variable, air quality and number of hospital admissions. This approach allowed us to identify seasonal patterns and possible correlations between climate and air quality variables and hospital admissions. After weekly percentile intervals meteorological data were organized into percentile intervals (0–25%, 25–50%, 50–75%, and 75–100%) to examine the relationship between weather extremes and hospital admissions. This analysis provides insights into how more intense or unusual weather conditions impact public health. PCA was used to reduce the dimensionality of the data while preserving most of the variability. Relationships between hospital admissions and meteorological and air quality variables were analyzed, identifying the factors that most influence the increase in cases. Monthly PCA included monthly averages of meteorological variables, air quality with total number of admissions. And annual PCA analyzed annual averages to understand long-term trends and inter-annual variability. The use of fitting polynomials and moving averages serves to capture the general trends and smooth weekly fluctuations, 3rd order polynomial models were fitted and moving averages were applied. These methods helped describe seasonal cyclical patterns and long-term trends in hospital admissions.
To carry out the proposed tasks, the data was processed and analyzed using statistical and graphical visualization Software.
2.2.1. Percentile Analysis
The time series was created based on weekly data for each meteorological variable, air quality and number of hospital admissions. This approach allowed us to identify seasonal patterns and possible correlations between climate and air quality variables and hospital admissions. After weekly percentile intervals meteorological data were organized into percentile intervals (0–25%, 25–50%, 50–75%, and 75–100%) to examine the relationship between weather extremes and hospital admissions. This analysis provides insights into how more intense or unusual weather conditions impact public health.
2.2.2. Principal Component Analysis
Principal Component Analysis is a statistical technique used to reduce the dimensionality of complex data sets while preserving most of their variability. This is achieved by transforming possibly correlated variables into a smaller set of uncorrelated variables called principal components. We begin this process by normalizing the data, that is, the data is standardized to ensure that all variables are comparable, regardless of their units or magnitudes. Next, we proceed to calculate the covariance matrix, which is calculated to identify the relationship between the original variables, and how these variables vary together. The determination of eigenvalues and eigenvectors indicates the amount of variance that each principal component explains. The eigenvectors define the direction of the principal components. The original data is transformed and to be projected onto the eigenvectors, generating new axes (main components). The first components retain most of the variance in the data. Typically, only components that explain a significant portion of the variance (based on eigenvalues) are retained for further analysis. PCA is useful because it reduces data complexity, allowing you to work with a smaller number of variables, facilitating interpretation without significant loss of information. This processing of data helps reveal relationships or patterns that may not be evident in the original data.
PCA was used to reduce the dimensionality of the data while preserving most of the variability. Relationships between hospital admissions and meteorological and air quality variables were analyzed, identifying the factors that most influence the increase in cases. Monthly PCA included monthly averages of meteorological variables, air quality with total number of admissions. And annual PCA analyzed annual averages to understand long-term trends and inter-annual variability. The use of fitting polynomials and moving averages serves to capture the general trends and smooth weekly fluctuations, 3rd order polynomial models were fitted and moving averages were applied. These methods helped describe seasonal cyclical patterns and long-term trends in hospital admissions.
2.3. Statistical Analysis
To carry out the proposed tasks, the data was processed and analyzed using Python Software Foundation, version 3.7.10.
3. Results
The methodology described above was designed to capture the complex interactions between climate, air quality and public health, allowing a detailed and integrated analysis of the factors that contribute to variations in hospital admissions in the Azores region.
3.1. Percentile Analysis _ Meteorological Parameters Versus Cardiovascular Cases
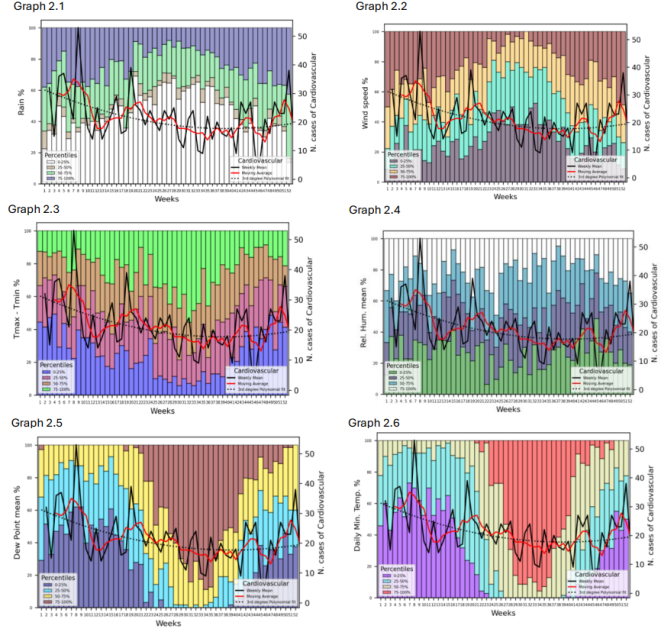
Figure 2 displays six graphs for percentiles of weekly average data for meteorological parameters (rainfall, wind speed, thermal amplitude, relative humidity, dew point and daily minimum temperature) versus the number of admissions due to cardiovascular diseases cases in the Faial Hospital over the course of 2010 to 2019.
Graph 2.1, the highest rainfall (75-100%) tends to be more frequent from the second half of the year onward. For cardiovascular cases admissions, the moving average line represents the weekly mean number admissions of cardiovascular diseases, which fluctuates between approximately 10 and more 45 cases. The third-degree polynomial fit shows an overall trend across the weeks for these 10 years under study. In the early weeks, there is a slight correlation between rainfall and a higher number of cardiovascular cases, suggesting that increased rainfall may be associated with a rise in these cases. In mid-year, despite some weeks with lower rainfall, the cardiovascular cases remain relatively steady but show less obvious correlation with rainfall trends. Toward the year's end of the year’s interval under study, there is a slight increase in both rainfall (often reaching the 75-100% percentile) and cardiovascular cases, though the relationship is not strongly linear. The polynomial fit suggests an initial decline in cardiovascular admissions diseases, a plateau mid-year, and a slight upward trend toward the end of the year. The moving average also smooths out short-term variations, reflecting this general trend.
Graph 2.2 presents percentiles of weekly average data for wind speed and the number of cardiovascular cases diseases admissions in the Faial Hospital. Early in the year, when wind speeds are generally high, there is a noticeable increase in cardiovascular admissions cases, suggesting a potential correlation. In mid-year, when wind speeds are mostly in the lower percentiles, the cardiovascular cases remain relatively stable with some small fluctuations. Toward the year’s end, both wind speeds (in the 75-100% range) and cardiovascular admissions cases show an uptick, again indicating a possible relationship. The polynomial trend shows a slight decrease in cardiovascular cases during the middle of the year, with a resurgence toward the end. The moving average follows a similar trend, with an initial decline, stabilization, and a slight increase at the end.
Figure 2. Graph 2.1 to 2.6 presents average weekly number of hospitalizations for cases of cardiovascular diseases (black line), moving average (red line), 3rd degree polynomial fit (dotted line) and interval percentiles per week for some meteorological parameters (Faial, 2010 – 2019).
Graph 2.3 illustrates the percentiles for weekly average thermal amplitude or range between maximum and minimum temperatures (Tmax-Tmin), alongside the weekly number of cardiovascular cases (admissions), over the span period in study. Larger temperature ranges (75-100% percentiles) appear more consistently in the middle of the year, indicating that the temperature range tends to be highest during this period, while the beginning and end of the year have a lowest temperature range. During the early weeks, when the temperature range is mostly in the lower percentiles (0-50%), cardiovascular cases are relatively high, with some fluctuations. In mid-year, as the temperature range increases (often reaching the 75-100% percentile), the number of cardiovascular cases generally stabilizes with some moderate fluctuations. Toward the end of the year, when the temperature range narrows again, there is a slight increase in cardiovascular admissions cases. The polynomial fit line indicates an initial decline in cardiovascular admissions cases, a relatively stable period in the middle of the year, and a slight rise toward the end. The moving average also reflects these general trends, with a downward trend in the first few months, leveling off mid-year, and a slight increase near the end of each year.
Graph 2.4 in
Figure 2, presents the relationship between weekly mean relative humidity (Rel. Hum. mean %) and the number of weekly cardiovascular cases over 52 weeks for 10 years. Relative humidity is generally lower during mid-year (weeks 20–40) and higher in early and late-year weeks. The number of weekly cardiovascular cases fluctuated throughout the weeks. Peaks in these cases often coincide with weeks of higher humidity. The moving Average show peaks early in the year (around week 7) and then shows a slight downward trend with some fluctuation but rises again toward the end of the year. 3rd Degree Polynomial Fit suggests a subtle seasonal pattern in cardiovascular cases, with a general decline in cases through mid-year, followed by an increase as the year progresses.
Above graph 2.5,
Figure 2 displays the weekly average dew point data grouped into percentiles and the number of cardiovascular cases across 52 weeks for 10 years. Higher dew point levels (50-75% and 75-100%) are more frequent from week 20 to week 42, while lower levels (0-25% and 25-50%) dominate in the earlier and later parts of the year. Cardiovascular cases/admissions in the Faial hospital this line shows weekly fluctuations in the number of cardiovascular cases. Peaks are observed early in the year, dip in the mid-year, and then increase toward the end of the year. The moving average line shows a downward trend in cardiovascular cases through mid-year, followed by a gradual rise in the later weeks. The 3rd Degree polynomial fit line shows a trend that indicates a slight seasonal pattern, with higher cardiovascular cases at the beginning and end of the year and lower cases during the middle weeks.
Analyzing Graph 2.6 in
Figure 2 shows the relationship between the percentiles of the weekly daily minimum average temperature and the number of weekly cardiovascular cases over a 52-week period for 10 years. The distribution of colors reflects seasonal variations, with lower weekly average minimum temperatures (0-25% and 25-50%) in the beginning and end of the year, and higher weekly average minimum temperatures (50-75% and 75-100%) predominantly from week 20 to around week 40. The line for cardiovascular cases shows a fluctuating pattern over the year, with peaks at the beginning and end of the year. The moving average presents a downward trend in the middle of the year and an increase toward the year’s end. The 3rd Degree Polynomial Fit presents a trend line who suggests a general seasonal trend, with higher cardiovascular cases at the beginning and end of the year and a drop during the warmer mid-year weeks.
3.2. Percentile Analysis _ Meteorological Parameters Versus Hypertension Cases
Figure 3 displays six graphs for percentiles of weekly average data for meteorological parameters (rainfall, wind speed, thermal amplitude, relative humidity, dew point and daily minimum temperature) versus the number of admissions due to hypertension diseases cases in the Faial Hospital over the course of 2010 to 2019.
This graphic 3.1 addresses the relationship between percentiles weekly average rainfall percentages and the number of weekly hypertension diseases cases over a year (52 weeks) for 10 years. Rainfall appears to vary significantly throughout the year, with higher rainfall (75 - 100%) more frequently in certain weeks, especially towards the start and end of the year. There appears to be some fluctuation in hypertension cases that loosely correlates with rainfall, particularly during periods of high rainfall. However, this relationship is not very strong and may suggest a complex interaction rather than a direct correlation. Hypertension admission cases are higher during specific weeks, with peaks and troughs that could indicate a seasonal or environmental factor influencing the frequency of cases. The polynomial trend suggests a general upward trend over the year, with some seasonal dips. The moving average trend shows that hypertension cases tend to stabilize over time, with occasional increases, suggesting possible external factors affecting these cases periodically.
Graph 3.2 presents the relationship between weekly wind speed percentages and the number of weekly hypertension cases/admissions over a full year (52 weeks) for 10 years. Here's an analysis of each axis and variables; left y-axis (wind speed %): represents the percentage of wind speed, ranging from 0% to 100%. Right y-axis (N. cases of hypertension): represents the number of hypertension cases, ranging from 0 to 300. X-axis (weeks): represents weeks from 1 to 52. And the wind speed percentiles are divided into four categories: 0-25% (purple), 25-50% (green), 50-75% (yellow) and 75-100% (Brown). Each vertical bar on the graph shows the percentage of wind speed for each week, with segments representing these different percentiles. Wind speed fluctuates over the weeks, with periods of higher wind speed (brown segments) concentrated in certain weeks, mainly around the beginning and middle of the year, tapering off towards the end. If we consider hypertension cases, black line (weekly mean) shows the weekly mean number of hypertension cases. The red line (moving average) represents a smoothed moving average trend for hypertension cases over the year, highlighting the overall trend. Black dotted line (3rd degree polynomial fit): a polynomial trend line fitted to the data, suggesting a modeled trend for hypertension cases.
Presents in the Graph 3.3 is the relationship between the percentiles weekly average temperature range (difference between maximum and minimum temperature, (Tmax−Tmin) or thermal amplitude and the number of weekly hypertension cases over a year (52 weeks) during the time in study. The thermal amplitude appears to vary throughout the year, with higher ranges (green segments) most prominent during certain weeks, especially at the start and end of the year, and lower ranges (blue segments) more common in the middle of the year. Analyzing the same graph for hypertension admissions cases, the 3rd Degree Polynomial Fit shows a polynomial trend line fitted to the data, providing a model to estimate the trend in hypertension cases. For this analysis we conclude that there is a slight visual alignment between weeks with a high thermal amplitude and higher hypertension cases, particularly in some of the peaks around the start and end of the year. Although the trend of hypertension cases and the thermal amplitude do not always align, there are instances where an increase in thermal amplitude appears to coincide with an increase in hypertension cases. Hypertension cases show peaks and dips at various times throughout the year, with notable peaks around weeks 5-8, weeks 20-25, and weeks 35-45. The polynomial trend suggests a slight increase in hypertension cases over the year, with some fluctuation. The moving average line highlights a relatively stable trend in hypertension cases but captures some mid-year and end-of-year peaks that might be associated with seasonal factors.
Figure 3. Graph 3.1 to 3.6 presents average weekly number of hospitalizations for cases of hypertension diseases (black line), moving average (red line), 3rd degree polynomial fit (dotted line) and interval percentiles per week for some meteorological parameters (Faial, 2010 – 2019).
From the analysis of Graph 3.4 in
Figure 3, the bars represent weekly average mean relative humidity divided into percentiles. Highest humidity range. Most weeks show significant humidity variability across all percentile ranges, with seasonal trends. This are divided as follows: early weeks (1–10) show higher overall humidity levels, with many weeks in the 75–100% range, mid-year (weeks 20–40) sees a decline in high-humidity percentiles, indicating lower overall relative humidity and late weeks (40–52) show recovery toward higher humidity levels. Weekly mean show that cases of hypertension fluctuate significantly, peaks occur during weeks 5–7, weeks 20–22, and weeks 35–37, and lowest values are observed around weeks 10–15 and weeks 43–48. In this graph a moving average smooths weekly fluctuations, showing clearer long-term trends such as: hypertension cases tend to follow a slightly cyclical pattern, with higher numbers at the beginning and end of the year and the third-degree polynomial fit confirms the cyclic pattern with three main peaks over the year. About relative humidity and hypertension diseases, the first hypertension peak (weeks 5–7) aligns with high relative humidity (75–100% percentile). The second peak (weeks 20–22) occurs during a period of decreasing relative humidity, but percentile distribution remains mixed. The final peak (weeks 35–37) coincides with moderate humidity levels (25–50% and 50–75%). However, hypertension cases decline in weeks with lower humidity percentiles (weeks 10–15 and weeks 43–48). This suggests that very low or very high humidity could exacerbate hypertension cases.
Graph 3.5 relates information between percentile weekly mean distribution of dew point and weekly mean circulatory diseases. Hypertension cases show cyclical behavior, with clear peaks and troughs. We can see the peaks in weeks 5–7, weeks 20–22, and weeks 35–37 and troughs in weeks 10–15 and weeks 43–48. This suggests seasonality or environmental factors influencing hypertension cases. In relation to trends the moving average shows an overall cyclical pattern. A third-degree polynomial fit highlights long-term trends with three major peaks. By inspection of graph 2.5 we found that week’s 5–7, high dew point (75–100%) correlates with a sharp increase in hypertension cases. Weeks 35–37, a similar relationship is observed during another hypertension peak. Weeks 10–15: lower dew points (0–50%) correspond to a decline in hypertension cases. Weeks 43–48, another dip in hypertension cases coincides with lower dew points. And a transition period is found on week’s 20–22.
Graph 3.6 provides information about the weekly average daily minimum temperature and hypertension cases. A seasonal trend can be seen because in weeks 1–10: dominated by colder minimum temperatures (mostly 0–25% and 25–50% ranges), weeks 20–40: warmer minimum temperatures prevail (50–100% ranges) and weeks 40–52: a return to colder minimum temperatures, with a higher proportion of the 0–25% range. Average hypertension cases fluctuate with visible peaks and troughs. The peaks are seen in weeks 5–7, weeks 20–22, and weeks 35–37. For troughs it is detected in weeks 10–15 and weeks 43–48. The cyclic pattern suggests environmental or seasonal influences on hypertension cases. The moving average shows an overall sinusoidal trend with highs and lows. The third-degree polynomial fit confirms the cyclical nature of hypertension cases.
3.3. Percentile Analysis _ Meteorological Parameters Versus Circulatory Cases
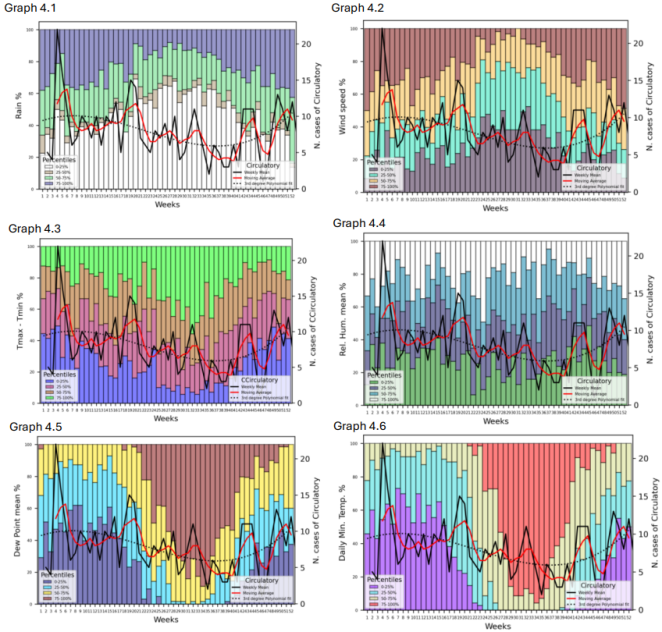
In
Figure 4, Graphs 4.1 to 4.6 compares rain, wind speed, Tmax
- Tmin,
relative humidity mean, dew point mean and daily minimum temperature percentiles and the number of circulatory cases over 52 weeks of the year.
This Graphic 4.1 addresses the relationship between weekly rainfall percentages and the number of weekly circulatory cases over a year (52 weeks) for 10 years. By a detailed analysis we can say that for rainfall early weeks (e.g., weeks 1–5): high rainfall dominated by 75–100% percentile. in middle weeks (e.g., weeks 20–35): rainfall is more evenly distributed across percentiles, with moderate levels overall. Later weeks (e.g., weeks 45–52): mixed rainfall with spikes in the higher percentiles. For circulatory cases data, peaks occur in weeks 5, 27, and 50–52, and valleys occur in weeks 12–20, indicating a decrease in cases during this period. The 3rd degree polynomial fit indicates a sinusoidal-like pattern, with lower cases in the middle of the year and peaks towards the start and end.
By observing Graph 4.2 we can say that wind speed data for weeks 1–7: high wind speeds dominate, particularly in the 75–100%. In weeks 8–25: wind speeds decrease, with lower percentiles (0–25% and 25–50%) more prominent. Weeks 26–40: balanced wind speed distribution, with all percentiles contributing evenly. And for weeks 41–52: high wind speeds (75–100%) increase again, resembling the pattern at the year's start. The circulatory cases data shows the weekly number of circulatory cases with peaks occur around weeks 6, 28, and 48–52. Dips are visible in weeks 10–20. For circulatory diseases we can highlight two major peaks. One in the early year (weeks 1–7) and the second in the late of the year (weeks 45 - 52). The 3rd Degree Polynomial Fit suggests a sinusoidal-like pattern with higher circulatory cases at the year's start and end and a mid-year dip.
Graph 4.3 depicts the thermal amplitude percentiles (Tmax - Tmin) versus the number of circulatory cases admissions. During weeks 1–10, large thermal amplitudes (75–100%) dominate. For weeks 11–30, thermal amplitude decreases, with 0–25% and 25–50% percentiles becoming more prominent. And for the weeks 31–52, Thermal amplitudes increase again, with a significant contribution from higher percentiles (50–100%). For circulatory cases data peaks occur during weeks 6, 27, and 50–52. Notable dips appear during weeks 10–20, indicating a decline in cases during this period. The moving average indicates two major peaks, one in the early in the year (weeks 1–7) and the other in the late in the year (weeks 45–52). The middle of the year (weeks 15–30) shows consistently lower circulatory cases. The 3rd degree polynomial fit exhibits a sinusoidal pattern with higher cases at the year's start and end and lower cases mid-year.
Figure 4. Graph 4.1 to 4.6 presents the average weekly number of hospitalizations for cases of circulatory diseases (black line), moving average (red line), 3rd degree polynomial fit (dotted line) and interval percentiles per week for some meteorological parameters (Faial, 2010 – 2019).
Graph 4.4 illustrates the relationship between relative humidity (expressed in percentiles) and the number of circulatory cases admissions over 52 weeks for 10 years. Relative humidity fluctuates significantly over the weeks. Certain weeks, particularly at the beginning (weeks 4–7) and later in the year (weeks 43–50), show peaks in the highest percentile (75–100%). The circulatory cases appear to increase and decrease periodically, with notable peaks in weeks 6–8, weeks 20–22, and around weeks 43–46. The moving average captures the overarching trends, showing general increases in cases during certain humid periods. Higher circulatory cases seem to coincide with weeks showing significant humidity contributions from the higher percentiles (e.g., weeks 6–8 and weeks 43–46). The polynomial fit suggests an overall periodic pattern, potentially linked to environmental or seasonal factors.
Graph 4.5 presents a relationship between dew point percentiles versus the number of circulatory diseases cases admissions. We can verify that high dew point levels (75–100%) dominate in several weeks (e.g., weeks 24–40), showing a consistent warm/humid environment. Weeks at the beginning (1–10) and end (45–52) of the year have a more varied distribution, including lower dew point levels (0–50%). Peaks in circulatory cases are observed in weeks 6–9, 20–22, and 43–46. A decrease in cases is notable in midyear weeks (weeks 25–35), corresponding to a more stable dominance of high dew point (75–100%). The moving average highlights periodic increases and decreases. Higher dew point periods (e.g., weeks 25–40) correspond to fewer circulatory cases admissions. During weeks with more variability or significant contributions from lower dew point percentiles (e.g., weeks 6–10, 43–46), circulatory cases tend to rise. The polynomial fit suggests a general decline in circulatory cases during midyear and a resurgence in later weeks.
Graph 4.6 displays a mean weekly temporal analysis per year for 10 years (52 weeks), combining two datasets such as daily minimum temperature percentiles and number of circulatory cases admissions. It is observed that during colder periods, peaks in circulatory cases are noticeable, particularly in the early (weeks 1-12) and late parts of the year (weeks 40-52). In warmer periods (weeks 20-35), the number of cases seems to decrease, suggesting a possible direct relationship between climate conditions and circulatory health. The black line (weekly cases) shows significant fluctuations, but the smooth red line reveals a cyclical pattern. Warmer weeks not only align with higher percentiles (75-100%) but also with stabilization in circulatory cases. The polynomial curve indicates a bimodal pattern, with peaks of cases during colder seasons.
3.4. Principal Component Analysis
In a Principal Component Analysis two components are used (PC1 and PC2) to reduce the dimensionality of a dataset while retaining the most relevant variability. To investigate the possible dependence of the daily number of admissions of diseases under study on meteorological elements or air quality, principal component analysis may be appropriate.
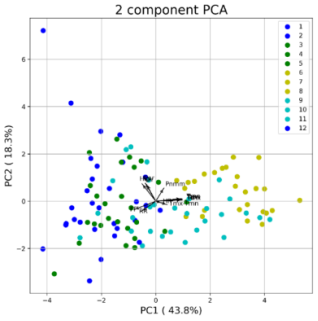
Figure 5 shows a principal components analysis using monthly totals of diagnosed hypertension, circulatory and cardiovascular system cases, together with monthly averages of (Tam), maximum (Tmax), minimum (Tmin) daily temperatures, daily thermal amplitude (Tmax-Tmin), dew point (DP), relative humidity (RH), wind speed (FF) and atmospheric mean sea level pressure (Pnmm) as well as monthly precipitation totals (RR).
The first component explains around 44% of the variance and that the summer and autumn months (6 to 11) are distributed on the positive side of PC1, where the vectors of temperatures, relative humidity and atmospheric pressure are projected. On the negative side, the winter and spring months (1 to 5 and 12) and the vectors of precipitation and wind speed are distributed, as well as diseases associated with hypertension, circulatory and cardiovascular systems. In this case, the disease vectors are almost perpendicular to the wind speed and precipitation vectors, suggesting that these are two sets of variables that are not very dependent on each other.
The daily thermal amplitude (Tmx-Tmn) and the air temperature (Tam), as well as the relative humidity and the dew point temperature, present a component in the opposite direction to the diseases considered, indicating a possible dependence in opposite direction or negative correlation. These results indicate that these cases will tend to occur in the winter and spring months, but with small daily temperature ranges and relatively low air temperatures and humidity.
To better understand the relationships between hospital admissions for the diseases under study and the meteorological variables presented in
Figure 5, principal component analysis was conducted.
Table 2 presents the values of the first two principal components, highlighting their relevance to the analysis.
Figure 5. Graphical representation of the first two principal components (PCA) for the set of cases of hypertension (HIP), circulatory system (CIR) and cardiovascular system (CAR), as well as for the monthly averages of atmospheric pressure at mean sea level (Pnmm), daily maximum (Tmx), minimum (Tmn) and average (Tam) temperatures, thermal amplitude (Tmx-Tmn), dew point (DP), relative humidity (RH) and wind speed (FF) average total precipitation (RR). The colored dots correspond to the twelve months of the year (Jan=1, Feb=2, …, Dec=12).
Table 2.
PCA1 PCA2 values for the set of cases of hypertension (HIP), circulatory system (CIR) and cardiovascular system (CAR) and monthly meteorological variables (Figure 5). Variables | PC1 | PC2 |
Hip | -0,49595 | 0,721952 |
Cir | -0,33471 | 0,695752 |
Car | -0,37816 | 0,747348 |
Td | 0,951358 | 0,067222 |
Tmx-Tmn | 0,407151 | -0,14518 |
Pnmm | 0,292164 | 0,542491 |
Tam | 0,952752 | 0,080203 |
Tmx | 0,957953 | 0,052191 |
Tmn | 0,93956 | 0,108516 |
HR | 0,211238 | -0,06672 |
RR | -0,51372 | -0,41972 |
FF | -0,79084 | -0,35446 |
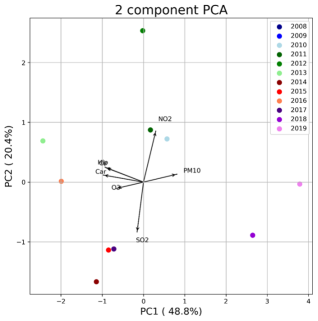
Figure 6 shows the PCA analysis for the average concentrations of O
3, NO
2, SO
2 and PM10.
The results obtained show that PC1 explains around 35.4%, that is, less than for meteorological variables. On the other hand, it appears that the vectors associated with diseases have a direction closer to the NO2 and SO2 vectors, especially in the winter and spring months. These results indicate that the presence of primary pollutants such as NO2 and SO2, in the winter and spring months, may contribute to a greater influx of individuals with diseases under study at the Faial hospital.
Figure 6. Graphical representation of the first two principal components (PCA) for the set of monthly cases of hypertension (HIP), circulatory system (CIR) and cardiovascular system (CAR), as well as for the monthly averages NO2, SO2, O3 and PM10. The colored dots correspond to the twelve months of the year (Jan=1, Feb=2, …, Dec=12).
Table 3 shows the calculated values of PCA1 and PCA2 for the set of cases of hypertension (HIP), circulatory system (CIR) and cardiovascular system (CAR) and monthly air quality variables (
Figure 6).
Table 3.
PCA1 and PCA2 values for the set of cases of hypertension (HIP), circulatory system (CIR) and cardiovascular system (CAR) and monthly air quality variables (Figure 6). Variables | PC1 | PC2 |
HIP | 0,929598 | -0,01412 |
CIR | 0,786072 | -0,13734 |
CAR | 0,903412 | -0,00308 |
NO2 | -0,03535 | -0,08532 |
O3 | 0,359594 | 0,729433 |
SO2 | 0,102457 | 0,227268 |
PM10 | -0,20486 | 0,804141 |
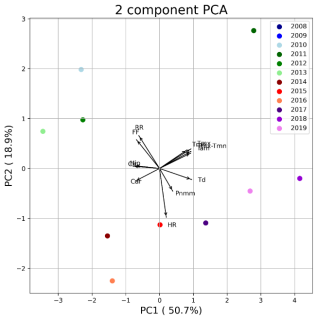
Figure 7. Graphical representation of the first two principal components for the set of cases of hypertension (HIP), circulatory system (CIR) and cardiovascular system (CAR), as well as for the annual averages of atmospheric pressure at mean sea level (Pnmm), maximum temperatures (Tmx), daily minimum (Tmn) and average (Tam), thermal amplitude (Tmx-Tmn), dew point (DP), relative humidity (RH) and wind speed (FF) and average total precipitation (RR). The colored dots correspond to the years 2008 to 2019.
The graphic representation in
Figure 7 presents the results obtained for the set of three diseases under study and for the meteorological values observed between 2008 and 2019. The first component (PC1) explains 50.7% of the variance and the second (PC2), 18.9%, totaling 69.6% of the variance. The graph also indicates that the most recent years contributed essentially to the variance of PCA1.
As expected, daily temperatures (Tam, Tmx, Tmn and Tmx-Tmn) are correlated, contributing mainly to PC1.
In this diagram, the number of admissions to cardiovascular diseases (CAR) presents negative correlations with these temperatures, suggesting that the respective admissions will be associated with cold days with low thermal amplitude.
On the other hand, hypertension (HIP) and circulatory diseases (CIR) have a negative correlation with dew point temperature (Td).
Precipitation totals (RR) and wind speed (FF) are correlated, and mean sea level pressure has a negative correlation with the previous ones, but they seem to be little associated with the diseases under study. Interestingly, the relative humidity (RH) vector appears almost perpendicular to the diseases, indicating a lack of correlation with them.
Table 4 presents the values of PCA1 and PCA2 for cases of hypertension (HIP), circulatory system diseases (CIR), and cardiovascular system diseases (CAR), alongside the annual meteorological variables discussed in
Figure 7.
Table 4.
PCA1 and PCA2 values for the set of cases of hypertension (HIP), circulatory system (CIR) and cardiovascular system (CAR) and annual meteorological variables (Figure 7). Variables | PC1 | PC2 |
HIP | -0,75172 | -0,09147 |
CIR | -0,79879 | -0,1017 |
CAR | -0,76299 | -0,35617 |
Td | 0,938054 | -0,25518 |
Tmx-Tmn | 0,932466 | 0,202731 |
Pnmm | 0,33768 | -0,54276 |
Tam | 0,906769 | 0,119969 |
Tmx | 0,917765 | 0,188284 |
Tmn | 0,787711 | 0,149842 |
HR | 0,14443 | -0,93453 |
RR | -0,5634 | 0,727954 |
FF | -0,671 | 0,482905 |
NO2 | -0,24621 | 0,765525 |
O3 | -0,58423 | -0,41735 |
SO2 | -0,07411 | -0,76566 |
PM10 | 0,491552 | 0,344394 |
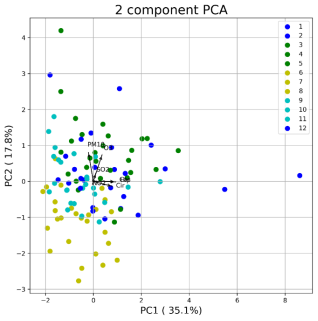
Figure 8 shows the PCA of the set of diseases under study with the average concentrations of ozone, nitrogen dioxide, sulfur dioxide and suspended particles PM10.
The results indicate a positive correlation between diseases and O3 concentrations, whose higher concentration levels may be associated with the intercontinental transport of this pollutant. In relation to PM10 particles, there is an anti-correlation which is possibly associated with transport events of suspended material and dry weather conditions. The graph also tells us that, also in this case, the most recent years essentially contributed to the PCA1 variance.
In order to further analyze the relationship between hospital admissions for hypertension (HIP), circulatory system diseases (CIR), and cardiovascular diseases (CAR) and air quality variables, principal component analysis (PCA) was applied.
Table 5 presents the values of the first two principal components for these conditions, alongside the annual air quality variables shown in
Figure 8.
Figure 8. Graphical representation of the first two principal components for the set of cases of hypertension (HIP), circulatory system (CIR) and cardiovascular system (CAR), as well as for the annual averages of NO2, SO2, O3 and PM10. The colored dots correspond to the years 2008 to 2019.
Table 5.
PCA1 and PCA2 values for the set of hypertension (HIP), circulatory system (CIR) and cardiovascular (CAR) cases and annual air quality variables (Figure 8). Variables | PC1 | PC2 |
HIP | -0,92584 | 0,24794 |
CIR | -0,89984 | 0,237591 |
CAR | -0,97183 | 0,117763 |
NO2 | 0,297674 | 0,852939 |
O3 | -0,64697 | -0,10473 |
SO2 | -0,15504 | -0,83686 |
PM10 | 0,807812 | 0,131691 |
4. Discussion
4.1. Percentile Graphs
These results could imply a seasonal or weather-related influence on cardiovascular admissions, potentially useful for public health forecasting, particularly if analyzed in the context of temperature, humidity, or other environmental variables. Analysis with other meteorological and environmental parameters will be developed throughout this study.
Analyzing
Figure 2, the visual representation (Graph 2.1) could support hypotheses about the impact of weather patterns on cardiovascular health. There are several studies, including
| [31] | Higuma, T., Yoneyama, K., Nakai, M. et al. (2021). Effects of temperature and humidity on acute myocardial infarction hospitalization in a super-aging society. Sci Rep 11, 22832. https://doi.org/10.1038/s41598-021-02369-x |
[31]
the environmental conditions, low temperatures have been reported to be a potentially important risk factor for acute myocardial infarction: AMI, and cardiovascular mortality. Therefore, meteorological temperature is considered a risk factor for AMI. In the summer months (starting around the 27th week and ending around the 37th week), there are fewer hospital admissions, with low values for rainfall (1st percentile). The results observed in Graph 2.2, data might suggest that wind speed variations have some influence on cardiovascular events, particularly during periods of higher wind speeds. The observed patterns could help in developing health forecasts related to cardiovascular events, especially when wind speeds are expected to increase significantly. This graph suggests an interesting link between wind speed and cardiovascular health. Higher levels of wind speed are associated with a greater number of particles suspended in the atmosphere. Study
| [16] | Brook, R. D., Rajagopalan, S., Pope, C. A., Brook, J. R., Bhatnagar, A., Diez-Roux, A. V., Holguin, F., Hong, Y., Luepker, R. V., Mittleman, M. A., Peters, A., Siscovick, D., Smith, S. C., Jr, Whitsel, L., Kaufman, J. D. (2010). Particulate matter air pollution and cardiovascular disease: An update to the scientific statement from the American Heart Association. Circulation, 121(21), 2331–2378. https://doi.org/10.1161/CIR.0b013e3181dbece1 |
[16]
refers that exposure to PM <2.5 micron in diameter PM (2.5)) over a few hours to weeks can trigger cardiovascular disease-related mortality and nonfatal events; longer-term exposure (e.g., a few years) increases the risk of cardiovascular mortality to a greater extent than exposures over a few days and reduces life expectancy within more highly exposed segments of the population by several months to a few years. Observing Graph 2.3, there appears to be a seasonal relationship between the temperature range and cardiovascular cases, with the lowest temperature ranges at the year's start and end associated with higher cardiovascular cases. The middle of the year, characterized by a larger temperature range, shows relatively stable cardiovascular case numbers, suggesting that sudden or large temperature fluctuations might not correlate as strongly with increases in cardiovascular cases. Results could indicate that cardiovascular health is more sensitive to the lowest temperature ranges. Understanding this relationship could be beneficial for public health forecasting and preventive strategies, especially if coupled with additional meteorological or health data. Seasonal temperature patterns might be a useful indicator for anticipating periods of higher cardiovascular risk. This graph supports the idea that temperature variability plays a role in cardiovascular health trends and could be integrated into predictive models for better health outcome forecasts. For Graph 2.4, a relationship appears between relative humidity levels and cardiovascular admissions to the hospital during certain weeks, particularly during mid-year, when lower humidity aligns with a lower count of cardiovascular cases or admissions. Peaks in cardiovascular cases or admissions (early and late in the year) often coincide with periods of higher relative humidity. The data suggests a possible seasonal pattern in cardiovascular cases, potentially influenced by fluctuations in relative humidity. Higher cardiovascular cases align with weeks of higher humidity, indicating that humidity may be a factor affecting cardiovascular health outcomes. Klompmarker
| [32] | Klompmaker, J. O., Laden, F., James, P., Sabath, M. B., Wu, X., Dominici, F., Zanobetti, A., Hart, J. E. (2023). Long-term exposure to summer specific humidity and cardiovascular disease hospitalizations in the US Medicare population. Environment International, 179, ISSN 0160-4120, https://doi.org/10.1016/j.envint.2023.108182 |
[32]
higher summer average specific humidity and specific humidity variability were positively associated with cardiovascular diseases hospitalizations among this cohort of US Medicare beneficiaries. In Graph 2.5 we check an apparent seasonal pattern, with cardiovascular admissions being higher when dew point levels are low (weeks 1–20 and 45–52) and decreasing when the dew point is higher (weeks 20–42). The graph suggests a possible inverse relationship between dew point levels and cardiovascular admissions diseases. Higher dew point weeks (associated with more humid or warmer air) correlate with a lower number of cardiovascular cases, while lower dew points are linked with an increase in cardiovascular diseases admissions. This data may indicate that lower dew point levels, often associated with colder or drier conditions, correspond to higher cardiovascular incidents. Conversely, higher dew points, typically related to warmer or more humid air, seem to align with a reduction in admissions for this pathology. The observed pattern suggests that dew point could be a factor in cardiovascular health trends. By inspection of
Figure 7, there is a clear seasonal pattern where cardiovascular admissions in the Faial hospital increase during colder weeks (low minimum temperatures) and decrease during warmer weeks (higher minimum temperatures). Also, the graph suggests an inverse relationship between minimum temperature and cardiovascular cases. Lower minimum temperatures (usually in colder months) are associated with an increase in cardiovascular cases, while higher temperatures (warmer months) correlate with a reduction in cases. Really, the data suggests that lower minimum temperatures, common in colder months, might be associated with a higher number of cardiovascular cases, while higher minimum temperatures in warmer months correlate with fewer cardiovascular incidents. This seasonal trend indicates that temperature could be a contributing factor to cardiovascular health outcomes, potentially due to the physiological stress colder temperatures impose on the cardiovascular system.
Looking at
Figure 3, Graph 3.1 implies that hypertension cases might be influenced by climatic factors, like rainfall. For Graph 3.2, there is some visual fluctuation in hypertension cases that aligns with periods of higher wind speeds, particularly in the initial weeks of the year and around mid-year. While there are instances where high wind speeds coincide with higher hypertension cases, this correlation is not strongly pronounced. Hypertension cases have a fluctuating pattern, with peaks at various points throughout the year, notably around weeks 5-7 and weeks 35-40. The polynomial trend line suggests a moderate upward trend in hypertension cases as the year progresses, with a few seasonal fluctuations. The red moving average line shows relatively stable trends over time, though it captures some mid-year peaks and dips that may be associated with environmental factors or other conditions. This graph suggests a possible association between wind speed and hypertension cases. Periods of high wind speeds show some corresponding increases in hypertension, yet the relationship is complex. The data could be useful for investigating the impact of wind speed on hypertension cases, especially if combined with other environmental variables. Graph 3.3 suggests a possible association between the weekly temperature range and the number of hypertension cases, though the relationship is not straightforward. The data shows that larger weekly temperature variations may contribute to higher hypertension cases in certain periods, but this connection is not consistent. This visualization can be useful for exploring the impact of temperature variation on hypertension, offering potential insights into how environmental temperature fluctuations may affect health, especially cardiovascular conditions like hypertension. The cyclic behavior of hypertension cases (Graph 3.4) may be influenced by environmental factors like humidity. High relative humidity correlates with some peaks in hypertension cases, but the relationship is not strictly linear. Understanding the interaction between atmospheric humidity and hypertension cases can inform public health strategies, especially during high-risk periods (e.g., weeks 5–7, 20–22, and 35–37). Monitoring humidity alongside other weather variables could help predict hypertension trends and prepare healthcare systems accordingly. Graph 3.5, high dew points (humid conditions) appear to coincide with peaks in hypertension cases, while low dew points (dry conditions) align with reduced cases. This suggests a potential link between moisture levels in the air and hypertension, possibly mediated by physiological or behavioral responses to humidity. Both dew point and hypertension cases exhibit seasonal variations. Monitoring dew point trends could help predict periods of increased hypertension risk, allowing for proactive healthcare interventions. In Graph 3.6, we can observe a correlation between minimum temperature and hypertension is verified in which cold temperatures and hypertension peaks are verified in weeks 5–7: high hypertension cases coincide with colder temperatures (0–25% range). In weeks 43–48, a slight rise in hypertension cases corresponds to a return to lower temperatures. Hospitalizations for hypertensive crises are less frequent during summer-time high temperatures, this statement is supported by previous studies
. Low temperatures and thereby wintertime are associated with a higher number of hospitalizations. On the other hand, warm temperatures are related to fewer hypertension cases, occurring in weeks 10–15, such as minimum temperatures rise (50–100% ranges), hypertension cases decline. In weeks 20–40, despite peaks in weeks 20–22 and 35–37, the overall warmer temperatures align with moderate hypertension levels. Peaks in hypertension occur during periods of shifting temperature distributions.
Discussing the results observed in
Figure 4, we say that in Graph 4.1, a relationship occurs between rainfall and circulatory cases is expressed as follows, weeks with higher rainfall percentiles (e.g., 75–100%) correspond to higher circulatory cases, especially in weeks 3–5. Lower rainfall weeks coincide with fewer circulatory cases (e.g., weeks 20–30). And an increase in both rainfall and circulatory cases is observed (weeks 45–52). Rainfall appears to have a seasonal trend, with high rainfall concentrated in the early and late weeks of the year. Circulatory cases align with these trends, suggesting a potential link between high rainfall and circulatory health issues. The graph suggests a relationship between rainfall and circulatory cases, particularly in the early and late parts of the year. The polynomial trend and moving average help capture the seasonality and deviations, while the percentile breakdown provides detailed insights into the variability of rainfall. Relationship between wind speed and circulatory cases, it is present in Graph 4.2. In this graph in the early year there are high wind speeds (75–100%) align with a peak in circulatory cases during weeks 1–7. In the middle year the circulatory cases decline as wind speeds decrease and are dominated by lower percentiles. For the late year an increase in high wind speeds (75–100%) corresponds to a rise in circulatory cases during weeks 45–52. Wind speeds show a seasonal trend, with high values concentrated in the early and late weeks of the year. Circulatory cases align with these trends, suggesting a potential link between high wind speeds and circulatory health issues. High wind speeds might correlate with colder or harsher weather conditions, indirectly affecting circulatory health. Environmental stressors (like air quality changes or cold exposure) could mediate this relationship. Some weeks, like week 28, exhibit high circulatory cases despite moderate wind speeds, indicating other factors influencing health outcomes. For Graph 4.3, the relationship between thermal amplitude and circulatory cases, we conclude that in the early year (weeks 1–10), it is verified that the thermal amplitude is high (75–100%) and align with a peak in circulatory cases admissions during weeks 5–7. This suggests that extreme temperature fluctuations may influence circulatory health. In middle year (weeks 11–30), there are lower thermal amplitude (0–50%) correspond with fewer circulatory cases. The stability in temperature may reduce stress on circulatory systems. In the later part of the year (weeks 31–52), there is an increase in thermal amplitude (50–100%), which coincides with a rise in circulatory cases during weeks 45–52. The relationship observed earlier in the year is mirrored here. Thermal amplitude shows a seasonal trend, with the largest ranges occurring at the year's start and end. Circulatory cases appear to correlate positively with higher thermal amplitudes, particularly in the early and late weeks of the year. May be, large temperature fluctuations may cause physiological stress, exacerbating circulatory issues like blood pressure regulation or cardiovascular strain. Stable thermal amplitudes in the mid-year may provide a more favorable environment for circulatory health. Graph 4.4 might suggest a potential link between relative humidity levels and the incidence of circulatory system-related cases. It shows that high humidity periods may correlate with increased circulatory diseases cases admissions. Graph 4.5 suggests a potential inverse relationship between high dew point levels (suggesting warm, humid conditions) and circulatory cases. Circulatory cases appear to be more frequent during weeks with greater variability in dew point levels or contributions from lower percentiles. And the analysis of Graph 4.6 suggests that extreme temperatures, particularly low ones, may be associated with an increase in circulatory diseases. It is plausible that cold temperatures elevate the risk of conditions like hypertension or heart attacks, while moderate heat (higher-median temperatures) might have protective effects. The graph highlights a strong seasonal component, which could be valuable for predictive health studies, particularly in regions with harsh winters. Preventive strategies should focus on colder seasons, including awareness campaigns and increased access to healthcare services.
4.2. Principal Component Analysis Graphs
A Principal Component Analysis is a very important tool because with two components (PC1 and PC2) it is possible to visualize multidimensional data in a two-dimensional space.
For meteorological variables and seasons of the year
Figure 5, the analysis showed that the variability of hospital admissions is strongly associated with seasonal conditions. PC1, which explains approximately 44% of the variance, separates the summer and autumn months (positive in PC1) from the winter and spring months (negative in PC1). Several meteorological factors, such as average, maximum and minimum temperatures, daily thermal amplitude and relative humidity, were inversely correlated with hospital admissions. Suggesting that colder and more humid climates, typical of winter and spring, are more conducive to an increase in hospital admissions. Additionally, the perpendicular position of the wind speed and precipitation vectors in relation to admissions indicates low dependence between these factors and the diseases analyzed. This separation may reflect weather patterns that do not directly influence the worsening of the health conditions assessed but may act as moderators in other contexts. For atmospheric pollutants
Figure 6, PCA results with air quality variables showed that primary pollutants such as nitrogen dioxide (NO
2) and sulfur dioxide (SO
2) are positively correlated with hospital admissions in the winter and spring months. This reinforces the hypothesis that pollutants from combustion sources, more concentrated in typical winter weather conditions, play a significant role in worsening the diseases analyzed. On the other hand, suspended particles smaller than 10 µm (PM10) showed an inverse relationship with admissions, while ozone (O
3) demonstrated a positive correlation. Across three major dimensions overall mortality, cardiovascular mortality, and respiratory mortality we found that long-term exposure to ambient (NO
2) significantly increases the corresponding risks of death, it is supported by
34
. In a study supported by
| [35] | Luo, K. et al. (2016). Acute Effects of Nitrogen Dioxide on Cardiovascular Mortality in Beijing: An Exploration of Spatial Heterogeneity and the District-specific Predictors. Sci. Rep. 6, 38328; https://doi.org/10.1038/srep38328 |
[35]
we found that short term exposure to (NO
2) was associated with elevated risk of total cardiovascular, cerebrovascular and ischemic heart disease mortalities. The mechanisms involved in the genesis of circulatory diseases by exposure to pollutants have not been well explored, but a possible mechanism could be the increase in plasma fibrinogen and inflammatory factors, which lead to increased blood viscosity, resulting in clinical cardiovascular events
<a></a>36<a></a>. The patterns
Figure 6, may be associated with variability in the intercontinental transport of pollutants and the influence of specific meteorological conditions, such as drought or transport of particulate matter. With
Figure 7, we can have a perception of annual variations and recent contributions. When analyzing annual data from 2008 to 2019, it was observed that meteorological variables explain 69.6% of the variance, with 50.7% attributed to PC1. More recent years have contributed more significantly to PC1 variability, possibly due to climate change or more pronounced air quality patterns. The negative correlation between average temperatures and thermal amplitude with hospital admissions suggests that cold days with low thermal variation are critical factors for the increase in admissions cases. However,
<a></a>37<a></a> the interaction between a daily temperature change of ≥5 °C and a daily humidity change of ≥40% showed a positive association with daily hospitalization counts, increasing the daily number of hospitalizations by 29.0%.
Figure 8, the results indicate a positive correlation between diseases and O
3 concentrations, whose higher concentration levels. Also, an increase of 10 µg/m
3 of SO
2 in the daily average corresponded to 0.7% of all cardiovascular hospitalizations on the same day and the next
| [38] | Amancio C. T., Nascimento, L. F. (2012). Association of sulfur dioxide exposure with circulatory system deaths in a medium-sized city in Brazil. Braz J Med Biol Res. 45(11): 1080-1085. https://doi.org/10.1590/s0100-879x2012007500131 |
[38]
.
On the other hand, a study conducted in Finland identified an association between exposure to PM and death from stroke
| [39] | Kettunen, J., Lanki, T., Tiittanen, P., Aalto, P. P., Koskentalo, T., Kulmala, M., et al. (2007). Associations of fine and ultrafine particulate air pollution with stroke mortality in an area of low air pollution levels. Stroke, 38: 918–922. https://doi.org/10.1161/01.STR.0000257999.49706.3b |
[39]
.
In terms of variance explained each
Tables 2, 3, 4, and 5 explicitly includes the percentage of variance explained by each principal component (e.g., PC1 and PC2). This provides a clearer understanding of how much variability in the dataset is captured by each component. Tables include information about which variables (e.g., temperature, wind speed, or pollutants) are most strongly correlated with hospital admissions for specific health conditions.
Table 2 provides the PCA1 and PCA2 variance for hospital admissions and meteorological variables, allowing us to evaluate their significance:
1) Hospital Admissions (HIP, CIR, CAR):
a. PCA1 (Strong Negative Correlation) with HIP (-0.49595), CIR (-0.33471), and CAR (-0.37816) exhibit negative correlations with PCA1. This suggests that hospital admissions increase under colder atmospheric conditions (low temperatures and small thermal amplitudes) and higher wind speeds (FF) and precipitation (RR).
b. PCA2 (Positive Correlation) with HIP (0.721952), CIR (0.695752), and CAR (0.747348) are strongly positively correlated with PCA2. This indicates that secondary meteorological factors, like relative humidity (RH) and atmospheric pressure (Pnmm), may modulate hospital admissions.
2) Meteorological Variables:
a. Dew Point (Td):
a) PCA1 (0.951358): Strong positive correlation suggests that higher dew point temperatures (associated with warmer, more humid conditions) are linked to fewer hospital admissions.
b) PCA2 (0.067222): Minimal influence on secondary patterns.
b. Thermal Amplitude (Tmx-Tmn):
a) PCA1 (0.407151): Moderate positive correlation indicates that larger daily temperature ranges (associated with warmer seasons) correspond to fewer hospital admissions.
b) PCA2 (-0.14518): Slight negative contribution suggests a limited role in secondary seasonal effects.
c. Atmospheric Pressure (Pnmm):
a) PCA1 (0.292164): Weak positive correlation suggests minimal influence on the primary component.
b) PCA2 (0.542491): Moderate positive contribution highlights Pnmm’s relevance to secondary weather patterns.
d. Average Temperature (Tam):
a) PCA1 (0.952752): Very strong positive correlation confirms the protective effect of warmer average temperatures against hospital admissions.
b) PCA2 (0.080203): Minimal contribution to PCA2.
e. Maximum Temperature (Tmx):
a) PCA1 (0.957953): Strong positive loading highlights the significant role of higher maximum temperatures in reducing hospital admissions.
b) PCA2 (0.052191): Negligible influence on secondary effects.
f. Minimum Temperature (Tmn):
a) PCA1 (0.93956): Strong positive correlation indicates that warmer minimum temperatures correspond to fewer hospital admissions.
b) PCA2 (0.108516): Weak positive contribution reflects minimal secondary influence.
g. Relative Humidity (RH):
a) PCA1 (0.211238): Weak positive correlation suggests a minor protective role.
b) PCA2 (-0.06672): Negligible contribution to secondary patterns.
h. Precipitation (RR):
a) PCA1 (-0.51372): Moderate negative correlation indicates that increased precipitation is associated with higher hospital admissions.
b) PCA2 (-0.41972): Negative contribution aligns with the secondary role of RR in exacerbating admissions.
i. Wind Speed (FF):
a) PCA1 (-0.79084): Strong negative correlation indicates that higher wind speeds, often accompanying colder conditions, correlate with increased hospital admissions.
b) PCA2 (-0.35446): Moderate negative contribution suggests consistent impact across components.
From the analysis carried out, we found that seasonal Impacts in Hospital admissions are highest during colder seasons when PCA1 variables dominate. Warmer seasons with higher temperatures and dew points correspond to fewer hospital admissions, as captured by the strong positive variances of Tam, Tmx, and Td on PCA1.
Table 3 summarizes PCA1 and PCA2 variances for hospital admissions and air quality variables, showing the influence of specific pollutants on health outcomes:
1) Hospital Admissions (HIP, CIR, CAR):
a. PCA1 (Strong Positive Correlation):
a) HIP (0.929598), CIR (0.786072), and CAR (0.903412) are strongly positively correlated with PCA1.
b) This suggests that hospital admissions increase in association with air quality variables represented by PCA1, particularly under conditions dominated by pollutants like NO2 and SO2.
b. PCA2 (Weak Negative Correlation):
a) HIP (-0.01412), CIR (-0.13734), and CAR (-0.00308) have minimal or weak negative correlations with PCA2.
b) This indicates a limited influence of the secondary component on hospital admissions, suggesting that PCA1 captures the primary impact of air pollution.
2) Air Quality Variables:
a. Nitrogen Dioxide (NO2):
a) PCA1 (-0.03535): Negligible negative correlation indicates a weak direct relationship between NO2 levels and PCA1.
b) PCA2 (-0.08532): Weak negative contribution to PCA2, reflecting minimal relevance in secondary seasonal patterns.
b. Sulfur Dioxide (SO2):
a) PCA1 (0.102457): Weak positive correlation suggests SO2 contributes modestly to conditions associated with increased hospital admissions.
b) PCA2 (0.227268): Moderate positive contribution to PCA2 highlights SO2’s secondary seasonal impact.
c. Ozone (O3):
a) PCA1 (0.359594): Moderate positive correlation implies that higher O3 concentrations are associated with admissions, potentially as a secondary pollutant under specific conditions.
b) PCA2 (0.729433): Strong positive correlation with PCA2 reflects O3’s role in warmer seasonal patterns, potentially linked to photochemical activity.
d. Particulate Matter (PM10):
a) PCA1 (-0.20486): Negative correlation suggests an inverse relationship with PCA1, potentially reflecting PM10’s seasonal variability and its reduced influence on admissions during winter.
b) PCA2 (0.804141): Strong positive correlation with PCA2 indicates PM10’s significant role in secondary seasonal effects, especially during dry conditions.
Table 4 summarizes the PCA1 and PCA2 variances for hospital admissions and meteorological variables. These values indicate the influence of specific variables on the patterns observed:
1) Hospital Admissions (HIP, CIR, CAR):
a. PCA1 (Strong Negative Correlation):
a) HIP (-0.75172), CIR (-0.79879), and CAR (-0.76299) are all negatively correlated with PCA1. This suggests that hospital admissions increase under colder and more stable atmospheric conditions, characterized by low temperatures (Tmx, Tmn, Tam) and small thermal amplitudes (Tmx-Tmn).
b) These negative correlations emphasize that colder seasons are critical for increased hospitalizations.
b. PCA2 (Weak Negative Correlation):
HIP (-0.09147), CIR (-0.1017), and CAR (-0.35617) show weaker negative correlations with PCA2, indicating minimal influence from secondary meteorological factors like relative humidity (RH) and precipitation (RR).
2) Meteorological Variables:
a. Dew Point (Td):
a) PCA1 (0.938054): Strong positive correlation suggests that higher dew point temperatures (associated with warmer, more humid conditions) correspond to reduced hospital admissions.
b) PCA2 (-0.25518): Moderate negative loading reflects Td’s influence on secondary seasonal patterns.
b. Thermal Amplitude (Tmx-Tmn):
a) PCA1 (0.932466): Strong positive correlation indicates that larger daily temperature variations, typical of warmer seasons, are linked to fewer hospital admissions.
b) PCA2 (0.202731): Moderate positive contribution suggests relevance in specific weather patterns.
c. Atmospheric Pressure (Pnmm):
a) PCA1 (0.33768): Weak positive correlation indicates limited influence on hospital admissions.
b) PCA2 (-0.54276): Moderate negative contribution suggests that low-pressure systems, which dominate in winter, might indirectly affect hospital admissions.
d. Average Temperature (Tam):
a) PCA1 (0.906769): Strong positive correlation confirms that warmer average temperatures reduce hospital admissions.
b) PCA2 (0.119969): Minor positive contribution reflects minimal influence on PCA2.
e. Maximum Temperature (Tmx):
a) PCA1 (0.917765): Strong positive loading highlights the protective effect of higher maximum temperatures on hospital admissions.
b) PCA2 (0.188284): Moderate positive contribution to secondary components.
f. Minimum Temperature (Tmn):
a) PCA1 (0.787711): Strong positive correlation with PCA1 confirms that warmer minimum temperatures are associated with fewer admissions.
b) PCA2 (0.149842): Weak positive contribution aligns with other temperature variables.
g. Relative Humidity (RH):
a) PCA1 (0.14443): Weak positive correlation suggests limited direct impact on hospital admissions.
b) PCA2 (-0.93453): Strong negative correlation indicates that higher relative humidity might exacerbate conditions leading to hospitalizations under certain weather patterns.
h. Precipitation (RR):
a) PCA1 (-0.5634): Moderate negative correlation reflects increased hospital admissions during wetter conditions, typically in winter.
b) PCA2 (0.727954): Strong positive loading emphasizes RR’s role in secondary seasonal effects.
i. Wind Speed (FF):
a) PCA1 (-0.671): Strong negative correlation indicates that higher wind speeds, often accompanying colder conditions, correlate with increased hospital admissions.
b) PCA2 (0.482905): Moderate positive contribution aligns with RR in PCA2.
Table 5 presents PCA1 and PCA2 variances for annual air quality variables (NO
2, SO
2, O
3, PM10) and hospital admissions. These values illustrate how hospital admissions correlate with air pollution levels across different components:
1) Hospital Admissions (HIP, CIR, CAR):
a. PCA1 (Negative Correlation):
a) HIP (-0.92584), CIR (-0.89984), and CAR (-0.97183) are strongly negatively correlated with PCA1.
b) This suggests that hospital admissions increase under conditions linked to high levels of pollutants such as NO2 and SO2, which typically peak during colder months.
b. PCA2 (Positive Correlation):
a) HIP (0.24794), CIR (0.237591), and CAR (0.117763) have weak positive correlations with PCA2.
b) This indicates a secondary influence from pollutants like O3 and PM10, which are more prevalent during warmer or drier conditions.
2) Air Quality Variables:
a. Nitrogen Dioxide (NO2):
a) PCA1 (0.297674): Weak positive correlation, suggesting NO2's role in wintertime pollution patterns associated with increased hospital admissions.
b) PCA2 (0.852939): Strong positive correlation with PCA2 reflects NO2’s contribution to secondary seasonal or regional effects.
b. Sulfur Dioxide (SO2):
a) PCA1 (-0.15504): Weak negative correlation indicates limited influence on the primary component.
b) PCA2 (-0.83686): Strong negative correlation suggests that SO2 concentrations, while impactful, are less relevant to secondary patterns of hospital admissions.
c. Ozone (O3):
a) PCA1 (-0.64697): Moderate negative correlation implies that higher O3 concentrations are associated with reduced hospital admissions during colder months.
b) PCA2 (-0.10473): Weak negative contribution to PCA2 suggests limited relevance in warmer-season patterns.
d. Particulate Matter (PM10):
a) PCA1 (0.807812): Strong positive correlation indicates a significant role for PM10 in the primary component, likely tied to particulate transport events during drier, colder conditions.
b) PCA2 (0.131691): Weak positive correlation reflects its minor contribution to secondary seasonal effects.
The results of the PCA analysis suggest that continuous monitoring of weather conditions and air quality can enable more accurate forecasts and targeted preventive actions, especially in higher risk months. The relationship between specific pollutants and hospital admissions highlights the need for more effective policies to control emissions of these gases, particularly in critical months such as winter and spring.
For linking our results more explicitly to public health policies and practices we propose early warning systems, targeted interventions, integrated monitoring and policy recommendations. Our findings on the influence of minimum temperatures, humidity, and air pollutants on hospital admissions highlight the potential for developing early warning systems. These systems could alert healthcare providers and at-risk populations during periods of extreme weather or poor air quality. For the other hand, the seasonal patterns identified suggest the need for targeted interventions during high-risk periods (e.g., winter months). Measures could include public health campaigns to encourage preventive behaviors, enhanced access to healthcare services, and support for vulnerable populations. Also, we recommend incorporating meteorological and air quality monitoring into health management systems to improve the predictability of health risks and allocate resources more effectively. For policy recommendations, our results reinforce the necessity of policies aimed at mitigating air pollution, particularly reducing emissions of NO2 and SO2 during winter and spring months. These additions strengthen the connection between the study’s findings and practical measures that can enhance public health resilience in the face of environmental challenges.
High relative humidity was found to correlate with increased hospital admissions for hypertension, particularly during the winter months. This effect may be attributed to the physiological stress caused by high moisture levels in combination with low temperatures, exacerbating conditions like blood pressure dysregulation. Small thermal amplitude (daily temperature fluctuations <5°C) was linked to an increase in hypertension-related hospitalizations, potentially due to a lack of physiological adaptation to sudden temperature changes. In our study we find that cold and humid conditions have a compounded effect on hypertension risk. This aligns with the hypothesis that combined environmental stressors intensify health risks. For example, ensuring access to well-heated living spaces and promoting public awareness about the risks of cold exposure could mitigate these effects.
According to the Fourth Assessment Report of the Intergovernmental Panel on Climate Change in 2007, extreme weather conditions and rapid, short-term changes in atmospheric conditions will become more and more frequent in the future
<a></a>40<a></a>. There are some studies about the relationship between climate change and health risks in small island regions.
<a></a>41<a></a> is highlight that small island states face health-related problems due to sea-level rise, including coastal flooding, storm surges, and salination of freshwater sources, leading to increased incidences of malaria, dengue fever, diarrheal diseases, and respiratory infections.
<a></a>42<a></a> the Intergovernmental Panel on Climate Change reports that small islands are increasingly affected by temperature increases, tropical cyclones, storm surges, droughts, and changing precipitation patterns, all of which have detectable impacts on both natural and human systems.
<a></a>43<a></a> the mental health challenges in developing island states, noting that climate change related events contribute to psychological stress and mental health disorders among island populations.
Our findings show that low temperatures and high humidity levels are associated with increased hospital admissions for hypertension and cardiovascular diseases align with prior research, such as
| [3] | Brook, R. D., et al. (2010). Particulate matter air pollution and cardiovascular disease: An update to the scientific statement from the American Heart Association. Circulation, 121(21), 2331–2378. https://doi.org/10.1161/CIR.0b013e3181dbece1 |
[3]
and
, which highlight the physiological stress of cold and humid conditions on cardiovascular systems. The significant impact of NO
2 and SO
2 pollutants on hospital admissions corroborates findings by
and
| [34] | Chen, X., Qi, L., Li, S., Duan, X. (2024). Long-term NO2 exposure and mortality: A comprehensive meta-analysis. Environmental Pollution, 341, ISSN 0269-7491, https://doi.org/10.1016/j.envpol.2023.122971 |
[34]
demonstrating the role of air pollution in exacerbating cardiovascular conditions. While some studies like
| [11] | Stafoggia, M., et al. (2017). Long-term exposure to ambient air pollution and incidence of cerebrovascular events: Results from 11 European cohorts within the ESCAPE project. Environmental Health Perspectives, 125(3), 357–364. https://doi.org/10.1289/EHP1237 |
[11]
report a strong correlation between PM10 levels and cardiovascular outcomes, our analysis revealed an inverse relationship. This divergence may be due to interactions with other climatic variables. Previous studies often focus on urban environments; in contrast, our findings in an insular region with unique climatic dynamics highlight localized effects that may not be as pronounced in mainland settings. By using data from the Azores, our study provides insights into the combined influence of maritime climate, air quality, and healthcare outcomes.
In the research carried out, the authors did not find references to studies on small islands and the parameters used in this study. Thus, a better understanding of atmospheric parameters can help establish new cardiovascular prevention strategies against them, suggested by Boussoussou
<a></a>37<a></a>.
5. Conclusions
This study sought to determine how meteorological and environmental factors influence cardiovascular health risks in the Azores. Also, providing compelling evidence of the significant influence of meteorological variables and air quality on hospital admissions for cardiovascular, hypertension, and circulatory system diseases in Faial Island, Azores, over the period from 2010 to 2019. The results reveal clear seasonal patterns, with colder months associated with higher hospital admissions, likely driven by the physiological stress induced by low temperatures, increased humidity, and higher pollutant concentrations. Conversely, warmer months exhibit a relative decline in admissions, reflecting the moderating effects of milder climatic conditions.
Key findings from the analysis demonstrate the intricate interplay between environmental factors and public health outcomes. Minimum temperatures, dew point levels, and wind speeds were among the most influential meteorological variables, while pollutants such as NO2 and SO2 showed strong correlations with hospitalizations during winter and spring. The observed inverse relationship between PM10 and hospital admissions, as well as the positive correlation with O3, underscores the complexity of pollutant impacts under varying climatic conditions. The specific findings highlight:
1) Temperature and thermal amplitude: lower minimum temperatures were associated with an increase in cardiovascular disease admissions, particularly during weeks with average temperatures in the 0–25% percentile range. Reduced thermal amplitudes (below 5°C) also corresponded to higher cardiovascular and circulatory admissions, reflecting the physiological stress of cold, stable weather conditions.
2) Humidity and dew point: weeks with higher relative humidity (above 75%) and lower dew points showed a consistent association with increased hypertension cases. This suggests that colder and more humid conditions exacerbate hypertensive crises.
3) Wind speed and precipitation: peaks in wind speed (75–100% percentile) correlated with an increase in circulatory disease cases, particularly in the winter months, possibly due to indirect effects such as cold air exposure. High precipitation levels (above 50 mm/week) were linked to cardiovascular and circulatory admissions, especially during prolonged wet conditions in late autumn and early winter.
4) Air quality: elevated levels of NO2 and SO2 were strongly associated with hospital admissions during the winter and spring months, indicating the impact of pollution under colder, stable atmospheric conditions. Particulate matter showed an inverse relationship with admissions, likely reflecting its seasonal variability and interaction with other pollutants.
These findings underscore the complex interplay between specific meteorological and air quality variables and their health impacts, highlighting critical periods for targeted interventions.
The application of Principal Component Analysis further highlighted the seasonal dependence of hospital admissions on meteorological and air quality variables. The winter and spring months emerged as high-risk periods, characterized by cold temperatures, small thermal amplitudes, and increased pollutant concentrations. The findings emphasize the need for region-specific analyses, particularly in insular areas like the Azores, where local climate dynamics and air quality variability can amplify health risks.
The values of variances presented in
Table 2 suggest implications about seasonal public health strategies with focus on winter months predicting increased hospitalizations due to adverse weather conditions. Implement interventions for high-risk populations during cold and wet periods. From
Table 3 we observed that HIP, CIR, and CAR are strongly positively correlated with PCA1, confirming that pollutants like NO
2 and SO
2 are significant contributors to hospital admissions, particularly in colder months. For public health targeted interventions should focus on reducing NO
2 and SO
2 during winter to mitigate health risks.
Table 4 presents negative PCA1 variances values for HIP, CIR, and CAR confirming that colder weather conditions, characterized by low temperatures, low thermal amplitudes, and high wind speeds, drive hospital admissions. This aligns with seasonal trends where winter conditions exacerbate hypertension, circulatory, and cardiovascular issues. For
Table 5 we conclude that the strong negative correlations of hospital admissions with PCA1 indicate that pollutants like NO
2 and PM10 are significant contributors to adverse health outcomes, particularly during colder months. The findings emphasize the need for seasonal air quality monitoring and targeted public health interventions, particularly during high-risk winter months when NO
2 and SO
2 peak.
This study underscores the importance of integrating meteorological and air quality monitoring into public health planning and policy development. Predictive models based on seasonal patterns and environmental variables can support early warning systems, enabling healthcare systems to prepare for periods of increased hospital admissions. Adaptive measures, such as public awareness campaigns, improved heating systems, and pollution control policies, are crucial for mitigating the adverse effects of environmental variability on population health.
As climate change continues to alter weather patterns and exacerbate air quality issues, these findings highlight the urgency of addressing the interconnected challenges of environmental and public health management. Future research should focus on expanding the geographic scope of similar studies, exploring the long-term health impacts of climate variability, and evaluating the effectiveness of adaptive interventions in vulnerable communities.
This research contributes to the growing body of evidence on the health impacts of climate variability, providing critical insights for developing proactive and regionally tailored public health strategies in the context of a changing global climate. Implementing early warning systems based on meteorological and air quality indicators could play a vital role in reducing cardiovascular health risks in the Azores and similar regions.