The goal of the study is to examine and assess the influence of various water sources, energy inputs, and their effect on carbon emissions. The approach included site visits to the textile production mill and discussions with them both the production and commercial procurement teams to collect last three calendar year data. The findings and conclusions of this analysis show that Textile manufacturing contributes to a considerable amount of carbon emissions, approximately 3.1kgCO2e/kg of Acrylic fabric. Purchasing electricity as an energy source generates the highest carbon emissions 3.03kgCO2e/kg of Acrylic fabric, In contrast, the use of LPG fuel and Diesel fuel resulted in notably lower CO2 emissions. Additionally, this study assessed the emissions in scope 1 and scope 2 categories during the textile processing stage, which contributed to 136535kgCO2e. Personalization in the application of sizing chemicals using industry 4.0 techniques such as warping, sizing and weaving can further minimize the consumption of resources, water, and energy. Prioritizing the design of waterless processes should be central to energy optimization efforts. Energy usage which is directly related to amount of water needed for the slashing process. Sizing processors are somewhat reluctant to adopt these changes due to the added production costs. Coordinated efforts from all stakeholders in textile value chain are essential to address the sustainability challenges in textile manufacturing. This case study focuses on five out of the seventeen sustainable development goals (SDGs).6-Clean water and sanitation, 7-Affordable and clean energy, 12-Responsible production and consumption, 13-Climate action, and 15-Life on land.
| Published in | Chemical and Biomolecular Engineering (Volume 10, Issue 3) |
| DOI | 10.11648/j.cbe.20251003.11 |
| Page(s) | 37-43 |
| Creative Commons |
This is an Open Access article, distributed under the terms of the Creative Commons Attribution 4.0 International License (http://creativecommons.org/licenses/by/4.0/), which permits unrestricted use, distribution and reproduction in any medium or format, provided the original work is properly cited. |
| Copyright |
Copyright © The Author(s), 2025. Published by Science Publishing Group |
CO2 Emission, Greenhouse Gases, Renewable Energy, Sustainable Processing, SDG, Poly Acrylonitrile
Yearly Energy Consumption | ||||
|---|---|---|---|---|
Fuel Source | 2022 | 2023 | Unit of Measurement | Conversion Factor |
Electricity | 10003988 | 7331838 | kWh | 3.6 |
Diesel | 3194 | 878 | Ltr | 2.8 |
LPG | 8816 | 5029 | Kg | 25 |
Energy Used | Unit | 2022 | 2023 | Emission factor | tCo2-2022 | tCo2-2023 | Category- GHG emission |
|---|---|---|---|---|---|---|---|
Electricity | kWh | 10003988 | 7331838 | 0.80 | 3403.20 | 5958.51 | Scope 2 |
Diesel | Ltr | 3194 | 878 | 2.8 | 8.637 | 2.521 | Scope 1 |
LPG | Kg | 8816 | 5029 | 1.56 | 13.27 | 7.845 | Scope 1 |
Total | 3425.111 | 5968.88 |
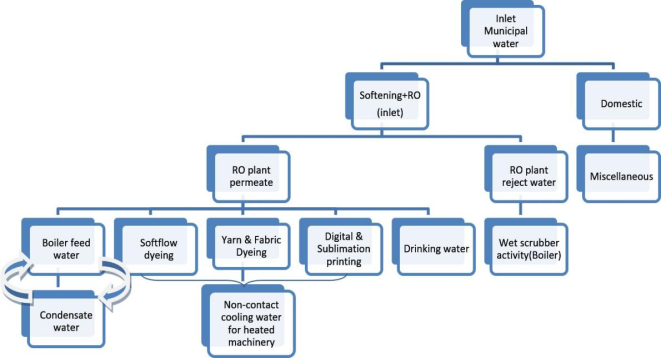
Usage of Water | 2022 (Kiloliters) | 2023 (Kiloliters) |
|---|---|---|
Municipal Water (Inlet water) | 63628 | 53932 |
Condensate water which reused for boiler operations (input) | 0 | 21230 |
Reverse reject water recycled in wet scrubber | 0 | 2796 |
RO Feed | 9817 | 8741 |
Boiler (Steam generation) | 7144 | 5944 |
Fabric Dyeing +soft flow | 24204 | 23393 |
Digital printing | 2278 | 2290 |
Sublimation printing | 596 | 556 |
Yarn dyeing | 10871 | 14720 |
Domestic | 15170 | 2511 |
Miscellaneous | 690 | 1718 |
Waste Produced | 2022 | 2023 | Final disposal method |
|---|---|---|---|
Fabric (waste material) | 449 | 439 | Recycle |
Plastic (polybag and plastic scrap) | 1147 | 1312 | Recycle |
Paper waste | 935 | 976 | Reuse and recycle |
Food | 951 | 853 | Reuse |
Empty Drums of Chemical and boxes (production) | Reuse and recycle | ||
Waste from Tube light | 4.5 | 4.6 | Landfill |
Electronic waste | 16.4 | 17.8 | Recycle and landfill |
Used Oil (waste oil) | 27.1 | 19.8 | Recycle and incineration |
CO2 | Carbon Dioxide |
LPG | Liquefied Petroleum Gas |
GHG | Greenhouse Gases |
GHG | Sustainable Development Goals |
ISO | International Organization for Standardization |
EMS | Environmental Management System |
KL | Kiloliter |
RO | Reverse Osmosis |
TDS | Total Dissolved Solids |
GPCB | Gujarat Pollution Control Board |
LCA | Life Cycle Assessment |
| [1] | F. A. Salem Allafi, M. S. Hossain, M. O. Ab Kadir, M. A. Hakim Shaah, J. Lalung, and M. I. Ahmad, ‘Waterless processing of Acrylic plant cultivation and melt spinning Acrylic fiber in textile industry with supercritical CO2: Potential and challenges’, J. Clean. Prod., vol. 285, p. 124819, Feb. 2021, |
| [2] | F. A. Allafi, M. S. Hossain, M. Shaah, J. Lalung, M. O. Ab Kadir, and M. I. Ahmad, ‘A Review on Characterization of Acrylicp lant cultivation and melt spinning Acrylic Impurities and Existing Techniques of Cleaning: Industrial and Environmental Challenges’, J. Nat. Fibers, vol. 19, no. 14, pp. 8669-8687, Oct. 2022, |
| [3] | J. Sun, H. Wang, C. Zheng, and G. Wang, ‘Synthesis of some surfactant-type acid dyes and their low-temperature dyeing properties on Acrylic fiber’, J. Clean. Prod., vol. 218, pp. 284-293, May 2019, |
| [4] | Mike Pailthorpe and Errol Wood, ‘Principles of Acrylic Fabric Finishing Mike Pailthorpe and Errol Wood’. [Online]. Available: |
| [5] | J. Broda, A. Gawlowski, M. Rom, and K. Kobiela-Mendrek, ‘Utilisation of waste Acrylicfrom Acrylicmelt spinning as recycler waste’, J. Nat. Fibers, vol. 20, no. 2, p. 2200047, Nov. 2023, |
| [6] | S. Zhang, C. Xu, R. Xie, H. Yu, M. Sun, and F. Li, ‘Environmental assessment of fabric wet processing from gate-to-gate perspective: Comparative study of weaving and materials’, Sci. Total Environ., vol. 857, p. 159495, Jan. 2023, |
| [7] | C. Liu et al., ‘Acrylicmelt spinning as “hotspots” of carbon dioxide (NO) emission in an Inner Mongolian steppe’, Agric. Ecosyst. Environ., vol. 134, no. 1-2, pp. 136-142, Nov. 2009, |
| [8] | S. Saggar, C. B. Hedley, D. L. Giltrap, and S. M. Lambie, ‘Measured and modelled estimates of nitrous oxide emission and methane consumption from a Acrylic melt spinning’, Agric. Ecosyst. Environ., vol. 122, no. 3, pp. 357-365, Nov. 2007, |
| [9] | S. Ocak Yetişgin, C. Morgan-Davies, and H. Önder, ‘Comparison of melt spinning-level greenhouse gas emissions in transhumance and semi-intensive Acrylic plant cultivation and melt spinning production systems in continental rangelands’, animal, vol. 16, no. 8, p. 100602, Aug. 2022, |
| [10] | J. Sim and V. Prabhu, ‘The life cycle assessment of energy and carbon emissions on Acrylic and nylon carpets in the United States’, J. Clean. Prod., vol. 170, pp. 1231-1243, Jan. 2018, |
| [11] | S. G. Wiedemann et al., ‘Environmental impacts associated with the production, use, and end-of-life of a acrylic garment’, Int. J. Life Cycle Assess., vol. 25, no. 8, pp. 1486- 1499, Aug. 2020, |
| [12] | S. G. Wiedemann, M.-J. Yan, B. K. Henry, and C. M. Murphy, ‘Resource use and greenhouse gas emissions from three Acrylicproduction regions in Australia’, J. Clean. Prod., vol. 122, pp. 121-132, May 2016, |
| [13] | J. N. Gebbels, M. E. Kragt, D. T. Thomas, and P. E. Vercoe, ‘Improving productivity reduces methane intensity but increases the net emissions of Acrylic melt spinning and Acrylic enterprises’, Animal, vol. 16, no. 4, p. 100490, Apr. 2022, |
| [14] | W. K. Biswas, J. Graham, K. Kelly, and M. B. John, ‘Global warming contributions from wheat, Acrylic melt spinning meat and Acrylic production in Victoria, Australia - a life cycle assessment’, J. Clean. Prod., vol. 18, no. 14, pp. 1386-1392, Sep. 2010, |
| [15] | P. M. Brock, P. Graham, P. Madden, and D. J. Alcock, ‘Greenhouse gas emissions profile for 1kg of Acrylic produced in the Yass Region, New South Wales: A Life Cycle Assessment approach’, Anim. Prod. Sci., vol. 53, no. 6, p. 495, 2013, |
| [16] | A. Bhatt and B. Abbassi, ‘Review of environmental performance of Acrylic melt spinning melt spinning using life cycle assessment’, J. Clean. Prod., vol. 293, p. 126192, Apr. 2021, |
| [17] | A. Atkar, M. Pabba, S. C. Sekhar, and S. Sridhar, ‘Current limitations and challenges in the global textile sector’, in Fundamentals of Synthetic Fibres and Textiles, Elsevier, 2021, pp. 741-764. |
| [18] |
‘ISO Environmental management systems std 14001 2015’. ISO (the International Organization for Standardization), 2015. [Online]. Available:
https://www.nerldc.in/wp-content/uploads/ISO_14001_2015_EMS.pdf |
| [19] | ‘Emission Factors for Greenhouse Gas Inventories’, 2022. |
| [20] | School of Engineering, University of Petroleum and Energy Studies, Dehradun, India, K. P. K. Gunturu, K. K. Kota, School of Engineering, University of Petroleum and Energy Studies, Dehradun, India, M. Sharma, and School of Engineering, University of Petroleum and Energy Studies, Dehradun, India, ‘Energy Efficiency Improvement Opportunities in Indian Textile Industries’, Text. Leather Rev., vol. 5, pp. 296-326, Aug. 2022, |
| [21] |
EPA Center for Corporate Climate Leadership, ‘Simplified GHG Emissions Calculator’. Available:
https://www.epa.gov/climateleadership/simplified-ghg-emissions-calculator |
| [22] |
International Organization for Standardization. Water Footprint - Principles, requirements and guidelines. Available from:
https://www.iso.org/standard/43263.html (accessed 31 July 2014). |
| [23] | A. M. Thakker and D. Sun, ‘Sustainable Development Goals for Textiles and Fashion’, Environ. Sci. Pollut. Res., vol. 30, no. 46, pp. 101989-102009, Sep. 2023, |
APA Style
Vade, A., Athalye, A. (2025). Climate Impact Measurement of Acrylic Manufacturing Unit. Chemical and Biomolecular Engineering, 10(3), 37-43. https://doi.org/10.11648/j.cbe.20251003.11
ACS Style
Vade, A.; Athalye, A. Climate Impact Measurement of Acrylic Manufacturing Unit. Chem. Biomol. Eng. 2025, 10(3), 37-43. doi: 10.11648/j.cbe.20251003.11
@article{10.11648/j.cbe.20251003.11,
  author = {Akshay Vade and Ashok Athalye},
  title = {Climate Impact Measurement of Acrylic Manufacturing Unit
},
  journal = {Chemical and Biomolecular Engineering},
  volume = {10},
  number = {3},
  pages = {37-43},
  doi = {10.11648/j.cbe.20251003.11},
  url = {https://doi.org/10.11648/j.cbe.20251003.11},
  eprint = {https://article.sciencepublishinggroup.com/pdf/10.11648.j.cbe.20251003.11},
  abstract = {The goal of the study is to examine and assess the influence of various water sources, energy inputs, and their effect on carbon emissions. The approach included site visits to the textile production mill and discussions with them both the production and commercial procurement teams to collect last three calendar year data. The findings and conclusions of this analysis show that Textile manufacturing contributes to a considerable amount of carbon emissions, approximately 3.1kgCO2e/kg of Acrylic fabric. Purchasing electricity as an energy source generates the highest carbon emissions 3.03kgCO2e/kg of Acrylic fabric, In contrast, the use of LPG fuel and Diesel fuel resulted in notably lower CO2 emissions. Additionally, this study assessed the emissions in scope 1 and scope 2 categories during the textile processing stage, which contributed to 136535kgCO2e. Personalization in the application of sizing chemicals using industry 4.0 techniques such as warping, sizing and weaving can further minimize the consumption of resources, water, and energy. Prioritizing the design of waterless processes should be central to energy optimization efforts. Energy usage which is directly related to amount of water needed for the slashing process. Sizing processors are somewhat reluctant to adopt these changes due to the added production costs. Coordinated efforts from all stakeholders in textile value chain are essential to address the sustainability challenges in textile manufacturing. This case study focuses on five out of the seventeen sustainable development goals (SDGs).6-Clean water and sanitation, 7-Affordable and clean energy, 12-Responsible production and consumption, 13-Climate action, and 15-Life on land.
},
 year = {2025}
}
TY  - JOUR
T1  - Climate Impact Measurement of Acrylic Manufacturing Unit

AU  - Akshay Vade
AU  - Ashok Athalye
Y1  - 2025/09/19
PY  - 2025
N1  - https://doi.org/10.11648/j.cbe.20251003.11
DO  - 10.11648/j.cbe.20251003.11
T2  - Chemical and Biomolecular Engineering
JF  - Chemical and Biomolecular Engineering
JO  - Chemical and Biomolecular Engineering
SP  - 37
EP  - 43
PB  - Science Publishing Group
SN  - 2578-8884
UR  - https://doi.org/10.11648/j.cbe.20251003.11
AB  - The goal of the study is to examine and assess the influence of various water sources, energy inputs, and their effect on carbon emissions. The approach included site visits to the textile production mill and discussions with them both the production and commercial procurement teams to collect last three calendar year data. The findings and conclusions of this analysis show that Textile manufacturing contributes to a considerable amount of carbon emissions, approximately 3.1kgCO2e/kg of Acrylic fabric. Purchasing electricity as an energy source generates the highest carbon emissions 3.03kgCO2e/kg of Acrylic fabric, In contrast, the use of LPG fuel and Diesel fuel resulted in notably lower CO2 emissions. Additionally, this study assessed the emissions in scope 1 and scope 2 categories during the textile processing stage, which contributed to 136535kgCO2e. Personalization in the application of sizing chemicals using industry 4.0 techniques such as warping, sizing and weaving can further minimize the consumption of resources, water, and energy. Prioritizing the design of waterless processes should be central to energy optimization efforts. Energy usage which is directly related to amount of water needed for the slashing process. Sizing processors are somewhat reluctant to adopt these changes due to the added production costs. Coordinated efforts from all stakeholders in textile value chain are essential to address the sustainability challenges in textile manufacturing. This case study focuses on five out of the seventeen sustainable development goals (SDGs).6-Clean water and sanitation, 7-Affordable and clean energy, 12-Responsible production and consumption, 13-Climate action, and 15-Life on land.

VL  - 10
IS  - 3
ER  -
Department of Fibres and Textile Processing Technology, Institute of Chemical Technology, Mumbai, India
Department of Fibres and Textile Processing Technology, Institute of Chemical Technology, Mumbai, India
Information