This article describes a solution for optimization of railway track’s preventive maintenance scheduling. Solution is based on predicting spontaneous increases of maximum defect sizes occurring between two consecutive track measurements. Predictions are made immediately after the latest measurement. The planning of preventive maintenance works is based on periodic measurements of geometric parameters’ values. Changes in the track condition manifest as an increase in the size of "large" defects and a decrease in "small" ones through superposition, and sometimes as an abrupt change in the maximum defect size. The process properties depend on the track's physical condition and the magnitude of train load. This process is associated both with changes in the size of existing defects and with the formation of new ones that exceed the existing ones in size. The abrupt appearance of defects exceeding the current maximum values, occurring at random times between measurements, significantly impacts the track's technical condition and must be considered when planning track maintenance works. Thus, optimizing preventive maintenance work requires obtaining information about the track condition in future immediately after each measurement. The problem of predicting the appearance of defects whose sizes exceed those recorded in the latest measurement has not been studied. Analysis has shown that this phenomenon occurs to varying degrees in 5-10% of track segments, when subsequent measurements register the appearance of new, larger defects that arose in the period between measurements. Information about the possible appearance of such defects allows optimization of the track maintenance process. The method for predicting changes in the track's technical condition described in this article allows, with high reliability, immediately after the latest measurement to predict the appearance, during interval before the next regular measurement, of defects whose sizes exceed the maximum recorded in the latest measurement. The method also allows identifying sudden spontaneous deterioration of the track. The method is based on analyzing the homogeneity (compactness) property of the values of the ISDF. This function shows the cumulative length of each-size track irregularity within a track segment. For classifying results and making decisions, the "nearest neighbor method" is used. The method has been tested for predicting track condition for future periods of 1, 2 and 3 months after the latest measurement. For surface defects, the probability of correctly predicting a spontaneous increase in maximum defect size is within 0.91-0.98 range, and the probability of false positives is between 0.03-0.09.
| Published in | American Journal of Traffic and Transportation Engineering (Volume 11, Issue 2) |
| DOI | 10.11648/j.ajtte.20261102.11 |
| Page(s) | 24-32 |
| Creative Commons |
This is an Open Access article, distributed under the terms of the Creative Commons Attribution 4.0 International License (http://creativecommons.org/licenses/by/4.0/), which permits unrestricted use, distribution and reproduction in any medium or format, provided the original work is properly cited. |
| Copyright |
Copyright © The Author(s), 2026. Published by Science Publishing Group |
Rail Track, Degradation, Track Condition Prediction
IRREGULARITY SIZE (mm) | 1 | 2 | 3 | 4 | 5 | 6 | 7 | 8 | 9 | 10 |
|---|---|---|---|---|---|---|---|---|---|---|
ISDF ACTUAL (m) | m1 | m2 | m3 | m4 | m5 | m6 | m7 | m8 | m9 | 0 |
ISDF CONTROL BASE (m) | n1 | n2 | n3 | n4 | n5 | n6 | n7 | n8 | n9 | |
MAX PREDICT SIZE VALUE (mm) | PRED MAX |
Defect size (mm) | -11 | -10 | -9 | -8 | -7 | -6 | -5 | -4 | -3 | -2 | -1 | 0 |
|---|---|---|---|---|---|---|---|---|---|---|---|---|
ISDF (mes.1-m) | 0,25 | 0,5 | 1,25 | 0,75 | 1,5 | 0,5 | 2,5 | 2,25 | 1,5 | 2,75 | 6,75 | 21 |
ISDF (mes.2-m) | 0,5 | 0,25 | 1,25 | 0,75 | 1,25 | 1,5 | 3,25 | 2,25 | 2 | 2,75 | 9 | 19,5 |
IRREGULARITY SIZE (m) | 0 | 1 | 2 | 3 | 4 | 5 | 6 | 7 | 8 | 9 |
|---|---|---|---|---|---|---|---|---|---|---|
ISDF(m) MES1 | 22.25 | 6 | 3.25 | 4 | 1.75 | 1.75 | 2.5 | 2.25 | 0.25 | 0.25 |
ISDF(m) MES2 | 21.25 | 5.75 | 3 | 5.25 | 2.5 | 1.75 | 2.25 | 1.25 | 1.25 | 0.25 |
ISDF(m) MES3 | 21.5 | 7.25 | 3 | 3.5 | 3 | 2 | 2.175 | 2.25 | 1.25 | 0 |
ISDF(m) MES4 | 17.75 | 7.5 | 3 | 2.25 | 3 | 2.75 | 3 | 1.75 | 0.25 | 0.5 |
ISDF(m) MES5 | 19 | 7.5 | 3.25 | 4.5 | 1.75 | 2.25 | 1.5 | 1.75 | 1.75 | 0.25 |
Prediction interval 1 month | ||||
NEAREST NEIGHBORS NUMBER | 1 | 2 | 3 | 4 |
PROBABILITY OF CORRECTLY DETECTING | 0.91 | 0.92 | 0.95 | 0.94 |
PROBABILITY OF FALSE POSITIVES | 0.09 | 0.08 | 0.04 | 0.06 |
Prediction interval 2 months | ||||
NEAREST NEIGHBORS NUMBER | 1 | 2 | 3 | 4 |
PROBABILITY OF CORRECTLY DETECTING | 0.95 | 0.99 | 0.88 | 0.87 |
PROBABILITY OF FALSE POSITIVES | 0.08 | 0.03 | 0.08 | 0.1 |
Prediction interval 3 months | ||||
NEAREST NEIGHBORS NUMBER | 1 | 2 | 3 | 4 |
PROBABILITY OF CORRECTLY DETECTING | 0.91 | 0.86 | 0.86 | 0.84 |
PROBABILITY OF FALSE POSITIVES | 0.09 | 0.136 | 0.136 | 0.159 |
ISDFF | Irregularity Size Distribution Function |
| [1] | Najafabadi et al. Degradation prediction of rail tracks: a review of the existing literature. The Open Transportation Journal, 2018, 12, 88-104. |
| [2] | I. Soleimanmeigouni et al. Prediction of railway track geometry defects: A case study. Structure and Infrastructure Engineering. Volume 16, 2020, Issue 7. |
| [3] | R. Dekker et al. (Erasmus University Rotterdam), Predicting rail geometry deterioration by regression models – (advances in safety, reliability and risk management - Berenguer, Clarr & Guedes Soares, London). |
| [4] | C. Vale, M. Lurdes Simoes Prediction of Railway Track Condition for Preventive Maintenance by Using a Data -Driven Approach, Infrastructures 2022, 7(3), 34: |
| [5] | Vale, C.; Simoes, M. L. Stochastic model for the geometrical rail deterioration process. Reliab. Eng. Syst. Saf. 2013, 116, 91-98. |
| [6] | Bressi, S.; Santos. J.; Losa, M. Optimization of maintenance strategies for railway track-bad considering probabillistic degradation models and different reliability levels. Reliab. Eng. Syst. Saf. 2021, 207. 107359. |
| [7] | G. Krug, Adaptive Multipoint Method for Predicting Geometric Parameters on the Railway Track based on Convergence Theory. American Journal of Mechanical and Industrial Engineering, vol 7, N1, 2022. |
| [8] | Y. Sato, Convergence Theory Including Spot Tamping, Conference on Railway Engineering, pp. 507-511, Australia, 1998. |
| [9] | B. Lichtberger, Track Compendium, Eurail press, 2022. |
| [10] | Ciobanu, C.: Use of inherent standard deviations as track design parameters. The Journal of the Permanent Way Institution, October 2018, vol. 136, part 4. |
| [11] | G. Krug, J. Madejski, Track Quality Assessment Problems. ZEVrail 142 (2018) 6-7 June-July, pp. 2-8. |
| [12] | G. Krug, Analysis of Track Condition based on application of the Irregularity Length Cumulative Distribution Function. Lecture Notes in Civil Engineering, volume 49, Springer, 2020. |
| [13] | B. Everitt, The Cambridge Dictionary of Statistics, Cambridge University Press, 1988. |
| [14] | R. Nisbet et al. Handbook of Statistical Analysis and Data Mining Applications, Academic Press Inc. 2009. |
| [15] | G. Krug, Predicting Spontaneous Increases in Maximum Size of Geometric Defects In Railway Tracks. American Journal of Mechanical and Industrial Engineering - volume 10, Issue 2, 2025. |
APA Style
Krug, G. (2026). Optimization of Railway Track’s Preventive Maintenance Planning Based on Predicting the Increase in Maximum Defect Sizes (Vigral Method). American Journal of Traffic and Transportation Engineering, 11(2), 24-32. https://doi.org/10.11648/j.ajtte.20261102.11
ACS Style
Krug, G. Optimization of Railway Track’s Preventive Maintenance Planning Based on Predicting the Increase in Maximum Defect Sizes (Vigral Method). Am. J. Traffic Transp. Eng. 2026, 11(2), 24-32. doi: 10.11648/j.ajtte.20261102.11
@article{10.11648/j.ajtte.20261102.11,
  author = {Gregory Krug},
  title = {Optimization of Railway Track’s Preventive Maintenance Planning Based on Predicting the Increase in Maximum Defect Sizes (Vigral Method)},
  journal = {American Journal of Traffic and Transportation Engineering},
  volume = {11},
  number = {2},
  pages = {24-32},
  doi = {10.11648/j.ajtte.20261102.11},
  url = {https://doi.org/10.11648/j.ajtte.20261102.11},
  eprint = {https://article.sciencepublishinggroup.com/pdf/10.11648.j.ajtte.20261102.11},
  abstract = {This article describes a solution for optimization of railway track’s preventive maintenance scheduling. Solution is based on predicting spontaneous increases of maximum defect sizes occurring between two consecutive track measurements. Predictions are made immediately after the latest measurement. The planning of preventive maintenance works is based on periodic measurements of geometric parameters’ values. Changes in the track condition manifest as an increase in the size of "large" defects and a decrease in "small" ones through superposition, and sometimes as an abrupt change in the maximum defect size. The process properties depend on the track's physical condition and the magnitude of train load. This process is associated both with changes in the size of existing defects and with the formation of new ones that exceed the existing ones in size. The abrupt appearance of defects exceeding the current maximum values, occurring at random times between measurements, significantly impacts the track's technical condition and must be considered when planning track maintenance works. Thus, optimizing preventive maintenance work requires obtaining information about the track condition in future immediately after each measurement. The problem of predicting the appearance of defects whose sizes exceed those recorded in the latest measurement has not been studied. Analysis has shown that this phenomenon occurs to varying degrees in 5-10% of track segments, when subsequent measurements register the appearance of new, larger defects that arose in the period between measurements. Information about the possible appearance of such defects allows optimization of the track maintenance process. The method for predicting changes in the track's technical condition described in this article allows, with high reliability, immediately after the latest measurement to predict the appearance, during interval before the next regular measurement, of defects whose sizes exceed the maximum recorded in the latest measurement. The method also allows identifying sudden spontaneous deterioration of the track. The method is based on analyzing the homogeneity (compactness) property of the values of the ISDF. This function shows the cumulative length of each-size track irregularity within a track segment. For classifying results and making decisions, the "nearest neighbor method" is used. The method has been tested for predicting track condition for future periods of 1, 2 and 3 months after the latest measurement. For surface defects, the probability of correctly predicting a spontaneous increase in maximum defect size is within 0.91-0.98 range, and the probability of false positives is between 0.03-0.09.},
 year = {2026}
}
TY  - JOUR
T1  - Optimization of Railway Track’s Preventive Maintenance Planning Based on Predicting the Increase in Maximum Defect Sizes (Vigral Method)
AU  - Gregory Krug
Y1  - 2026/05/19
PY  - 2026
N1  - https://doi.org/10.11648/j.ajtte.20261102.11
DO  - 10.11648/j.ajtte.20261102.11
T2  - American Journal of Traffic and Transportation Engineering
JF  - American Journal of Traffic and Transportation Engineering
JO  - American Journal of Traffic and Transportation Engineering
SP  - 24
EP  - 32
PB  - Science Publishing Group
SN  - 2578-8604
UR  - https://doi.org/10.11648/j.ajtte.20261102.11
AB  - This article describes a solution for optimization of railway track’s preventive maintenance scheduling. Solution is based on predicting spontaneous increases of maximum defect sizes occurring between two consecutive track measurements. Predictions are made immediately after the latest measurement. The planning of preventive maintenance works is based on periodic measurements of geometric parameters’ values. Changes in the track condition manifest as an increase in the size of "large" defects and a decrease in "small" ones through superposition, and sometimes as an abrupt change in the maximum defect size. The process properties depend on the track's physical condition and the magnitude of train load. This process is associated both with changes in the size of existing defects and with the formation of new ones that exceed the existing ones in size. The abrupt appearance of defects exceeding the current maximum values, occurring at random times between measurements, significantly impacts the track's technical condition and must be considered when planning track maintenance works. Thus, optimizing preventive maintenance work requires obtaining information about the track condition in future immediately after each measurement. The problem of predicting the appearance of defects whose sizes exceed those recorded in the latest measurement has not been studied. Analysis has shown that this phenomenon occurs to varying degrees in 5-10% of track segments, when subsequent measurements register the appearance of new, larger defects that arose in the period between measurements. Information about the possible appearance of such defects allows optimization of the track maintenance process. The method for predicting changes in the track's technical condition described in this article allows, with high reliability, immediately after the latest measurement to predict the appearance, during interval before the next regular measurement, of defects whose sizes exceed the maximum recorded in the latest measurement. The method also allows identifying sudden spontaneous deterioration of the track. The method is based on analyzing the homogeneity (compactness) property of the values of the ISDF. This function shows the cumulative length of each-size track irregularity within a track segment. For classifying results and making decisions, the "nearest neighbor method" is used. The method has been tested for predicting track condition for future periods of 1, 2 and 3 months after the latest measurement. For surface defects, the probability of correctly predicting a spontaneous increase in maximum defect size is within 0.91-0.98 range, and the probability of false positives is between 0.03-0.09.
VL  - 11
IS  - 2
ER  -
Dr.’s Krug Consulting Service, Tel-Aviv, Israel
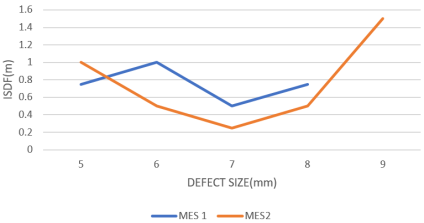
Figure 1. Sudden change of maximum defect size.
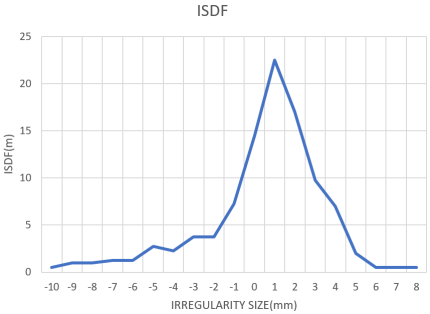
Figure 2. Irregularity size distribution function.
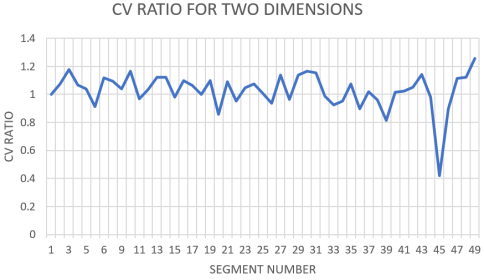
Figure 3. Coefficient of variation.
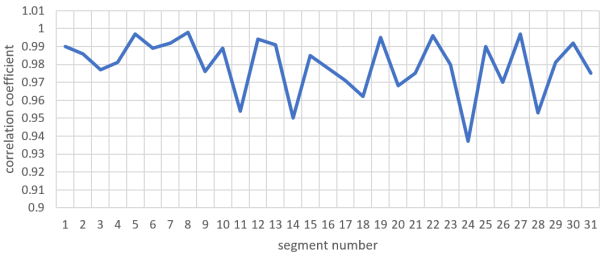
Figure 4. Correlation coefficient.
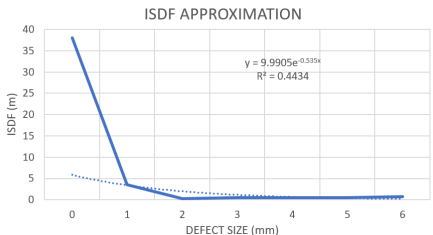
Figure 5. Example of ISDF function approximation.
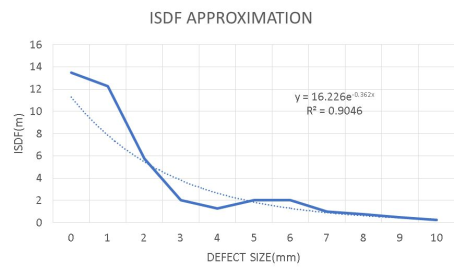
Figure 6. Example of ISDF function approximation.
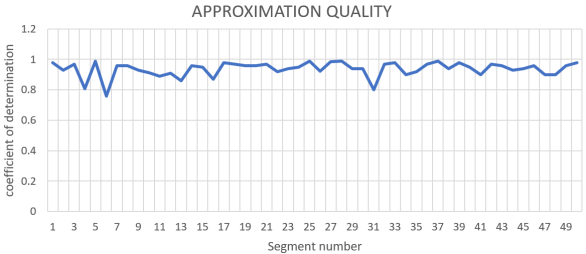
Figure 7. Distribution of R² values.
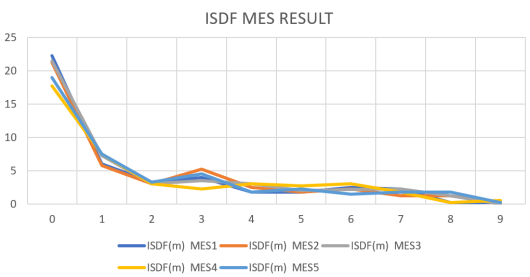
Figure 8. Measurement results of ISDF (km xx, 300-400m).
Information

