Review Article | | Peer-Reviewed

A Review on Corrosion Mitigation Strategies for Reinforced Concrete Structures Exposed to Climate Events

Received: 14 July 2026     Accepted: 23 July 2026     Published: 17 August 2026
Views:       Downloads:
Abstract

The propagation of deterioration in vital reinforced concrete (RC) structures is a critical issue for infrastructure subjected to extreme climate change. Billions of US dollars were spent annually on the rehabilitation of RC structures. Accurate projections of future climate data for each city worldwide must consider their influence on RC members. This research will present a review of some existing RC structures exposed to CO2 and chloride-induced corrosion. Moreover, this research will discuss methods for investigating the projection of extreme climate events, providing a framework for projecting future climate data. The limit state functions for carbonation and chloride-induced corrosion are provided for various concrete sections and crack widths to predict the reliability index for assessing structural safety. This study will discuss sustainable materials and corrosion mitigation strategies to inhibit chloride- and carbonation-induced corrosion. It was deduced that a geopolymer concrete (GPC) material composed of 40% fly ash (FA) and 60% slag (SG) shows good resistance to chloride-induced corrosion compared to an ordinary Portland cement concrete mix and a GPC mix composed of 50% FA and 50% SG. Furthermore, GPC, which consists of 40% FA and 60% SG, will increase the service life of the RC structure compared to a mix composed of 50% FA and 50% SG. Finally, a crack width limitation for RC structures located in different climate regions must be assessed in various codes to adapt them to the future projection of extreme climates to reduce the risks to RC structures.

Published in American Journal of Science, Engineering and Technology (Volume 11, Issue 3)
DOI 10.11648/j.ajset.20261103.14
Page(s) 130-148
Creative Commons

This is an Open Access article, distributed under the terms of the Creative Commons Attribution 4.0 International License (http://creativecommons.org/licenses/by/4.0/), which permits unrestricted use, distribution and reproduction in any medium or format, provided the original work is properly cited.

Copyright

Copyright © The Author(s), 2026. Published by Science Publishing Group

Keywords

Sustainable Materials, Geopolymer Concrete, Deterioration of RC Structures, Crack Width Limitation

1. Introduction
The corrosion of carbon steel rebars embedded in concrete members is controlled by the action of the cover depth, which acts as an obstacle against the penetration of chloride ions, CO2, water, and oxygen required for the corrosion initiation stage. The corrosion of the steel rebars occurs when the chloride concentration at the rebars' level exceeds the chloride threshold. Moreover, the corrosion of steel rebar in concrete is an electrochemical process in which chemical reactions occur simultaneously at two regions on the steel surface . The potential difference can be generated by three different methods as follows: (i) potential difference; (ii) difference in the concentration of ions in the pore solution; and (iii) contact of dissimilar metals. With sufficient oxygen at the anodic sites, ferrous hydroxide can be further oxidized into different corrosion products with volumes larger than the original volume, up to six times. An increase in the volume of steel rebar can generate stresses due to tension force in the surrounding concrete interface, which leads to cracking, spalling, and delamination of the concrete cover depth.
Corrosion in concrete structures is described as a two-stage process according to Tuutti . The corrosion of the steel rebars is assumed to occur when the chloride concentration at the steel rebar level reaches the chloride threshold (Cth) . The time at which corrosion initiates is used as a quantitative indicator of the service life of reinforced concrete (RC) structures. Various factors influence the duration of each stage, including environmental conditions, concrete properties, exposure time, and chloride diffusion rates . Ideally, corrosion initiates at time (Ti) when the chloride concentration at the steel surface equals or exceeds the chloride threshold (Cth), as calculated using equation (1). Furthermore, the impact of environmental factors on the time of corrosion initiation due to chlorides is shown in equation (2).
Ti=x24 Derf-1×1-CthCs2(1)
Ti=x24 ×D×f1(T)×f2te×f3(RH)×erf-1×1-CthCs2(2)
Ti=x24×D×f1(T)×f2te×f3(RH)×erf-1×1-CthCs2
The cracks generated at the concrete cover for the RC member are caused by the occurrence of steel rebar corrosion when the expansion force exceeds the tensile strength (ft) of the concrete material, according to Andrade and Alonso . The corroded expansion force due to cover cracking is related to the reinforcement's corrosion depth. It is known that the rebar's corrosion depth is proportional to the corrosion current density according to Faraday's law. Additionally, the greater the corrosion current density reaches the steel rebars, the deeper the corrosion depth of the steel rebars will be . Therefore, the cover cracks when the steel rebar's corrosion depth reaches the critical corrosion depth of the concrete cover.
The durability and resilience of RC structures, especially bridge decks, girders, and columns, are fundamental to the integrity of transportation infrastructure. RC bridge structures are increasingly threatened by environmental degradation, particularly chloride- and carbonation-induced corrosion. Nowadays, climate change events intensify these threats, as rising maximum temperatures and increased CO2 concentrations accelerate degradation processes, posing long-term risks to infrastructure safety. A recent analysis of the Canadian Infrastructure Report Card found that nearly 40% of bridges are in poor to fair condition, underscoring the pressing need for maintenance and rehabilitation. Most Highway Bridge Design Codes worldwide specify design parameters based on climatic data. These parameters are very important for designing bridges that can withstand the impacts of harsh weather conditions. Climate conditions such as fluctuating maximum/ minimum temperatures, heavy precipitation, and severe winds degrade the durability of RC structures, increasing the possibility of failure .
The change in extreme weather events, such as maximum temperature, relative humidity levels, and freeze-thaw cycles, is already challenging; climate change exacerbates these conditions. Projections for increased maximum temperatures in regions around the world suggest that RC structures will face even greater stresses, with significant implications for the lifespan and integrity of these materials. The projections of climate data emphasize the urgent need for climate-adaptive strategies to protect RC structures from accelerated degradation. The future impact of climate change on infrastructure is largely driven by different emission scenarios of various gases. These are critical inputs for global climate models (GCMs). Carbon dioxide (CO2), a major greenhouse gas, is the most well-known contributor to global warming all over the world. The Intergovernmental Panel on Climate Change (IPCC) (AR5, 2014) identified several representative concentration pathways (RCPs) that illustrate possible climate futures based on different emission scenarios. In the worst emission scenario, RCP8.5, CO2 concentrations are projected to exceed 900 ppm, with a global temperature increase within a specific range by the year 2100 . Each RCP is characterized by radiative forcing (RF) . These scenarios offer insights into the potential influences of human activities on the planet’s climate system and the consequent effects on infrastructure. The sixth assessment report uses shared socio-economic pathways that represent a wide range of scenarios, which focus on lower degrees of global warming.
The problem statement is that increased CO2 and extreme temperature levels could significantly compromise the durability of RC structures by accelerating the penetration process for either CO2 or chloride ions. In Canada, infrastructure deterioration is driven by extreme weather events and inadequate maintenance. According to Statistics Canada in 2023, the total cost of replacing road and water infrastructure in poor or very poor condition is estimated to exceed $350 billion. In a broader scope, the total replacement cost of all public infrastructure in Canada, excluding housing, was estimated at around $2.1 trillion in 2020 . Approximately $264.7 billion is necessary to replace assets in a very poor condition, representing a significant portion of Canada's infrastructure needs . Extreme weather events have caused substantial damage to bridges, culverts, and other main structures, particularly in different provinces of Canada. The impact of climate change on infrastructure accelerates deterioration, increases rehabilitation costs, and reduces serviceability. If researchers and civil engineers do not update the specific code to account for future climate change projections, particularly for vital RC members in various structures, the long-term viability of infrastructure will be compromised. The reliability-based maintenance management for any vital RC structures includes the following: condition assessment models, optimization models, probabilistic deterioration models, and probabilistic risk models.
Various methods for the calculation of the reliability index and their corresponding probability of corrosion were used by different researchers as follows: the Monte Carlo Simulation Method, First Order Reliability Method, Second Order Reliability Method, and Hasofer-Lind method . Probabilistic models, whether for carbonation or chloride-causing corrosion, are important steps to quantify the uncertainties involved in projecting the deterioration and managing maintenance. Reliable service life models are essential for designing resilient structures by helping engineers select appropriate materials that ensure the service life of the vital RC structures is met.
This study offers a review of the evaluation framework for different existing research studies. Moreover, this study aims to compare the effect of various supplementary cementitious materials (SCMs) with different percentages in the concrete mix on the chloride-induced corrosion initiation stage. Furthermore, choosing the optimum percentages of precursor materials such as fly ash and slag pozzolanic material as sustainable and eco-friendly materials to produce geopolymer concrete mixes to inhibit chloride-induced corrosion initiation compared to the OPC concrete mix, which is characterized by a high CO2 emission scenario. A comparison of crack width limits at different country codes will be provided based on the climatic region and service life of RC structures in various countries to observe the difference between codes. Therefore, future studies will assess the effect of crack width limits on corrosion due to climate change. Finally, general corrosion mitigation strategies will be presented in detail.
Significant increases in CO2 emissions, increases in maximum temperatures, and the utilization of deicing salts have been identified as the main contributors to accelerated deterioration through carbonation/chloride-induced corrosion. The other main aim of this research is to show the latest updates related to carbonation/chloride-induced corrosion mitigation studies for various RC sections, having different types and percentages of supplementary cementitious materials (SCMs), and the interplay between maximum temperature, relative humidity, and the emission scenarios for the CO2 concentrations for mitigating carbonation/chloride-induced corrosion. Moreover, different mitigation strategies such as SCMs, geopolymer concrete, corrosion inhibitors, galvanized and stainless-steel reinforcement, water-to-cement ratio, concrete cover, and crack width limitations would be discussed in sequence to mitigate the corrosion effects on structures made of RC. Therefore, there is an urgent requirement for a comprehensive climate-sensitive approach to assess the durability of RC structures, ensuring their resilience against the severe threat of environmental events, and the crack widths for RC structures in different countries all over the world. This work will help ensure that future infrastructure can withstand the evolving challenges posed by climate change, thereby reducing maintenance costs .
1.1. Corrosion Mechanisms in RC Structures
1.1.1. Chloride-Induced Corrosion
Corrosion of steel rebars due to the chloride effect in RC members is the main cause of the deterioration process for infrastructure in different countries all over the world. Vital RC structures exposed to de-icing salts are particularly vulnerable, with the damage manifesting as cracking and spalling of the concrete cover. Chloride ingress leads to rebar corrosion, which, in turn, weakens the structural integrity of bridges . It was observed that the annual charges of rebar corrosion due to chlorides in US highway bridges are approximately $8.3 billion. In Canada, the economic impact of corrosion on RC infrastructure is also significant due to corrosion- related deterioration. The use of SCMs in concrete mixes has shown promise in reducing chloride penetration, thereby enhancing durability.
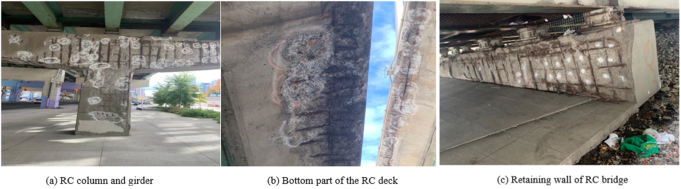
A clear example of corrosion-induced damage by the naked eye is the highway bridge in Ontario province in Canada, which is made of RC members that experience extensive deterioration due to the application of chloride deicers during winter and extreme temperatures in summer. The elevated RC bridge is 18 km long and is composed of more than 500 slabs on a girder. This vital RC bridge handles over 140,000 vehicles per day. It was noticed that the RC decks, girders, columns, and retaining walls exhibit significant corrosion damage, as shown in Figure 1.
Figure 1. Corrosion of steel rebars in different members of the highway RC bridge in Canada.
Several studies showed that the presence of flaws, mainly in the cracked concrete sections, significantly increases the amount of chloride and CO2 ions to attack the microstructure of concrete pores and the corrosion risk dramatically compared to uncracked concrete sections, according to Park et al. , Yu and Jin , and Hassan and Amleh .
1.1.2. Carbonation Process for Hardened Concrete
Carbonation of hardened concrete occurs when atmospheric CO2 reaches concrete pores, lowering the pH and thus reducing the alkaline protection layer surrounding embedded steel . Carbonation-induced corrosion is affected by environmental factors and the properties of the concrete mix. Jiang et al. identified internal factors, such as the concrete’s cement composition, the amount of water and cement in the concrete mix, and the degree of hydration . With increasing CO2 levels, RC structures in urban environments face a significant risk. Consequently, concrete quality and other parameters are critical issues in resisting carbonation.
1.2. Methods of Measuring Chloride/CO2 Ions Inside RC Structures
Various methods were used for measuring chloride ions in concrete, including destructive testing (core sampling, powder drilling, etc.) to determine water-soluble content in concrete microstructure according to ASTM C1152, C1218, AASHTO T 260, and non-destructive methods such as electrochemical sensors, GPR, and X-ray fluorescence for in-situ, rapid assessment. Moreover, the methods for determining carbonation-induced corrosion in concrete include measuring carbonation depth using a 1% phenolphthalein indicator spray on freshly exposed surfaces (colorless; pH < 9) and assessing rebars' corrosion using Half-cell potential measurements, electrochemical impedance spectroscopy, linear polarization resistance, and gravimetric mass loss, as shown in Table 1. The factors affecting measurements are humidity; higher internal humidity can reduce the carbonation rate. In addition, the time of species exposure is a main factor, so carbonation depth increases with the time of exposure. Furthermore, sheltered and unsheltered concrete exhibit different rates of carbonation. Finally, the amount of cement, water, cement type and content, SCMs, concrete curing, cracks and microcracks, wet/dry cycles, temperature, and chloride binding capacity are the main influences that affect the method of measurement for either chloride or CO2 ions penetration inside concrete microstructure .
Table 1. Methods for measuring Chloride and CO2 ions in concrete microstructure.

Chloride (CL-) Ions

CO2 Ions

Destructive Testing Methods:

1) Acid-Soluble (Total) Chloride (ASTM C1152/AASHTO T 260): Measures all chloride ions, including those bound in the cement paste.

2) Water-Soluble Chloride (ASTM C1218/AASHTO T 260): Measures only free chloride ions, which are primarily responsible for steel rebars' corrosion.

3) Titration Method: A common, highly accurate laboratory method (potentiometric or silver nitrate) to determine the precise chloride concentration.

4) X-Ray Fluorescence: It is used for high-precision, detailed imaging of chloride profiles and concentration levels.

Non-Destructive/In-Situ Testing Methods:

These methods allow for rapid, field-based assessment without damaging the structure.

1) Electrochemical Sensors: Use ion-selective electrodes or embedded sensors to monitor the potential difference, which corresponds to the free chloride ion concentration in the pore solution.

2) Electrical Resistivity: Measures the corrosion rates due to the penetration of chloride ions into the concrete microstructure (ASTM C1202).

3) Silver Nitrate: A qualitative method that changes color to show the depth of chloride penetration.

4) Ground Penetrating Radar, microwave spectroscopy, and Nuclear Magnetic Resonance are used for quick, non-destructive, and in-situ monitoring of chloride penetration.

1) Phenolphthalein Indicator: The most common method; a 1% solution is sprayed on a freshly broken concrete surface. Uncarbonated (alkaline) concrete turns bright pink, while carbonated (low pH) concrete remains colorless

.

2) Carbonation Depth Measurement: Measures the distance from the concrete surface to the pink boundary, indicating how far CO2 has penetrated

.

3) Half-Cell Potential Measurements: A non-destructive method utilized to estimate the probability of corrosion for steel rebars.

4) Linear Polarization Resistance (LPR): Utilized to determine the instantaneous corrosion rate of the steel rebars.

5) Electrochemical Impedance Spectroscopy: A technique that monitors the rise in concrete resistivity as pores fill with CaCO3.

6) Gravimetric Mass Loss: A highly accurate method used in laboratory settings to calculate the precise amount of metal lost to corrosion.

1.3. Environmental Impact on RC Structures
Climate change threatens the safety, functionality, and long-term resilience of critical infrastructure. Climate extremes, including rising temperatures and erratic wind patterns, pose mounting challenges to infrastructure resilience in different cities all over the world . The projected rise in maximum temperature levels is concerning for RC structure members, as it increases the likelihood of corrosion due to CO2 or chloride ions inside the concrete microstructure . Without accurate projections of future climate extremes, existing infrastructure design standards risk becoming obsolete, potentially leaving cities dangerously underprepared for climate-related stresses. The Representative Concentration Pathways (RCPs) are emission scenarios that provide a wide range of emissions due to the influences of severe environmental factors. Scenarios like low and high emissions help model the effects of temperature and CO2 variations on RC structures.
A key limitation in climate modeling is the assumption of stationarity (climate variables fluctuate within a fixed statistical range over time). However, mounting evidence contradicts this assumption, revealing clear trends in temperature and wind extremes . Despite this, stationary models remain embedded in many engineering design codes, leading to systematic underestimation of future extremes and potentially resulting in under-designed infrastructure and higher adaptation costs . From an engineering perspective, this issue is particularly consequential. Climate variables derived from historical records are routinely used as inputs to define design loads, load combinations, durability models, and service-life predictions for infrastructure systems. As a result, errors in the statistical characterization of climate extremes can propagate nonlinearly into engineering decisions, influencing safety margins, durability performance, and long-term asset management strategies. Studies have shown that stationary approaches can underestimate climate extremes by 10–30% , posing risks to bridges and dams. These projections underscore the need for climate-adaptive materials and construction practices. Numerous studies have demonstrated the presence of nonstationarity in climate extremes ; fewer have explicitly quantified how much error stationary assumptions introduce into decision-making contexts such as infrastructure design and urban adaptation planning. While nonstationary extreme value analysis has been widely applied in climate science to characterize evolving climate hazards, its implications for engineering-relevant climate data inputs remain underexplored.
Climate change may increase their frequency and intensity, and infrastructure needs to be adapted accordingly . The concept of the return period can be extended to non-stationary models . It is important to conduct projection models of extreme events in the future that consider trends and are non-stationary, relevant to stochastic processes. The main concepts of non-stationary extreme value analysis were studied by Coles . Various methods for modeling extremes as non-stationary models are as follows:(1) the generalized extreme value distribution; (2) the generalized Pareto distribution; and (3) point process characterizations of extremes .
To assess whether the climate variables exhibited stationarity or nonstationarity, two standard series tests were applied:
1) KPSS Test: Tests the stationarity against the alternative of a unit root process .
2) ADF Test: Tests the null hypothesis of a unit root against the alternative of stationarity or trend stationarity .
3) Mann-Kendall Test: A non-parametric test utilized to identify monotonic trends in climate data, suggesting non-stationarity.
The combined application of the KPSS and ADF tests allows for a robust assessment of stationarity by accounting for their complementary null hypotheses, thereby reducing the risk of misclassification when trends are present in the data. By jointly applying tests with opposing null hypotheses, the likelihood of false inference due to test-specific bias is reduced, providing a more conservative and reliable basis for trend identification. From an engineering standpoint, such conservatism is essential, as misclassifying nonstationary climate inputs as stationary can lead to non-conservative design assumptions and underestimated risk in infrastructure analysis.
1.4. Extreme Climate Change Projections Using Various Methods
Accurate climate data projections for the future, such as maximum and minimum temperature and relative humidity, etc., must be projected carefully via different methods as mentioned below. Moreover, without accurate projections for future climate data, it would lead to a reduction in the resilience, durability, and service life of important existing and new RC structures.
1.4.1. Generalized Extreme Value Distribution (GEVD)
Extreme value theory (EVT), initially introduced by Fisher and Tippett and formalized by Gnedenko , offers a statistical framework for modeling rare events, including climate extremes and their associated return periods. A central tool in EVT is the GEVD, which is used to analyze block maxima, defined as the maximum value within a fixed time block (e.g., annually). The data were assumed to be independent, identically distributed, and stationary and have been widely applied in the environmental and climate sciences . Although classical EVT assumes stationarity, extensions of the GEVD allow for nonstationarity by modeling time-varying parameters, enabling more realistic modeling of climate extremes under changing conditions.
The GEVD, implemented via the block maxima method, is widely used in environmental engineering to estimate return levels for rare events. It has proven effective in projecting extreme temperatures in climatically sensitive regions, such as the Northwest Himalayas and in urban environments . Bhattacharya et al. highlighted the importance of integrating such approaches in urbanizing for climate-resilient infrastructure planning.
The GEVD assumes that the maxima Mn = max {X1, X2,..., Xn}, where each Xi is a random variable. The cumulative distribution of Mn is given by equation (3).
PMnz=PX1z,,Xnz=[Fz]n(3)
The annual block maxima of each climate variable were extracted to fit the GEVD models, enabling the estimation of return levels accompanied by rare climate extremes. This approach allows quantification of the probability of extreme events. Gong and Wambua et al. , among others, have applied similar models to analyze temperature extremes in various regions. The cumulative distribution function (CDF) of the GEVD is shown in equation (4).
FX;μt, σ,ξ=exp-1+ξX-μtσ-1ξ(4)
The modeling approaches in the GEVD model are as follows:
1) Stationary GEVD: All parameters (μ, σ, ξ) are assumed to be constant over time.
2) Nonstationary GEVD: The location parameter μ(t) varies with time, allowing the model to explicitly capture long-term trends in climate extremes, while the scale and shape parameters remain constant.
Nonstationarity was introduced through the location parameter because long-term climate change primarily manifests as systematic shifts in the central tendency of extremes, whereas allowing scale or shape parameters to vary can lead to overparameterization and reduced robustness of return level estimates for finite observational records. The time-varying location parameter was expressed, as shown in equation (5).
μt=μ0+μ1t+μ2t2+μ3t3μt= μ0+μ1t+μ2t2+μ3t3(5)
where σ and ξ remain constant, according to Panagoulia et al. . This formulation balances model flexibility with parameter stability, reducing overfitting while capturing nonstationary behavior.
Non-stationarity was introduced through a time-varying location parameter μ(t), while the scale (σ) and shape (ξ) parameters were assumed to be constant. This modeling approach follows established practices in nonstationary extreme-value analysis and aims to capture systematic shifts in the central tendency of climate extremes while maintaining parameter stability. Allowing all parameters to vary with time can lead to overparameterization and reduced robustness of return level estimates, particularly for relatively short observational records, whereas a time-varying location parameter provides a parsimonious and decision-relevant representation of evolving climate extremes.
The formulation of the GEVD was first introduced by Jenkinson , who unified three types of extreme value distributions . These represent the limiting distributions for the maxima. The analytical forms of both the CDF and PDF for each distribution type are detailed in Table 2.
Table 2. The CDF and PDF expressions for the three GEVD types.

Type of Distribution

Shape Parameter

CDF

PDF

Type I (Gumbel)

ξ = 0

exp-exp-X-μσ

1σ×exp-X-μσ-exp-X-μσ

Type II (Fréchet)

ξ ˃ 0, X > µ

exp-σX-μξ

ξσσ X-μ(ξ+1)exp-σX-μξ

Type III (Weibull)

ξ ˂ 0, X < µ

1-exp-X-μσξ

ξσ X-μ σ(ξ-1)exp-X-μ σξ

Return levels are defined as the value expected to be equal to or exceeded once every return period (T). The return period (T) (years) is calculated based on the non-exceedance probability (p), as shown in equation (6).
T=11-p(6)
Therefore p = 1-1/T
The corresponding return level (qp) is derived from the GEVD quantile function, as shown in equation (7).
qp=(-1lnpξ-1)σξ+μ(7)
1.4.2. Generalized Pareto Distribution (GPD)
The utilization of the GPD, along with the block maxima approach for parameter estimation, involves using only one data point from each block, representing the highest value. The data utilized treats all observations (yi) above a high threshold (u), representing extreme events. The distribution function of Y = (y-u) conditional on (y > u) asymptotically approaches (u), increasing the GPD, as illustrated by equation (8) .
Hy=1-1+ζ×yψ-1ζ(8)
In practice, changing the block size (n) affects the values of the GEVD parameters, while the parameters of the corresponding GPD remain unchanged. In the case of the non-stationary variable, the parameters of the GPD may be treated as functions of time .
1.4.3. Point Process Characterization of Extremes (PPE)
The statistical approach to model extreme events is based on the combination of the GEVD and the GPD approaches to obtain a PPE. This is achieved by introducing a bivariate process (t, Z), where Z is a random variable representing values of (Xi) above a high threshold (u), while a random variable (t) is the time at which such events (Xi> u) occur. It can be shown that if the maximum of (Xi’s) follows the GEVD in equation (9).
λt, Z=1σ1+ζ×Z-μσ-1ζ-1(9)
2. The Limit State Functions for the Corrosion Initiation Due to Carbonation and Chlorides
The limit state function for the carbonation-induced corrosion initiation stage is illustrated in Table 3 for various RC sections, considering the uncertainty of various random variables defined in the limit state functions. Furthermore, the limit state function for the chloride-induced corrosion initiation, the resistance term is represented by the threshold level, and the load term is represented by the concentration of chloride at the steel level, as shown in Table 4. Furthermore, the limit state functions consider the impact of environmental factors such as CO2 concentration, maximum temperature, and relative humidity, reflecting their effect on the effective diffusion coefficient for either carbonation- or chloride-induced corrosion initiation stages. In addition, the influence of various crack width ranges on the diffusion coefficient for cracked concrete is illustrated in detail, as shown in Table 3 and Table 4.
Table 3. Limit state functions for the corrosion due to carbonation at various RC sections.

Limit State Functions

Types of RC Sections

References

G=CV -2×De, CO2×CO2100×t0.218×(C+kP) f T=expUcR×1Tr-1T f(RH) = (1 − (RH/100))2.2

Un-cracked Concretes

G=CV-2 fTt×Dco2taKurban2000tCco2t dtG=CV-2fTt×Dco2taKurban2000tCco2tdtG=CV-2 fTt×Dco2taKurban2000tCco2t dt ftt=eER×1293-1273+Taverage t Taverage t=i=2000tTtt-1999 ftt=eER×1293-1273+Taverage tftt=eER×1293-1273+Taveraget

, 59]

G=CV-Xc(t)=2 Dco2(t) aKurbanCco2 (t-1999)

, 59]

G= CV-2×De, CO2×CO2100×t0.218×(C+kP)×(2.816×Wc+1)

Cracked Concrete

G=CV-2×De, CO2×CO2100×t0.218×C+kP×11.4×Wc+1 f T=expUcR×b×1Tr-1T f(RH) = (1 − (RH/100))2.2

]

Table 4. Limit state functions for the corrosion due to chloride at various types of RC sections.

Limit State Functions

Types of RC Sections

References

gCs,  x,Cth, Dc=Cth-Cs1-erfx2Dc×t Dc=D×f1T×f2te× f3RH f1T=ExpEaR1T1-1T2 f2te=ξ+1-ξ28te12 f3RH=1+1-RH41-RHc4-1

Uncracked concrete

gCs,  x,Cth, Dc=Cth-Cs1-erfx2Dcc×t Dcc=(A×Da)+(Acr×Dcr)(A+Acr) Dcr2×10-11w-4×10⁻¹⁰ 30 μmw80 μmDcr14×10-10w>80 μm Da=10-6.77×WC2+10.10×WC-14.64withoutSCM Da=10-0.79×WC2+3.40×WC-13.10withSCM Another Performance Function Method: gCs,  x,Cth, Dc=Cth-Cs1-erfx2Dc×t Dc=D×f1T×f2te× f3RH×f(w) f(w)=1+347.85w-1642.57w2+4189w3 (w ranges from 0.1 to 0.4 mm) according to Park et al.

.

Cracked concrete

, 63]

The limit state function for carbonation-induced corrosion initiation determines when the passive protective layer of steel in concrete is destroyed. It is reached when the carbonation depth equals or exceeds the concrete cover. The limit state function for chloride-induced corrosion initiation evaluates the time when chloride ions breach the concrete cover and reach the steel surface in concentrations sufficient to break down the protective passive layer. Table 5 shows a comparison between carbonation and chloride-induced corrosion initiation stage limit state functions, according to assumptions, sources of uncertainty, and practical applications.
Table 5. Comparison between carbonation and chloride-induced corrosion initiation according to the limit state functions.

Key Factors

Chloride-Induced Corrosion

Carbonation-Induced Corrosion

Assumptions

Diffusion-Dominant Transport: It is assumed that chloride ingress is governed primarily by Fickian diffusion in saturated or partially saturated pores, ignoring convective transport mechanisms (e.g., absorption during wet-dry cycles). Homogeneous Matrix: The model assumes a homogeneous concrete matrix and uniformly distributed concrete cover, often ignoring micro-cracks and localized defects.

Sharp pH Front: The model assumes the carbonation front represents a sharp, distinct drop in the pore solution's pH from above 12 down to approximately 9, at which point the passive film on the steel becomes unstable. Diffusion-Based Progress: CO2 transport is treated as a diffusion-driven process described generally by Fick’s laws.

Sources of Uncertainty

Critical Chloride Threshold: It is highly variable. Depending on the steel type, cement chemistry, and the local pH of the pore solution, the threshold fluctuates widely, making it one of the largest sources of epistemic uncertainty in service-life modeling. Environmental / Exposure Conditions: Surface chloride concentration (Cs) and the aging factor rely heavily on microclimates, wetting-drying cycles, and temperature, all of which exhibit intrinsic statistical randomness (aleatoric uncertainty). Model Accuracy: Analytical equations, including the error-function solution, contain simplification errors. Using deterministic constants for naturally convoluted physicochemical processes necessitates the use of partial safety factors or full probabilistic frameworks (like Monte Carlo simulations) to account for scatter.

Model Uncertainty: Standard equations rely on empirical simplifications (such as the square-root-of-time law) that cannot perfectly map non-linear microclimatic shifts and unpredictable weather changes. Material Variability: The permeability and alkalinity of concrete can vary significantly batch-to-batch, and cast-in-place concrete properties rarely match idealized laboratory conditions. Climate Change: Projected increases in atmospheric (CO2) and shifting global temperatures directly alter carbonation rates, making historic baseline averages unreliable.

Practical Applications

Probabilistic Design: Used in modern structural design codes (such as the fib Model Code for Concrete Structures) and ISO standards to perform full-probabilistic service life design. Engineers set a target reliability index (often targeting a failure probability of 10% to 7% for serviceability to determine the required concrete cover thickness and maximum allowable diffusion coefficients.

Practically, carbonation-induced corrosion is considered a Serviceability Limit State (SLS). Since cross-sectional loss is generally negligible in the absence of chlorides, the primary structural threat is expansive cracking and concrete spalling resulting from rust accumulation. Thus, the function is applied during the structural design phase to specify adequate concrete cover and concrete mix qualities, or during the assessment of existing structures to plan preventative maintenance and surface treatments. Because of the high uncertainties, engineers rarely use this limit state function with single deterministic values. Instead, they apply probabilistic methods (like Monte Carlo Simulations within the fib Model Code framework) to calculate the Probability of Corrosion Initiation (usually aiming for a target reliability index (β= 1.3) for depassivation).

In addition to durability deterioration mechanisms, the robustness of RC structures under extreme actions should also be considered within the broader framework of infrastructure resilience. Kılıçer evaluated the progressive collapse performance of an RC structure using the enhanced local resistance method and compared the requirements of UFC 4-023-03 with the Turkish Earthquake Code 2018.
3. Materials and Corrosion Mitigation Strategies
Mitigate corrosion in RC structures by limiting moisture and oxygen ingress inside the concrete microstructure. Use supplementary cementitious materials (e.g., silica fume or fly ash) to reduce permeability. Apply migrating corrosion inhibitors and hydrophobic surface treatments (silanes). For severe environments, implement cathodic protection and corrosion-resistant reinforcement (GFRP or epoxy-coated rebar). To mitigate chloride- and carbonation-induced corrosion in RC structures, strategies include deploying SCMs and increasing concrete cover. Projected extreme climate change factors such as increased ambient temperatures, fluctuating humidity, and elevated CO2 accelerate the penetration of aggressive agents and exacerbate structural degradation rates.
Elevated temperatures increase the diffusivity of aggressive agents. A +2°C temperature rise can increase corrosion rates by up to 15%. Moreover, higher atmospheric CO2 levels accelerate the rate of carbonation. Increased moisture evaporation and cyclic wetting/drying patterns accelerate chloride accumulation, doubling the diffusion rate in severe projections. Without adaptation, extreme climate projections are expected to shorten the operational lifespan of RC infrastructure by up to 50%.
3.1. Utilization of SCMs
CO2 emissions are the most critical parameter in global warming associated with RC production, contributing to roughly 8% of global anthropogenic CO2 emissions . RC production heavily contributes to global warming, responsible for up to 10% of global anthropogenic CO2 emissions. The cement component (specifically clinker production) is the primary driver, accounting for roughly (85%-90%) of total emissions. Table 6 divides the life-cycle assessment (LCA) embodied carbon emissions for 1 cubic meter of RC into modules A1-A3. It was observed that the aggregates (sand and gravel) have relatively low carbon footprints, but the steel reinforcement in RC structures drastically increases embodied carbon, as shown in Table 6 .
Table 6. LCA for different production phases of reinforced concrete.

Production Phase

Sub-phase and Details

Approx. (CO2) Share

Main Drivers and Processes

A1: Raw Material Supply

Cement/Binder

82% - 89%

Calcination of limestone comprises ~50% of CO2, and fossil fuel combustion for rotary kilns consumes about ~40% of CO2.

Steel Rebar

7% - 11%

Primary steel manufacturing from iron ore and scrap in blast furnaces.

Aggregates

2% - 4%

Quarrying, crushing, and washing coarse and fine aggregates.

A2: Transport

Material Delivery

2% - 4%

Diesel is consumed in transporting raw materials (aggregates, cement, steel) to mixing plants.

A3: Manufacturing

Mixing & Processing

1% - 2%

Electricity and fossil fuels are utilized at the ready-mix or precast concrete plant.

To reduce the environmental impact, the construction and design sectors increasingly utilize specific emission-reduction strategies:
1) Supplementary Cementitious Materials (SCMs): Substituting a portion of Portland cement with industrial byproducts like fly ash or ground granulated blast-furnace slag (GGBS) can reduce embodied carbon by 25% to 50%.
2) Portland Limestone Cement (PLC): Replacing clinker directly with finely ground limestone lowers the carbon footprint of the cement itself.
Therefore, calculating the precise structural load limits and using high-strength concrete can dematerialize the project, requiring less total amount of concrete and steel in the construction project sector.
Incorporating fly ash, silica fume, and slag into concrete mixes improves the concrete microstructure durability in the case of carbonation/chloride-induced corrosion . Silica fume can reduce carbonation depth. Elevated temperatures increase corrosion processes, reinforcing the urgency of designing with resilience. It is not recommended to use 30% of low-calcium fly ash (LCFA) as SCMs in mixes for cracked concrete with a crack width of 0.2 mm or more, when the RC member is exposed to CO2 ranging from 600 to 1200 PPM .
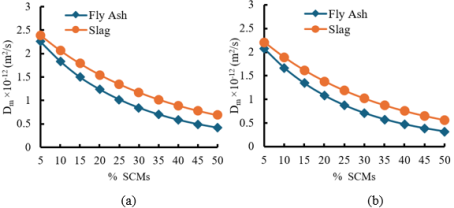
Figure 2 shows the decreasing trend of the chloride diffusion coefficients across the percentages of the fly ash or slag used in concrete mixes, in different years of exposure. FA significantly decreases the average chloride diffusion coefficient of chloride ions in concrete as the percentage of FA in the concrete mix increases compared to SG, which acts as an SCM with the total amount of cement used in the mix. The water-to-cement ratio is set at 0.4 for a concrete mix utilized in the RC members for the bridge decks. In addition, the calculation of the average chloride diffusion coefficient is conducted using equations adapted from Hassan . Finally, it was deduced from Figure 2 that the relationship between various percentages of either fly ash or slag utilized as SCMs, ranging from 5% to 50% in the mixes, and the corresponding average chloride diffusion coefficients is a decreasing exponential function in different years .
Figure 2. Relationship between chloride diffusion coefficient values and the corresponding percentages of fly ash and slag utilized in concrete mixes. (a) T = 50 Years, (b) T = 100 years.
3.2. Geopolymer Concrete (GPC)
GPC structures reduce production-phase carbon emissions by 40% to 90% compared to ordinary Portland cement (OPC) concrete structures. However, OPC concrete derives its high carbon footprint, emitting approximately 0.8 tonnes of CO2 per ton of cement production from limestone and fuel combustion.
Validating sustainability and economic claims requires implementing a harmonized Life Cycle Assessment (LCA) and Life Cycle Cost Analysis (LCCA). LCA is the standardized methodology used to evaluate the environmental burdens associated with a product, process, or infrastructure system across its entire lifespan (often referred to as "cradle-to-grave" or "cradle-to-cradle") . These frameworks translate qualitative sustainability goals into measurable, quantitative evidence. Regarding CO2 concentration reduction, it evaluates embodied carbon and operational carbon. For instance, comparative studies show that adopting recycled construction materials or geopolymers can reduce CO2 emissions by over 45% compared to traditional cement-based methods . For service-life extension: by modeling deterioration curves, LCA determines how delayed reconstruction reduces overall environmental burdens and resource consumption.
GPC is a sustainable type of concrete these days, instead of OPC concrete, especially in chloride-rich environments. GPC exhibits high durability, improved strength, and greater resistance to high temperatures and chloride penetration . These attributes make GPC a promising material for future RC infrastructure in harsh environments . The influence of temperature values ranging from 25°C to 45°C on the reliability index for RC bridge decks made of GPC composed of 50% FA and 50% SG with different concrete cover thicknesses, having various coefficients of variation (dealing with the sensitivity analysis), was assessed in different years according to Amleh et al. . Utilizing GPC instead of normal OPC concrete for RC members exposed to extreme environmental conditions is recommended to enhance the serviceability of the RC structures, according to Amleh et al. . Moreover, Amleh et al. showed that the utilization of GPC with 50% FA and 50% SG significantly inhibited chloride-induced corrosion compared with normal concrete at different temperature levels.
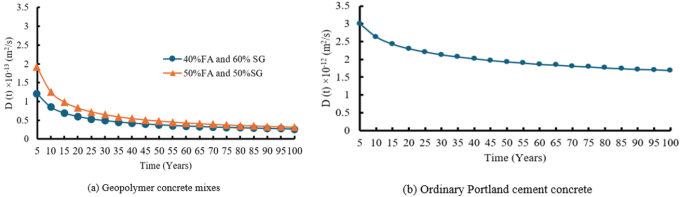
A GPC composed of 40% FA and 60% SG exhibits lower permeability, attributed to the higher binding capacity of the hydrotalcite phases and the greater degree of geopolymerisation in blended FA and SG, as shown in Figure 3. The main advantage of selecting the GPC consisting of 40% FA and 60% SG is the significantly longer time to corrosion initiation of the rebar, compared with OPC concrete and a GPC mix consisting of 50% FA and 50% SG (as shown in Figure 3). This is due to the presence of slag in GPC, which provides better protection against rebar corrosion than OPC concrete when the concrete is subjected to high levels of chloride concentrations, as shown in Table 7. The adoption of GPC in the construction industry should be considered to enhance the durability of urban infrastructure.
Table 7. Chloride diffusion coefficient for mix proportions.

Mix Proportions

Apparent Chloride Diffusion Coefficient (Do) ×10−12 (m2/s)

50/50 FA/SG

2.38

40/60 FA/SG

1.01

OPC

6.70

Where: OPC is the ordinary Portland cement concrete.
Figure 3. Diffusion coefficients for chloride over time for different types of concrete.

3.3. Corrosion Inhibitors
There are different types of corrosion inhibitors as follows:
1) Using a calcium nitrite-based corrosion inhibitor accompanied by the optimum percentage of FA.
2) Anodic inhibitor (calcium nitrite) creates a passive film. It is highly effective at chloride-to-nitrite ratios > 1.5.
3) Amines and fatty acid derivatives (i.e., organic inhibitors) that form a hydrophobic barrier on steel.
4) Molybdates: Inorganic compounds that also create a protective layer.
Based on Casanova et al. , ascorbic acid, cymbopogon citratus extract, licorice extract, and maize gluten meal are considered alternative inhibitors against nitrites in terms of inhibition efficiency and corrosion completeness.
3.4. Galvanized Steel / Stainless Steel
Stainless steel offers superior, long-term corrosion resistance, making it ideal for harsh, wet, or marine environments, as shown in Table 8 . However, galvanized steel (zinc-coated) provides excellent, economical, moderate corrosion protection, perfect for dry or structural applications, but struggles with long-term exposure to salt or high humidity. For maximum durability, especially in harsh conditions, stainless steel is the better choice. For projects with moderate environmental exposure and tighter budgets, galvanized steel is a reliable alternative.
Table 8. Comparison between galvanized steel and stainless steel .

Properties

Galvanized Steel (GS)

Stainless Steel (SS)

Mechanism

Sacrificial zinc coating (cathodic protection).

Forms a protective passive oxide film

Corrosion Resistance

Less Superior compared to SS.

Superior

Cost

(1000-1300 USD)/ ton in the USA

(2500-4000 USD)/ ton in the USA

Durability

Less Robust compared to SS.

More Robust

3.5. Reduction in the Water-to-Binder Ratio for the Concrete Mix
Lowering the w/c ratio restricts void formation in the concrete microstructure. The resulting denser, less permeable structure hinders the penetration of external harmful agents such as sulphate ions, chloride ions, and carbon dioxide, etc. The w/c ratio in the concrete mix must be low to produce durable concrete and a more resistant microstructure against different types of ions that lead to corrosion . Furthermore, a lower w/c ratio minimizes excess water in the mix, resulting in a denser, less permeable, and more compact microstructure with fewer capillary pores. A denser structure with a low w/c ratio directly reduces the chloride/CO2 diffusion coefficient, meaning chloride or CO2 ions penetrate the concrete more slowly. Furthermore, a low w/c ratio, below 0.4, for concrete mixes results in higher electrical resistivity, which restricts the flow of current between anodic and cathodic regions on the steel surface, significantly slowing the corrosion process. Finally, a low w/c ratio strengthens the interfacial transition zone between cement paste and aggregate, therefore slowing down aggressive agent penetration.
Recommendations are associated with the implementation of a concrete mix with a low w/c ratio. To achieve these benefits, the following procedures are necessary:
1) High-range water reducers (superplasticizers) must be utilized to ensure proper workability and compaction to maintain workability without increasing the water content.
2) Proper curing (at least 7–14 days) is essential to avoid premature self-desiccation and cracking, which would counteract the benefits of the dense mix.
3) The optimum w/c ratio should be below 0.40 or 0.39, especially in harsh environments (e.g., marine environments), to guarantee excellent chloride resistance.
4) Lower w/c ratios (ranging between 0.3-0.4) will lead to significantly lower carbonation depths compared to higher w/c ratios (w/c>0.5) over a certain period.
3.6. Concrete Cover Limitation
Optimizing adequate concrete cover surrounding the steel rebars that satisfy specific minimum requirements and climate change according to the country standard code is a critical issue nowadays. In North America, Hassan et al. recommend a 70 mm concrete cover for RC decks to help cracked concrete with a 0.2 mm crack width withstand the impacts of climate change. However, for uncracked concrete with a 40 mm depth, the likelihood of carbonation-induced corrosion remained nearly zero across different fly ash percentages of either low- or high-calcium fly ash, changing from 5% to 30% at 100 years of CO2 exposure, indicating a low risk to the service life of the RC structure. Amleh et al. recommend increasing the concrete cover to 50 mm at least for new and existing RC bridge decks made of GPC in North America. This assessment will enhance the resistance of RC structures against the impacts of rising maximum temperatures and chloride ion penetration.
4. Significance of Crack Width and Limitations on Risk of Steel Rebar Corrosion
Concrete cracks accelerate the initiation phase of corrosion by providing direct, preferential pathways for aggressive agents like chlorides and carbon dioxide to reach the steel reinforcement. While crack width directly influences the speed of penetration, it has less of an effect on long-term propagation. Cracks in hardened concrete are generated due to shrinkage, corrosion of the steel rebars, maximum temperature, and relative humidity. Crack width limitations across different types of RC structures subjected to various environmental exposures in various countries are listed below, as in Table 9, which will be studied further due to climate change. Design codes specify maximum allowable crack widths to protect various RC structures from rapid corrosion. Consequently, studying chloride and CO2 ion transport through cracks is essential. Strict crack width limits in construction and maintenance are critical to ensuring structural longevity, particularly in climates with heavy use of deicing salts.
Cracks in concrete significantly reduce the time for chloride-induced corrosion to occur by providing pathways for aggressive agents like sulphates or chloride/CO2 ions to penetrate the microstructure of concrete. Some studies treated cracks as part of the concrete matrix and calculated diffusion coefficients for cracked concrete . Kušter Maric et al. deduced that the influence of the wetting–drying cycles in the chloride ingress model for cracked sections will result in a significant penetration of chloride ions. Moreover, Kušter Maric et al. deduced that the chloride content at the average concrete cover depth of 30–50 mm is doubled if the wetting–drying cycles and non-uniform surface chloride concentration over the year take place, compared to the model that doesn’t consider the impact of the wetting– drying cycles and with constant surface chloride over time. Liu et al. investigated the impact of various crack characteristics on chloride transport, and the coupling between cracking and chloride ingress, as well as other environmental factors, is significant.
Hassan, showed that the influence of various crack widths, for either 0.05 mm or 0.1 mm, had a low effect on the likelihood of carbonation induced corrosion conducted using the Kwon and Na model across different percentages of either high or low calcium fly ash, ranging from 5% to 30% in the mixes for RC members with a mean concrete cover depth of 70 mm. Moreover, the impact of the high calcium fly ash, varying from 5% to 15% in the mixes for cracked RC decks with a crack width of 0.05 mm, would have a negligible effect (low impact) on the likelihood of carbonation-induced corrosion, as reported by Hassan et al. 's model. A crack width of 0.1 mm in the RC members would have a severe effect on the likelihood of carbonation-induced corrosion, as shown by the Al-Ameeri et al. model compared to the Kwon and Na model, when the percentage of low calcium fly ash ranges from 5% to 30%.
Table 9. Crack width limitations for concrete members subjected to various environmental exposures in different countries.

Country code

Crack width limitation

Canadian Code (CSA A23.3-19)

Based on CSA A23.3-19, the acceptable crack widths in RC are generally designed based on exposure conditions to ensure durability and prevent corrosion (CSA A23.3):

1) Interior Environment: 0.40 mm.

2) Exterior Environment: 0.30 mm to 0.33 mm.

3) Corrosive Environment: 0.15 mm to 0.20 mm.

4) Water Retaining Structures: (<0.2 mm).

The Canadian climate necessitates a focus on Freeze-Thaw (F-classes) and Chloride/De-icer exposure (C-classes) for RC structures having a fixed service life (e.g., 50 or 75 years).

Egyptian Code of Practice (ECP 203)

Under the Egyptian Code of Practice (ECP 203), crack width limits are not explicitly determined by broad geographic climate regions. Instead, the code defines limits based on the specific environmental exposure conditions (humidity, presence of aggressive chemicals) and the structure's vulnerability. The Standard target service life is conventionally assumed to be 50 to 75 years for typical concrete buildings.

According to the Egyptian Code of Practice (ECP 203), the allowable crack width in RC structures typically varies from 0.1 mm to 0.3 mm, depending on environmental exposure conditions and structural type.

Environmental Exposure:

1) Aggressive Environments: Often limited to 0.1 mm.

2) Normal Environments: Generally limited to 0.2 mm–0.3 mm.

3) Water tanks: the allowable crack width is often 0.1 mm or 0.2 mm.

American Concrete Institute (ACI-224R-01)

ACI-224R-01 establishes tolerable crack widths based purely on environmental exposure and aesthetic needs, rather than strict service life. Standard design service life for permanent structures is typically 50 to 120 years, but ACI's crack limits are defined by the severity of the surrounding climate.

Acceptable crack widths in concrete vary from 0.1 mm to 0.41 mm, depending on the exposure condition (ACI 224R-01/ACI 350-06).

1) Protective membrane: 0.41 mm.

2) Humidity, moist air: 0.30 mm.

3) Deicing chemicals: 0.18 mm.

4) Seawater, wetting/drying: 0.15 mm.

5) Water-retaining structures: 0.10 mm.

American Association of State Highway and Transportation Officials (AASHTO)

AASHTO sets a default design life of 75 years for concrete bridges. While the specifications establish limits based on exposure classes, they do not directly classify crack widths by regional climate. Instead, maximum crack width (w) is tied to specific environmental exposure conditions.

AASHTO specified crack width limitations to 0.4 mm for Class 1 (severe exposure/deicing chemicals) and 0.3 mm for Class 2 (moderate exposure) to ensure durability. These limits help control reinforcement corrosion, particularly in bridge decks and superstructure components.

Saudi Building Code (SBC 304)

The Saudi Building Code (SBC 304) relies on American Concrete Institute (ACI 318) methodologies but features customized durability requirements suited for Saudi Arabia’s severe climate. Crack width limits primarily depend on the environmental exposure class rather than just the geographic region or target service life. Under the Saudi Building Code, standard structures are typically designed for a target service life of 50 years, while major infrastructure projects (bridges, high-rises) are typically designed for 100 years.

The acceptable crack width in concrete according to SBC 304 depends on the environmental exposure conditions, with a common maximum limit of 0.30 mm to 0.40 mm for general RC members under service loads.

1) Moderate Exposure: Maximum crack width is often taken as 0.40 mm.

2) Severe Exposure: Maximum crack width is restricted to 0.30 mm.

3) Water Retaining Structures: For enhanced watertightness, more restrictive limits are applied, often requiring crack widths to be less than 0.2 mm.

British Standard European Norm (BS EN 1992-1-1/Eurocode 2) and BS 8110

Under both British and European structural concrete standards, allowable crack width limits (Wmax) are primarily governed by exposure severity, durability, and the likelihood of steel corrosion

, rather than a specific target service life (which is typically assumed to be 50 to 100 years depending on the structure's design class).

The generally accepted maximum crack width for RC members is 0.3 mm for most structural applications. This limit is primarily for aesthetics and serviceability; tighter limits of 0.1 mm to 0.2 mm are required for severe, aggressive, or watertight environments.

5. Conclusions
Based on the material selection to mitigate the corrosion process for the steel rebars embedded inside concrete, the following recommendations are as follows:
The GPC mixes utilized in this research, compared to the OPC concrete mix, are (40% FA and 60% SG) and (50% FA and 50% SG).
1) Utilization of GPC, consisting of 40% FA and 60% SG, results in a significantly longer time to corrosion initiation of the rebars, compared with OPC concrete and a GPC mix consisting of 50% FA and 50% SG, when the concrete is subjected to high chloride concentrations.
2) A GPC composed of 40% FA and 60% SG shows that the apparent chloride diffusion coefficient is approximately 2.38 and 6.70 times lower than that of the apparent chloride diffusion coefficient for a GPC composed of 50% FA and 50% SG and an OPC concrete mix, respectively.
3) It is recommended to utilize a GPC composed of 40% FA and 60% SG as a more sustainable and resistant material against severe chloride environments instead of utilizing OPC or GPC concrete mixes with a percentage of slag less than 60% SG.
4) It is not recommended to utilize 30% FA as SCMs in mixes for cracked concrete with a width of 0.2 mm or more, when it is subjected to a CO2 change from 600 PPM to 1200 PPM and severe maximum temperature beyond 35°C.
5) The average chloride diffusion coefficient for fly ash is lower than the average chloride diffusion coefficient for slag across various percentages of SCMs ranging from 5% to 50% in the concrete mixes, which is composed of a water-to-cement ratio of 0.4 and cement content of 460 kg/m3 at different times of chloride exposure.
6) Slag pozzolanic material has a severe effect on the carbonation of concrete compared to fly ash.
7) As the percentages of fly ash or slag increase in the mixes from 5% to 50% in the concrete mix, the average chloride diffusion coefficient decreases nonlinearly and dramatically, approximately from 2.5 ×10⁻¹² m2/s to 0.5×10⁻¹² m2/s at 50 years of chloride exposure.
8) For RC bridges, nuclear power plants, and other vital structures, it is recommended to use stainless steel instead of carbon steel rebars, which offer superior long-term corrosion resistance and a reduction of rehabilitation costs along service life for vital RC structures located in harsh environments.
9) The optimum W/C ratio in concrete mix should be optimized below 0.39, especially for RC structures located in harsh environments, to guarantee excellent resistance against carbonation and chloride-induced corrosion.
6. Recommendation
1) In North America, it is recommended to have at least 70 mm of clear concrete cover for RC decks to help decks withstand the impacts of climate change. However, it is also recommended to limit the concrete cover to at least 50 mm for new and existing RC decks made of geopolymer concrete composed of fly ash and slag in its mix when the RC member is exposed to severe temperature levels.
2) It is recommended to utilize a 40% FA and 60% SG as a geopolymer concrete mix to withstand the effects of deicing salts in North America instead of a geopolymer concrete mix consisting of an amount less than 60% to inhibit chloride-induced corrosion.
3) Climate change projections for different cities all over the world must be developed accurately to withstand the effects of severe climate change on existing and new RC structures.
4) In future studies, design codes for RC members must be updated with new maximum allowable crack widths to protect various RC structures against rapid corrosion driven by severe climate change. Strictly enforcing crack width limits in construction and maintenance is critical to ensuring structural longevity, particularly in climates with severe chlorides, freeze-thaw cycles, CO2 concentrations, and other harmful gases.
To mitigate carbonation and chloride-induced corrosion in RC structures, civil engineers utilize a dual-phased attenuation policy: proactive design for new builds and tailored retrofitting for existing assets. The main pathways where corrosion mitigation addresses these durability challenges are as follows:
1) For new structures: Utilizing SCMs, increasing the reinforcement cover, applying epoxy-coated or galvanized reinforcement.
2) For existing structures: Applying hydrophobic impregnations (e.g., silanes, siloxanes) or elastomeric coatings; applying cathodic protection actively reverses the corrosion process in steel; encapsulating severely damaged structural members with fiber-reinforced polymers.
Abbreviations

A

Area of Uncracked Concrete (mm2)

Acr

Area of the Crack (mm2)

Cth

Chloride Threshold Level (kg/m3)

Cs

Surface Chloride Concentration (kg/m3)

CV

Concrete Cover for the rc Deck

Dc

Corrected Chloride Diffusion Coefficient (m2/s)

D

Chloride Diffusion Coefficient (m2/s)

Da

Apparent Chloride Diffusion Coefficient (m2/s)

Dcr

Chloride Diffusion Coefficient Inside the Crack (m2/s)

Dcc

Total Diffusion Coefficient for Cracked Concrete (m2/s)

E

Activation Energy of the Diffusion Process (40 kj/mol)

f1(T)

A factor that Represents the Maximum Temperature

f2(te)

A factor that Represents the Equivalent Maturation Time of Concrete

f3(RH)

A factor that Represents the Influence of Relative Humidity

G

Performance Function for the Carbonation-Induced Corrosion Initiation Stage

R

Gas Constant (8.314 × 10⁻³ kj/mol k)

Ti

Time of Corrosion Initiation due to Chlorides (years)

T(t)

Temperature at time t (°c)

w

Crack Width (mm)

x

Concrete Cover Depth Surrounding the Steel Rebar (mm)

X

Climate Variable that will be Considered

μ

Location Parameter in gevd

μ(t)

Time-varying Location Parameter

σ

Scale Parameter

ξ

Shape Parameter

ψ

Scale Parameter

Author Contributions
Mostafa Hassan: Conceptualization, Data curation, Formal Analysis, Funding acquisition, Investigation, Methodology, Project administration, Resources, Software, Supervision, Validation, Visualization, Writing – original draft, Writing – review & editing
Conflicts of Interest
The author declares no conflicts of interest.
References
[1] Hassan M, Amleh L, Influence of Climate Change on Probability of Carbonation-Induced Corrosion Initiation. Periodica Polytechnica Civil Engineering Journal, 2024; 68: 57–67.
[2] Saura Gómez P, Sánchez Montero J, Torres Martín JE, Chinchón-Payá S, Rebolledo Ramos N, Galao Malo Ó, Carbonation-Induced Corrosion of Reinforced Concrete Elements according to Their Positions in the Buildings. Corrosion and Materials Degradation, 2023; 4: 345-363.
[3] Sagar C, Chauhan A, Sharma UK, Synergistic effect of carbonation and cast-in-chlorides on corrosion initiation in reinforced concrete. Structures, 2025; 72: 108264.
[4] Tuutti K. Corrosion of steel in concrete. Doctoral Thesis (monograph). Swedish Cement and Concrete Research Institute. 1982. Stockholm, Division of Building Materials. Sweden, pp. 469.
[5] Lopez W, and Gonzalez J, Influence of the degree of pore saturation on the resistivity of concrete and the corrosion rate of steel reinforcement. Cement and Concrete Research, 1993; 23 (2): 368-376.
[6] Andrade C, and Alonso C, Durability design based on models for corrosion rates. The Modelling of Microstructure and Its Potential for Studying Transport Properties and Durability. NATO ASI Series. 1996; 304: 473-492.
[7] Pang L, and Li Q, Service life prediction of RC structures in the marine environment using long-term chloride ingress data, comparison between exposure trials and real structure surveys. Construction and Building Materials, 2016; 113: 979–987.
[8] Croce P, Formichi P, Landi F, Structural safety and design under climate change. In Proceedings of the IABSE Congress New York: The Evolving Metropolis, NY, USA, IABSE: Zurich, Switzerland. 2019.
[9] Letcher TM, Climate Change: Observed Impacts on Planet Earth. Elsevier. 2015.
[10] Core Writing Team, Pachauri, R. K., Meyer, L. (eds.) IPCC 2014: Climate Change 2014: Synthesis Report, Contribution of Working Groups I, II, and III to the Fifth Assessment Report of the Intergovernmental Panel on Climate Change. IPCC 2015, Geneva, Switzerland. Available at:
[11] Hassan M, Assessment of Temperature Levels on the Probability of Corrosion for RC Decks Made of Various Percentages of Supplementary Cementitious Materials. SSRG International Journal of Civil Engineering, 2025; 12 (11): 36-54.
[12] Hassan M, Carbonation of Reinforced Concrete Sections Containing Various Supplementary Cementitious Materials: A Review. Journal of Building Material Science, 2025; 7(4): 142–161.
[13] Hassan M, Amleh L, Othman H. Effect of Different Cement Content and Water-Cement Ratio on Carbonation Depth and Probability of Carbonation-Induced Corrosion for Concrete. Cement Wapno Beton, 2022; 27: 126–143.
[14] Amleh L, Hassan M, Hussein L, Influence of climate change on the probability of chloride-induced corrosion initiation for RC bridge decks made of geopolymer concrete. Sustainability, 2024; 16: 8200.
[15] Hassan M, Amleh L, Influence of Various Crack Widths in RC Bridge Decks on the Initiation of Chloride-Induced Corrosion. Journal of Composites Sciences, 2025; 9: 242.
[16] Hassan M, Amleh L, Hussein L. Projection of the Carbonation Depths and its Probability of Corrosion Initiation for the Uncracked and Cracked Concrete. International Review of Civil Engineering (IRECE), 2024; 15: 381–398.
[17] Fang Y, Zhang J, Feng K, He C, Zhou Z, A simplified reliability-based design method for multiple design variables considering different limit states. Heliyon, 2024; 10 (11): e31765.
[18] Radoń U, Zabojszcza P, The Application of Structural Reliability and Sensitivity Analysis in Engineering Practice. Applied Sciences, 2025; 15 (1): 342.
[19] Mittal A, Reliability analysis of asphalt pavements: concepts and applications. In Advances in Reliability Science, Safety and Reliability Modeling and its Applications. Elsevier. 2021; 1-15.
[20] Liu H, Mao Y, Zhang Z, Yuan F, Wang F, A Second-Order Second-Moment Approximate Probabilistic Design Method for Structural Components Considering the Curvature of Limit State Surfaces. Buildings, 2025; 15(18): 3421.
[21] Shittu AA, Kolios A, Mehmanparast A. A Systematic Review of Structural Reliability Methods for Deformation and Fatigue Analysis of Offshore Jacket Structures. Metals, 2021; 11 (1): 50.
[22] Brown C, Jackson E, Harford D, and Bristow D, Cities and Towns, Chapter 2, In Canada in a Changing Climate: National Issues Report. F. J. Warren and N. Lulham (Eds), Government of Canada. 2021. p. 26.
[23] Bourque J. Three things governments need to do to protect homeowners and renters from the insurance industry’s perfect storm. December 13, 2021, Canadian Climate Institute.
[24] Clarke B, and Otto F, Reporting extreme weather and climate change: A guide of journalists. World Weather Attribution, 2024.
[25] Poonguzhali H, Shaikh RK, Dayal, and Khatak HS, A REVIEW ON DEGRADATION MECHANISM AND LIFE ESTIMATION OF CIVIL STRUCTURES. Corrosion Reviews, 2008; 26 (4): 215-294.
[26] Varnavina AV, Khamzin AK, Sneed LH, Torgashov EV, Anderson NL, Maerz NH, Boyko KJ. Concrete bridge deck assessment: Relationship between GPR data and concrete removal depth measurements collected after hydrodemolition. Construction and Building Materials, 2015; 99: 26-38.
[27] Park S, Kwon S, Jung S. Analysis technique for chloride penetration in cracked concrete using equivalent diffusion and permeation. Construction and Building Materials, 2012; 29: 183–192.
[28] Yu S, Jin H. Modeling of the corrosion-induced crack in concrete containing transverse crack subject to chloride ion penetration. Construction and Building Materials. 2020; 258: 119645.
[29] Jiang L, Lin B, Cai Y. A model for predicting carbonation of high-volume fly ash concrete. Cement and Concrete Research, 2000; 30 (5): 699–702.
[30] Al-Ameeri AS, Rafiq MI, Tsioulou O, Rybdylova O. Impact of climate change on the carbonation in concrete due to carbon dioxide ingress: Experimental investigation and modeling. Journal of Building Engineering, 2021; 44: 102594.
[31] Stewart MG, Deng X. Climate impact risks and climate adaptation engineering for built infrastructure. ASCE Press, Reston, VA, USA. 2014.
[32] Ali MS, Mirza MS. Impact of climate change on civil infrastructure: a state-of-the-art review. In Proceedings of the EIC Climate Change Technology Conference. 2015.
[33] Zhang GP, A Neural Network Ensemble Method with Jittered Training Data for Time Series Forecasting. Inf. Sci. 2007; 177: 5329–5346.
[34] Ullah MI. Component of Time Series, Basic Statistics, and Data Analysis. Statistics Lecture Notes. 2020. Online MCQs, Available online: (accessed on 08/29/2025).
[35] Kyojo EA, Osima SE, Mirau SS, Masanja VG, Applying Stationary and Nonstationary Generalized Extreme Value Distributions in Modeling Annual Extreme Temperature Patterns. Advances in Meteorology. 2024. Article ID 9652134. 15 pages.
[36] Maria D, Sasmito A, Sushama L, Khaliq MN. Non-Stationary Analysis of Future Floods Using Physical Covariates and Implications for Dams across Canada. Results Eng, 2024; 24: 103645.
[37] Fletcher CG, Matthews L, Andrey J, Saunders A, Projected Changes in Mid-Twenty-First-Century Extreme Maximum Pavement Temperature in Canada. J. Appl. Meteorol. Climatol, 2016; 55: 961–974.
[38] Poonia S, Azad S, Projection of Annual Maximum Temperature Over Northwest Himalayas Using Probability Distribution Models. Theor. Appl. Climatol. 2022; 150: 1363–1377.
[39] Ragno E, AghaKouchak A, Cheng L, Sadegh M, A Generalized Framework for Process-Informed Nonstationary Extreme Value Analysis. Adv. Water Resour, 2019; 130: 270–282.
[40] Peng L, and Stewart MG, Climate change and corrosion damage risks for reinforced concrete infrastructure in China. Structure and Infrastructure Engineering, 2014; 12 (4): 1-18.
[41] Alexander LV, Zhang X, Peterson TC, Caesar J, Gleason B, Klein Tank AMG, Haylock M, Collins D, Trewin B, Rahimzadeh F, Tagipour A, Rupa Kumar K, Revadekar J, Griffiths G, Vincent L, Stephenson DB, Burn J, Aguilar E, Brunet M, Taylor M, New M, Zhai P, Rusticucci M, and Vazquez-Aguirre JL, Global observed changes in daily climate extremes of temperature and precipitation. Journal of Geophysical Research: Atmospheres. 2006; 111: 1-22.
[42] Rootzén H, Katz RW, Design life level: Quantifying risk in a changing climate. Water Resour. Res. 2013; 49: 5964–5965.
[43] Coles S, An Introduction to Statistical Modeling of Extreme Values. Department of Mathematics, University of Bristol, Springer Series in Statistics, Springer Series in Statistics. 2001: 45-73.
[44] Kwiatkowski D, Phillips PCB, Schmidt P, Shin Y, Testing the Null Hypothesis of Stationarity Against the Alternative of a Unit Root. J. Econom, 1992; 54: 159–178.
[45] Hamilton JD. Time Series Analysis, Princeton University Press: Princeton, NJ, USA. 1994.
[46] Fisher RA, Tippett LHC, Limiting Forms of the Frequency Distribution of the Largest and Smallest Member of a Sample. Math. Proc. Camb. Philos. Soc, 1928; 24: 180–190.
[47] Gnedenko BV, Sur La Distribution Limite Du Terme Maximum D'Une Série Aléatoire. Ann. Math. 1943; 44: 423–453.
[48] Leclerc M, Ouarda T, Nonstationary Regional Flood Frequency Analysis at Ungauged Sites. J. Hydrol, 2007; 343: 254–265.
[49] Reiss RD, Thomas M, Statistical Analysis of Extreme Values: With Applications to Insurance, Finance, Hydrology, and Other Fields. 3rd ed. Birkhäuser: Basel, Switzerland. 2007.
[50] Bhattacharya A, Papakonstantinou KG, Warn GP, McPhillips L, Bilec MM, Forest CE, Hasan R, Chavda D, Optimal Life-Cycle Adaptation of Coastal Infrastructure under Climate Change. Nat. Commun, 2023; 14: 5085.
[51] Gong S. Estimation of Hot and Cold Spells with Extreme Value Theory. Master’s Thesis. Department of Mathematics. Uppsala University. 2012. Uppsala, Sweden, U.U.D.M. Project Report: 19.
[52] Wambua MM, Mung’atu JK, Aduda JA, Modeling Extreme Temperature Using Extreme Value Theory: A Case Study Northern Kenya. Int. J. Data Sci. Anal, 2020; 6: 130–136.
[53] Panagoulia D, Economou P, Caroni C, Stationary and Nonstationary Generalized Extreme Value Modeling of Extreme Precipitation over a Mountainous Area under Climate Change. Environmetrics, 2015; 25: 29–43.
[54] Jenkinson AF, The frequency distribution of the annual maximum (or minimum) values of meteorological elements. Journal of the Royal Meteorological Society, 1955; 81 (348): 158–171.
[55] Gumbel EJ, Statistics of Extreme, Columbia University Press. New York, USA. 1958.
[56] Fréchet M, Sur la Loi de Probabilité de l’Écart Maximum, Ann. Soc. Polon. 1927; 6: 93–116.
[57] Weibull W, A Statistical Distribution Function of Wide Applicability. J. Appl. Mech, 1951; 18: 293–297.
[58] Stewart MG, Teply B, Králová H, The effect of temporal and spatial variability of ambient carbon dioxide concentrations on carbonation of RC structures. The 9th International Conference on Durability of Materials and Components. 2002. CSIRO, Paper 246, Brisbane, Australia, March. 17–20.
[59] Yoon IS, Çopuroğlu O, Park KB, Effect of global climatic change on carbonation progress of concrete. Atmospheric Environment, 2007; 41: 7274–7285.
[60] Kwon SJ, Na UJ, Prediction of Durability for RC Columns with Crack and Joint under Carbonation Based on Probabilistic Approach. International Journal of Concrete Structures and Materials. 2011; 5 (1). 11-18.
[61] Saassouh B, and Lounis Z, Probabilistic modeling of chloride-induced corrosion in concrete structures using first- and second-order reliability methods. Cement and Concrete Composites, 2012; 34: 1082-1093.
[62] Maeda S, Takewaka K, Yamaguchi T, Quantification of Chloride Diffusion Process into Concrete Under Marine Environment. Proc. Jpn. Soc. Civ. Engineers. 2004; 63: 109–120.
[63] Djerbi A, Bonnet S, Khelidj A, and Baroghel-bouny V, Influence of traversing crack on chloride diffusion into concrete. Cement and Concrete Research. 2008; 38 (6): 877-883.
[64] Kılıçer S, Progressive Collapse Analysis of a Reinforced Concrete Structure Using the Enhanced Local Resistance (ELR) Method: A Comparison of UFC 4-023-03 and the Turkish Earthquake Code (TEC 2018). DoğalAfetlerveÇevreDergisi. 2025; 11(2): 513–525.
[65] Pérez OFA, Arrieta VS, Ospina JHG, Herrera SH, Rojas CFR, Navarro AMS, Carbon dioxide emissions from traditional and modified concrete. A review. Environmental Development. 2024; 52: 101036.
[66] Keintjem M, Suwondo R, Cunningham L, Razak H, Embodied Carbon in Concrete: Insights from Indonesia and Comparative Analysis with UK and USA. Engineering, Technology, and Applied Science Research, 2024; 14(6): 17737-17742.
[67] Firoozi AA, Maghami MR, Life Cycle Assessment for sustainable civil infrastructure with standardized functional units and boundaries. Materials Today Sustainability, 2025; 32: 101232.
[68] Chen S, Teng Y, Zhang Y, Leung CKY, Pan W, Reducing embodied carbon in concrete materials: A state-of-the-art review. Resources. Conservation and Recycling, 2023; 188: 106653.
[69] Zhao J, Shumuye ED, Wang Z, and Bezabih GA, Performance of GGBS Cement Concrete under Natural Carbonation and Accelerated Carbonation Exposure. Journal of Engineering, 2021.
[70] Amran YM, Alyousef R, Alabduljabbar H, El-Zeadani M. Clean production and properties of geopolymer concrete, a review. Journal of Cleaner Production, 2020; 251: Article 119679.
[71] Sbahieh S, McKay G, Al-Ghamdi SG, Comprehensive Analysis of Geopolymer Materials: Properties, Environmental Impacts, and Applications. Materials, 2023; 16: 7363.
[72] Firdous R, Nikravan M, Mancke R, Assessment of environmental, economic, and technical performance of geopolymer concrete: a case study. Journal of Materials Science, 2022; 57: 18711–18725.
[73] Casanova L, Ceriani F, Messinese E, Paterlini L, Beretta S, Bolzoni FM, Brenna A, Diamanti MV, Ormellese M, Pedeferri M, Recent Advances in the Use of Green Corrosion Inhibitors to Prevent Chloride-Induced Corrosion in Reinforced Concrete. Materials, 2023; 16: 7462,
[74] Chandran D, Raviadaran R, Lau HLN, Numan A, Elumalai PV, Samuel OD, Corrosion characteristics of stainless steel and galvanized steel in water-emulsified diesel, diesel, and palm biodiesel. Engineering Failure Analysis, 2023; 147: 107129.
[75] Kušter Marić M, Ožbolt J, Balabanic G, Zhychkovska O, and Gambarelli S, Chloride Transport in Cracked Concrete Subjected to Wetting – Drying Cycles: Numerical Simulations and Measurements on Bridges Exposed to De-Icing Salts. Frontiers in Built Environment, 2020; 6: 561897.
[76] Liu QF, Hu Z, X-er. Wang, H, Zhao K, Qian L-j. Li, Meng Z, Numerical study on cracking and its effect on chloride transport in concrete subjected to external load. Construction and Building Materials, 2022; 325: 126797.
[77] Canadian Standards Association (CSA). Design of concrete structures (CSA Standard A23.3-19). CSA Group. 2019.
[78] Ministry of Housing, Utilities, and Urban Communities. Egyptian code for design and construction of concrete structures (ECP 203-2020). Housing and Building National Research Center (HBRC). 2020.
[79] ACI Committee 224. Control of cracking in concrete structures (ACI 224R-01, Reapproved 2008). American Concrete Institute. 2001.
[80] American Association of State Highway and Transportation Officials. A Policy on Geometric Design of Highways and Streets. 7th ed., AASHTO, 2018.
[81] Saudi Building Code National Committee. The Saudi Building Code: Saudi concrete structures code (SBC 304). Ministry of Municipal and Rural Affairs, Kingdom of Saudi Arabia. 2018.
[82] British Standards Institution (BSI). BS EN 1992-1-1: 2023: Eurocode 2: Design of concrete structures - General rules and rules for buildings, bridges and civil engineering structures. London: BSI. 2023.
[83] Hassaan M, Elmasry MI, and El Ashkar N. Structural Health Monitoring for Reinforced Concrete Containment Using Inner Electrical Resistivity Method. Open Journal of Civil Engineering, 2025; 11: 317-341.
[84] Hassan M, Comparative Assessment of Chloride-Induced Corrosion Probability in RC Decks Using Monte Carlo Simulation and an Approximate Algorithm Method. In: Chee, C. Y., Wang, C. (eds) Proceedings of the 9th International Conference on Materials Engineering and Nanotechnology. ICMEN 2025. Springer Proceedings in Materials, 2026; 122. Springer, Singapore.
[85] Hassan M, Experimental Evaluation of Damage Propagation in Heavyweight Concrete Members Using the Inner Electrical Resistivity Method, Engineering Research Journal (Shoubra), 2025; 55 (2): 130-140.
[86] Hassan M, Influence of Various Relative Humidity and Chloride Concentrations on Probability of Corrosion for Reinforced Concrete Members: A Review, High Technology Letters, 2025, 31 (12): 21-34.
[87] Hassan M, 2025. Evaluating the Durability of RC Bridges Under Climate Scenarios: A Study of Carbonation and Chloride-induced Corrosion. Toronto Metropolitan University. Thesis.
[88] Hassaan M, Elmasry MI, and El Ashkar NE. Effect of Impact Boeing 707-320 on External RC Containment of Nuclear Power Plant for Different Compressive Strength of Concrete. Saudi Journal of Civil Engineering. 2021; 5 (8): 282-304.
[89] Hassaan M, Elmasry MI, and El Ashkar NE. Detection of Cracks in Heavy-Weight Concrete Using Inner Electrical Resistivity Method. Saudi Journal of Civil Engineering. 2021; 5 (9): 355-366.
[90] Hassan M, Tran. Mechanical Properties of Hardened Geopolymer Concrete Mixes Including Nano Particles: A Comprehensive Review, IJRTE. 2025; 14 (3): 30–37.
Cite This Article
  • APA Style

    Hassan, M. (2026). A Review on Corrosion Mitigation Strategies for Reinforced Concrete Structures Exposed to Climate Events. American Journal of Science, Engineering and Technology, 11(3), 130-148. https://doi.org/10.11648/j.ajset.20261103.14

    Copy | Download

    ACS Style

    Hassan, M. A Review on Corrosion Mitigation Strategies for Reinforced Concrete Structures Exposed to Climate Events. Am. J. Sci. Eng. Technol. 2026, 11(3), 130-148. doi: 10.11648/j.ajset.20261103.14

    Copy | Download

    AMA Style

    Hassan M. A Review on Corrosion Mitigation Strategies for Reinforced Concrete Structures Exposed to Climate Events. Am J Sci Eng Technol. 2026;11(3):130-148. doi: 10.11648/j.ajset.20261103.14

    Copy | Download

  • @article{10.11648/j.ajset.20261103.14,
      author = {Mostafa Hassan},
      title = {A Review on Corrosion Mitigation Strategies for Reinforced Concrete Structures Exposed to Climate Events},
      journal = {American Journal of Science, Engineering and Technology},
      volume = {11},
      number = {3},
      pages = {130-148},
      doi = {10.11648/j.ajset.20261103.14},
      url = {https://doi.org/10.11648/j.ajset.20261103.14},
      eprint = {https://article.sciencepublishinggroup.com/pdf/10.11648.j.ajset.20261103.14},
      abstract = {The propagation of deterioration in vital reinforced concrete (RC) structures is a critical issue for infrastructure subjected to extreme climate change. Billions of US dollars were spent annually on the rehabilitation of RC structures. Accurate projections of future climate data for each city worldwide must consider their influence on RC members. This research will present a review of some existing RC structures exposed to CO2 and chloride-induced corrosion. Moreover, this research will discuss methods for investigating the projection of extreme climate events, providing a framework for projecting future climate data. The limit state functions for carbonation and chloride-induced corrosion are provided for various concrete sections and crack widths to predict the reliability index for assessing structural safety. This study will discuss sustainable materials and corrosion mitigation strategies to inhibit chloride- and carbonation-induced corrosion. It was deduced that a geopolymer concrete (GPC) material composed of 40% fly ash (FA) and 60% slag (SG) shows good resistance to chloride-induced corrosion compared to an ordinary Portland cement concrete mix and a GPC mix composed of 50% FA and 50% SG. Furthermore, GPC, which consists of 40% FA and 60% SG, will increase the service life of the RC structure compared to a mix composed of 50% FA and 50% SG. Finally, a crack width limitation for RC structures located in different climate regions must be assessed in various codes to adapt them to the future projection of extreme climates to reduce the risks to RC structures.},
     year = {2026}
    }
    

    Copy | Download

  • TY  - JOUR
    T1  - A Review on Corrosion Mitigation Strategies for Reinforced Concrete Structures Exposed to Climate Events
    AU  - Mostafa Hassan
    Y1  - 2026/08/17
    PY  - 2026
    N1  - https://doi.org/10.11648/j.ajset.20261103.14
    DO  - 10.11648/j.ajset.20261103.14
    T2  - American Journal of Science, Engineering and Technology
    JF  - American Journal of Science, Engineering and Technology
    JO  - American Journal of Science, Engineering and Technology
    SP  - 130
    EP  - 148
    PB  - Science Publishing Group
    SN  - 2578-8353
    UR  - https://doi.org/10.11648/j.ajset.20261103.14
    AB  - The propagation of deterioration in vital reinforced concrete (RC) structures is a critical issue for infrastructure subjected to extreme climate change. Billions of US dollars were spent annually on the rehabilitation of RC structures. Accurate projections of future climate data for each city worldwide must consider their influence on RC members. This research will present a review of some existing RC structures exposed to CO2 and chloride-induced corrosion. Moreover, this research will discuss methods for investigating the projection of extreme climate events, providing a framework for projecting future climate data. The limit state functions for carbonation and chloride-induced corrosion are provided for various concrete sections and crack widths to predict the reliability index for assessing structural safety. This study will discuss sustainable materials and corrosion mitigation strategies to inhibit chloride- and carbonation-induced corrosion. It was deduced that a geopolymer concrete (GPC) material composed of 40% fly ash (FA) and 60% slag (SG) shows good resistance to chloride-induced corrosion compared to an ordinary Portland cement concrete mix and a GPC mix composed of 50% FA and 50% SG. Furthermore, GPC, which consists of 40% FA and 60% SG, will increase the service life of the RC structure compared to a mix composed of 50% FA and 50% SG. Finally, a crack width limitation for RC structures located in different climate regions must be assessed in various codes to adapt them to the future projection of extreme climates to reduce the risks to RC structures.
    VL  - 11
    IS  - 3
    ER  - 

    Copy | Download

Author Information