Research Article | | Peer-Reviewed

Bayesian-Enhanced Deep Learning and Multi-Sensor Fusion for Spatiotemporal Analysis of Deforestation Frontiers and Landscape Structural Dynamics

Received: 5 May 2026     Accepted: 2 July 2026     Published: 28 July 2026
Views:       Downloads:
Abstract

Monitoring deforestation and forest fragmentation in tropical ecosystems remains challenging due to rapid anthropogenic pressures, understory disturbances, and the temporal limitations of conventional remote-sensing approaches dominated by annual, reflectance-based observations. This study presents an integrated spatiotemporal framework for biannual deforestation mapping in the Akure Forest Reserve (2020–2023), combining high-resolution Planet NICFI optical imagery with Sentinel-1 SAR data to enhance fine-scale temporal detection and reduce classification uncertainty. Three U-Net architectures with ResNet18, ResNet34, and ResNet50 backbones were evaluated across eight biannual datasets and benchmarked against traditional machine learning classifiers. To improve temporal coherence in SAR-derived predictions, a Bayesian updating strategy was applied. The resulting biannual maps enabled a detailed analysis of deforestation frontier dynamics through patch size distribution, patch formation speed, and spatial configuration. To characterize multiscale degradation patterns, conventional landscape metrics (Number of Patches, Patch Density, Mean Patch Size, Edge Density, Aggregation Index, and Forest Fragmentation Index) were integrated with fractal-based indicators, including Fractal Dimension and Local Connected Fractal Dimension. Results indicate that the U-Net model with a ResNet34 backbone achieved the highest classification performance (Precision = 0.9342, IoU = 0.9086), while Bayesian temporal updating further enhanced temporal stability (Precision = 0.9663, IoU = 0.9470), revealing pronounced clustering of deforestation in late 2023 (Coefficient Variation (CV) = 1.939). Fragmentation analysis reveals progressive micro-fragmentation characterized by increasing patch number and density, declining mean patch size, and persistently high local fractal connectivity, indicating intense internal forest erosion despite apparent structural stability. This structural–functional decoupling suggests that forests may remain spatially intact while undergoing substantial functional degradation. By integrating deep learning, Bayesian inference, and multiscale spatial metrics, this study provides a more sensitive and spatially explicit characterization of deforestation dynamics, offering valuable insights for geospatial analysis, conservation planning, and sustainable forest management.

Published in American Journal of Remote Sensing (Volume 14, Issue 2)
DOI 10.11648/j.ajrs.20261402.13
Page(s) 45-67
Creative Commons

This is an Open Access article, distributed under the terms of the Creative Commons Attribution 4.0 International License (http://creativecommons.org/licenses/by/4.0/), which permits unrestricted use, distribution and reproduction in any medium or format, provided the original work is properly cited.

Copyright

Copyright © The Author(s), 2026. Published by Science Publishing Group

Keywords

Deforestation Frontier, Spatiotemporal Analysis, Multi-sensor, Data Fusion, Deep Learning, Bayesian Updating, Landscape Fragmentation, Tropical Forests

1. Introduction
Forest loss frequently leads to reductions in ecosystem functioning and the provision of essential goods and services to local and regional communities . Forest change manifests in two primary forms: the conversion of forests to non-forest land cover (deforestation) and alterations in forest condition that do not involve a land-cover transition . Research that concentrates exclusively on deforestation overlooks important structural and spatial changes that shape landscape processes and ecosystem performance (Houghton 1991; Turner et al. 2001). Modifications in forest composition and configuration influence flows of energy, matter, and organisms, and thereby affect the capacity of ecosystems to deliver services . Consequently, understanding forest change at landscape scales requires assessing both the magnitude of forest cover loss and the evolution of spatial patterns in relation to land-use drivers, including climatic and socioecological factors . Decisions leading to forest conversion often involve trade-offs among ecosystem services provided by alternative land-cover types, where enhancing one service may diminish others . Forests worldwide have been increasingly threatened by climate change, as well as by the direct and indirect consequences of human activities over recent decades . Natural disturbances, particularly wildfires and severe storms, represent some of the most significant forces shaping forest ecosystem dynamics . In parallel, deforestation driven by illegal logging remains a critical anthropogenic pressure, leading to substantial losses in biodiversity, degradation of soil resources, and disruption of essential ecological processes . These growing pressures have intensified the need to examine deforestation frontiers and associated landscape dynamics in Nigeria. Deforestation frontiers describe the spatial and temporal progression of forest loss, revealing both the diverse manifestations of deforestation and the underlying drivers contributing to this change .
Deforestation patches, relatively regular, discrete areas of forest converted to non-forest, typically emerge within narrow seasonal windows rather than being uniformly distributed throughout the year . Frontier dynamics strongly influence these patterns: rapidly advancing frontiers are characterized by swift patch formation and pronounced temporal clustering, whereas slower-moving frontiers tend to produce smaller patches that appear more evenly across time. Over recent decades, substantial progress has been made in elucidating the causes, consequences, and potential mitigation strategies associated with forest landscape fragmentation . Analyses restricted to annual intervals yield only a coarse and incomplete understanding of frontier dynamics and their associated landscape structures. To resolve the spatiotemporal complexity of frontier expansion and landscape structures effectively, deforestation mapping at biannual or preferably finer temporal resolutions is increasingly essential.
Remote sensing technologies have substantially improved the efficiency and spatial reach of forest monitoring, underscoring the value of these advancements for assessing deforestation frontiers in Nigeria. Yet, persistent cloud cover in tropical forest regions remains a major constraint for optical-based monitoring, even when multiple optical datasets are combined . Consequently, many studies have historically relied on the annual Landsat-based global forest loss product . Current assessments similarly depend on annual timescales derived from forest loss products , a practice that often obscures important intra-annual variability in deforestation behavior. Emerging research from tropical forests in Brazil demonstrates that sub-monthly analyses can reveal finer-scale temporal signatures of frontier expansion that annual products fail to capture (Sun et al. 2023). The continued reliance on annual and solely optical datasets therefore risks overlooking the rapid, episodic, and spatially heterogeneous nature of deforestation processes. Integrating optical and synthetic aperture radar (SAR) data unaffected by cloud cover offers a critical pathway to improving the temporal fidelity and reliability of fragmentation and deforestation monitoring and mapping in cloud-prone regions such as Nigeria.
Planet NICFI (Norway’s International Climate and Forest Initiative NICFI) public release of high-resolution PlanetScope basemaps covering the world’s tropical regions to accelerate monitoring, reporting, and verification of forest change. Because the mosaics are produced to be spatially consistent and to minimize cloud contamination, they have been widely adopted in recent studies for fine-scale tree-cover mapping, deforestation and degradation detection, and for fusing optical and SAR observations to improve temporal and phenological robustness.
U-Net–based deep learning models demonstrated the strong potential for mapping deforested areas using monthly Sentinel-1 composites , while showed that deep learning can effectively characterize deforestation frontiers at sub-monthly temporal scales. Nonetheless, correcting errors induced by speckle noise and environmentally driven backscatter fluctuations remains a major obstacle, often resulting in reduced accuracy in dynamic deforestation mapping. To address these limitations, many studies have adopted time-series classification approaches . Yet, these methods are typically pixel-based and incorporate limited spatial context, making them less effective at capturing landscape patterns that are essential for accurately delineating deforestation patches . Spatial attributes of deforestation, such as landscape structure and patch dynamics, and temporal attributes, such as prior disturbance probabilities, provide distinct yet complementary sources of information, offering a pathway toward more robust deforestation mapping. Integrating deep learning–based spatial refinement with an advanced Bayesian temporal framework can therefore enhance mapping accuracy beyond what either approach can achieve independently, reducing uncertainties in the characterization and fragmentation of deforested areas from fusion of Planet NICFI AND Sentinel-1 data. Bayesian updating has proven valuable for mitigating temporal uncertainties in annual optical disturbance products , . By iteratively updating prior probabilities based on consistency with previously classified states, Bayesian temporal enhancement can attenuate errors driven by surface condition variability and environmental fluctuations. This enables more reliable tracking of continuous deforestation processes and improves the temporal coherence of mapped disturbance patterns.
This study introduces a novel spatiotemporal framework that combines optical and Sentinel-1 data to improve deforestation mapping and to capture the biannual dynamics of deforestation frontiers and landscape fragmentation in the Akure Forest. The research further assessed the performance of an alternative deep learning approach for enhancing the accuracy of integrated Planet NICFI and Sentinel-1 deforestation mapping over the 2020–2023 period. By combining deep learning–based spatial refinement with Bayesian temporal updating, the proposed framework improved the spatiotemporal precision of optical–SAR deforestation products and enabled robust quantification of high-resolution temporal and spatial metrics.
2. The Study Sites and Data Source
2.1. The Study Area
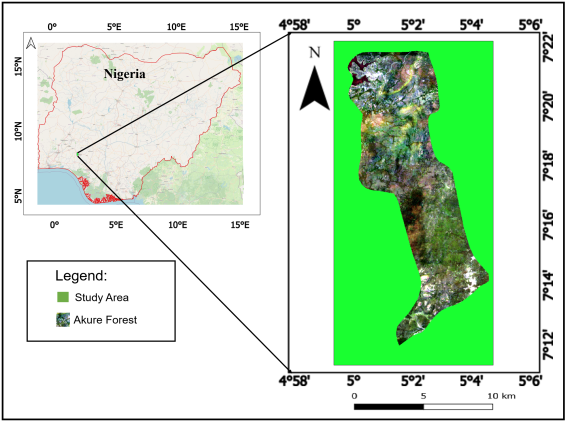
The Akure Forest Reserve is situated in Ondo State, southwestern Nigeria, within the humid tropical rainforest zone of West Africa. The reserve covers an area of approximately 66 km2 and lies between latitudes 7°10′ and 7°20′ N and longitudes 5°05′ and 5°15′ E . It represents one of the remaining patches of lowland rainforest in the region, characterized by dense vegetation, multilayered canopy structure, and diverse flora and fauna. The mean annual temperature ranges from 25°C to 27°C, while the annual rainfall varies from 1,500 mm to 2,500 mm, with a distinct wet season from April to October and a dry season from November to March. Relative humidity remains high throughout the year, typically exceeding 75% during the rainy season . Vegetation in the reserve consists predominantly of moist semi-deciduous forest, featuring tree species such as Triplochiton scleroxylon, Milicia excelsa, Celtis zenkeri, and Terminalia superba.
Figure 1. Location of the study Area in Nigeria.
2.2. Data Source
This study utilized multi-sensor Earth observation data from the Sentinel and Planet NICFI programs to support high-resolution deforestation monitoring. Sentinel-1 C-band SAR imagery and Sentinel-2A multispectral data from the European Space Agency (ESA) were employed to provide complementary radar and optical information. Sentinel-1 data were preprocessed using standard procedures, including orbit correction, noise removal, radiometric calibration, and terrain correction . To minimize geometric distortions and improve backscatter consistency, both ascending and descending orbit acquisitions in Interferometric Wide Swath (IW) mode were incorporated . Dual-polarization VV and VH bands were combined with the VV/VH ratio to generate enhanced three-layer composites for improved deforestation characterization. Additionally, high-resolution Planet NICFI optical imagery derived from the PlanetScope Dove constellation was integrated to capture detailed tropical forest dynamics. The Planet NICFI datasets provide 4.77 m spatial resolution cloud-minimized mosaics with near-daily revisit capability, enabling the detection of subtle forest disturbances such as canopy openings, skid trails, and selective logging . Six bi-annual mosaics covering wet and dry seasons between 2020 and 2023 were acquired through Google Earth Engine. Residual cloud contamination was further reduced using custom masking techniques . To optimize deep learning performance, the surface reflectance data were normalized to a range and converted to 8-bit format using min–max normalization, a preprocessing strategy commonly applied in U-Net-based remote sensing applications.
2.3. Integration of Sentinel-1 SAR and Planet NICFI Optical Imagery
Sentinel-1 SAR (VV, VH, and VV/VH ratio) and Planet NICFI optical imagery (Blue, Green, Red, NIR bands) were integrated to exploit complementary information from both sensors. SAR captures structural and moisture-sensitive signals, while optical imagery provides spectral reflectance related to vegetation condition. Co-registration: All datasets were geometrically aligned to a common reference grid (EPSG: 4326) using feature-based matching and polynomial warping. Visual inspection and quantitative assessment confirmed sub-pixel alignment (<0.5 pixels), ensuring accurate pixel-level correspondence between SAR and optical data. Resampling: To harmonize spatial resolution, Planet NICFI imagery (4.77 m) was downsampled to 10 m to match Sentinel-1 SAR. This approach preserves the native SAR signal fidelity and avoids artificially interpolating SAR backscatter, which could introduce noise and redundancy without adding meaningful spatial information. Bilinear interpolation was applied to optical bands, while nearest-neighbor interpolation was used for any categorical indices. All datasets were cropped to the study area extent. Multi-channel Stack Generation: Co-registered and resampled layers were combined into a single multi-channel raster stack. Optical bands were normalized to zero mean and unit variance, and SAR backscatter values were scaled to . Missing or cloud-contaminated pixels were masked to prevent artifacts during U-Net training. This integration preserves both spectral and structural information from the optical and SAR sensors, enabling the U-Net model to leverage complementary features for accurate detection of forest disturbances.
3. Methodology
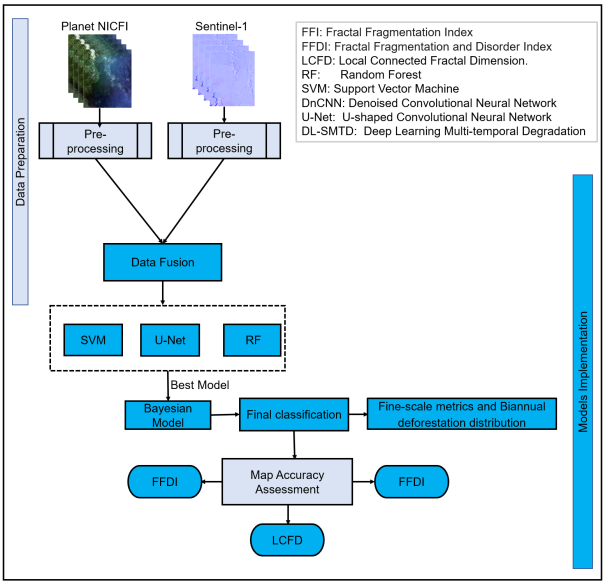
This study proposes a comprehensive spatio-temporal deep learning framework for deforestation monitoring by integrating Sentinel-1 SAR and Planet NICFI optical imagery with seasonal adaptation Figure 2.
Figure 2. Schematic of the fragmentation and deforestation mapping method workflow.
3.1. Support Vector Machines
The Support Vector Machine (SVM) algorithm is a widely adopted supervised learning method in remote sensing due to its strong generalization capacity, robustness to high-dimensional data, and effectiveness with limited training samples . SVM operates primarily within the spectral domain. Temporal information can therefore be incorporated by concatenating multi-temporal images into a single spectral feature space. In this study, the SVM classifier employed a Radial Basis Function (RBF) kernel, which is particularly effective for modeling nonlinear relationships between spectral features. The algorithm requires two key hyperparameters: the cost (C) parameter, which controls the penalty for misclassification, and sigma (σ), which defines the kernel width and influences the decision boundary’s smoothness. Here, the cost parameter was set to C = 1, while σ was determined automatically using a data-driven heuristic optimization approach . To address potential class imbalance, the training dataset was constructed by randomly subsampling pixels per class such that the number of samples equaled that of the rarest class (e.g., deforest and forest). This ensured balanced representation and minimized classification bias. Because SVM is a pixel-based classifier, the resulting per-pixel predictions were directly used to assess performance on the validation and test datasets without the need for additional spatial post-processing.
3.2. Random Forest
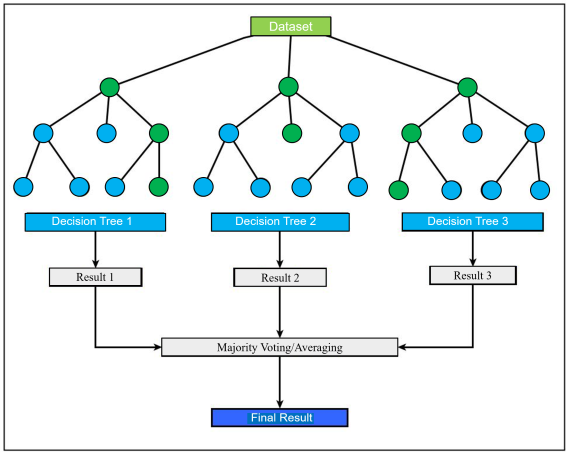
The Random Forest (RF) algorithm, proposed by , is an ensemble machine learning method that combines bootstrap aggregating (bagging) and random feature selection to improve classification accuracy and reduce overfitting. It builds multiple decision trees from bootstrap samples of the training data, with each using a random subset of predictor variables at each node split, as shown in Figure 3. The final prediction is determined by majority voting across all trees, ensuring model robustness and generalization. About one-third of the training data is excluded from each bootstrap sample, called out-of-bag (OOB) data, and is used to internally estimate classification error and assess variable importance. The algorithm’s accuracy depends on both the correlation among individual trees and their predictive power, with an optimal balance between these factors minimizing the overall error rate . RF also provides a quantitative measure of variable importance by evaluating the change in OOB classification accuracy when individual predictors are randomly permuted . This feature makes RF especially useful for identifying key variables influencing spatial or spectral patterns in remote sensing datasets. In this study, the Random Forest algorithm was implemented in Python using the Random Forest package to classify the fusion of Sentinel-1 SAR and Planet NICFI optical imagery.
Figure 3. Architecture Random Forest Model.
3.3. U-Net Architecture
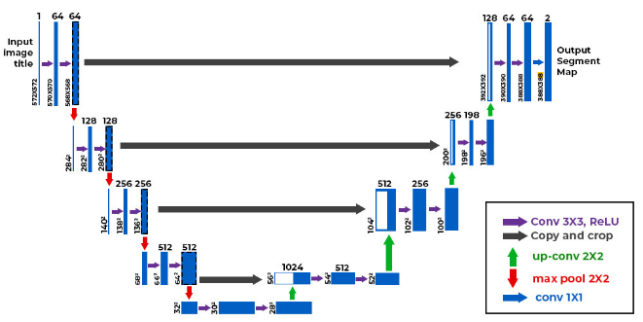
The U-Net architecture is a convolutional neural network (CNN) specifically developed for pixel-wise image segmentation and widely applied in remote sensing tasks such as land cover classification, deforestation monitoring, and change detection . Its encoder–decoder structure enables efficient extraction of high-level semantic features while preserving precise spatial information. The encoder progressively downsamples the input image through convolution and pooling operations to capture contextual representations, whereas the decoder restores spatial resolution through upsampling while integrating fine-scale details via skip connections. These skip connections are a key strength of U-Net, allowing accurate delineation of complex features such as forest boundaries and deforested areas. The final layer generates segmentation outputs for target classes such as forest and non-forest, with training commonly optimized using loss functions such as binary cross-entropy and optimizers like Adam. Due to its fully convolutional design, U-Net can process images of varying sizes and performs effectively even with limited training data, making it highly suitable for Earth observation and multi-sensor remote sensing applications .
Figure 4. U-Net Architecture diagram.
3.4. Model Performance Evaluation
A suite of widely recognized performance metrics, including Overall Accuracy, Precision, Recall, F1 Score, and Intersection over Union (IoU), was used to evaluate the classification performance of the U-Net models with ResNet-18, ResNet-34, and ResNet-50 backbones. The metric definitions align with those presented in and other foundational studies. Because both F1 Score and IoU quantify the relationship between correctly classified pixels and classification errors, they are particularly informative and strongly correlated when applied to binary deforestation mapping.
Precision= TPTP+FP(1)
Overall Accuracy= TP+TNTP+FP+TN+FN(2)
Recall= TPTP+FN(3)
F1 Score= 2UAPAUA+PA(4)
IoU= F12-PF1(5)
Where TP is true positives, TN represents true negatives, FP is false positives, and FN denotes false negatives.
3.5. Bayesian Temporal Refinement Framework
The trained U-Net models with a ResNet-34 backbone were employed to generate deforestation maps for the study sites. Once the classified maps were chronologically ordered, the Bayesian Updating of Land-Cover (BULC) algorithm was applied across the full historical series. This approach improves the robustness of deforestation detection by integrating temporal information, thereby reducing sensitivity to short-term fluctuations in the data. Initially developed to iteratively update land-cover classifications using long sequences of classified images, BULC enables more consistent and reliable tracking of deforestation dynamics over time . The BULC algorithm leverages Bayes’ theorem to iteratively update the probabilities of land-cover classes, producing stable and temporally continuous predictions. In this study, applying BULC enabled the reconstruction of a continuous sequence of deforestation events, effectively correcting classification errors and inconsistencies across the time series. The methodology for updating the deforestation probability of each pixel is presented in Equations (6) and (7). Specifically, when a new observation of a land-cover class c2 is obtained at time i+1, the posterior probability of the true class D corresponding to land cover c1 is calculated as follows:
PDc1,i+1Ec2,i= PEc2,i+1Ec1,i*P(Dc1,i)n=1,2PEc2,i+1Ecn,i*P(Dcn,i)(6)
PDc2,i+1Ec1,i= PEc2,i+1Ec1,iPEc1,i(7)
c1 and c2 represent the land-cover categories from the classified deforestation maps, and i. denotes the index of an event within the sequence of classified maps. The term P(Dc1,i) refers to the probability of a pixel belonging to land-cover class c1 at event i. PDc2,i+1│Ec1,i represents the probability that a pixel is classified as class c2 in Event i+1 given that it was previously classified as c1 in Event i. Similarly, PEc2,+1Ec1,i denotes the joint probability of a pixel being classified as c1 in Event i and c2 in Event +1. For the initial probability assignment, non-deforested pixels were set to 0.6 and deforested pixels to 0.4 .
3.6. Spatial–Temporal Patterns of Forest Loss
Based on the deforestation maps produced by the optimized methodology, we conducted a comprehensive analysis of deforestation frontiers across all study sites, employing detailed fine-scale spatial–temporal metrics . Eight distinct spatial–temporal maps were systematically generated to enable characterization at a biannual resolution, representing a novel aspect of this study. While some previous studies have employed monthly temporal analyses . This research emphasizes biannual characterization, which was implemented in ArcGIS Pro using a range of tools available within the Geospatial Analyst toolbox. To extract patch-level information, the deforestation maps were first converted from raster to polygon format in ArcGIS Pro, creating shapefiles that enabled calculation of patch metrics, including formation speed and patch size. Deforestation patterns were analyzed for each map by summarizing the distributions of patch size and formation speed, as defined in Equation (8). Subsequently, each study site was subdivided into 5 km2 hexagonal grids, and deforestation within each grid was aggregated using zonal statistics. The results were further categorized according to patch size and formation speed. Finally, the temporal distribution of deforestation was quantified on a biannual basis, and temporal clustering was assessed using the coefficient of variation (CV) index .
Forming speed= patch sizeDoyend-Doystart(8)
CV= StdMean D(9)
Where Doyend is the day of each year of the last forming date (e.g., the leap year: June 30 = 182, December 31 = 366, non-leap: June 30 = 181, December 31 = 365), Doystart denoted the day of each year of the start forming date (e.g., Leap year: January 1 = 1, July 1 = 182, non-leap year: January 1 = 1, July 1 = 182), Std is the standard deviation of deforested region in each observation interval and mean D is the mean of deforested region in each observation interval.
3.7. Landscape Structure and Fragmentation Analysis
Forest and deforestation fragmentation metrics are essential for quantifying landscape dynamics, assessing habitat degradation, and supporting conservation planning. Conventional metrics such as Number of Patches, Patch Density, Edge Length, Mean Patch Size, Aggregation Index, and Core Area Index are widely used to characterize spatial forest structure . However, these traditional metrics are often limited by scale sensitivity, static analysis capability, reliance on binary classifications, and inadequate representation of functional connectivity and edge dynamics. They may also struggle to effectively capture temporal fragmentation processes and large-scale landscape complexity. To address these limitations, this study integrated traditional fragmentation metrics with advanced fractal-based indicators, including the Fractal Fragmentation Index (FFI), Fractal Fragmentation and Disorder Index (FFDI), and Local Connected Fractal Dimension (LCFD) . These fractal metrics provide enhanced characterization of structural complexity, connectivity, and fragmentation dynamics across multiple spatial scales. The analysis was implemented in ArcGIS Pro using classified multi-temporal datasets to quantify changes in forest fragmentation and deforestation patterns over time.
3.7.1. Fractal Fragmentation Index
The Fractal Fragmentation Index (FFI) is a quantitative metric used to assess the degree of fragmentation and the compactness of spatial objects. It evaluates the extent to which the shape of each object deviates from an idealized Euclidean geometry . FFI is calculated using multi-scale fractal analysis and is formally expressed in Equation (10).
FFI = DA -DP= limε0logNεlog1ε- limε0logN'εlog1ε(10)
DA represents the box-counting fractal dimension of object areas, DP the fractal dimension of their perimeters, and ε denotes the box size. log N(ε) and log N′(ε) correspond to the counts of non-overlapping boxes required to cover areas and perimeters, respectively.
3.7.2. Fractal Fragmentation and Disorder Index (FFDI)
The Fractal Fragmentation and Disorder Index (FFDI) is a fractal-based metric that utilizes multi-scale fractal methods to quantify both the degree of fragmentation (or compactness) and the spatial disorder of objects within a given area . FFDI extends the Fractal Fragmentation Index (FFI) by incorporating the Information Dimension (D1) , enabling differentiation of complex spatial organization patterns. The computation of FFDI is based on the formulation presented in Equation (11).
FFDI =  limε0i=1Nεmiεlogmiεlogε1-limε0logNεlog1ε- limε0logN'εlog1ε(11)
In this formulation, mi = Mi/M, where Mi is the number of points in the ith box, and M is the total number of points for the object. In this study, all fragmentation indices were computed using ArcGIS Pro, Raster Calculator, and Python, with conventional GIS techniques employed for cartographic representation and Python and Excel utilized for data visualization and analysis.
3.7.3. Local Connected Fractal Dimension (LCFD)
The Local Connected Fractal Dimension (LCFD) is a fractal-based metric designed to quantify local connectivity within spatial objects. Its computation is defined by Equations (12) and (13).
MεαFεLCFD(12)
LCFD= logMεlogε(13)
F represents a mass pre-factor, and (𝜀) denotes the number of locally connected pixels within a box of size 𝜀.
4. Results
This section presents the results of deforestation mapping and landscape analysis in the Akure Forest, Nigeria, demonstrating the segmentation of deforested and non-deforested areas from satellite imagery. It details the characterization of deforestation patches, including patch size and formation speed, within the context of deforestation frontier dynamics, using fine-scale spatial–temporal metrics. The outcomes of each analytical step are reported to illustrate the performance of the proposed methodological framework.
4.1. Evaluating Deep Learning Backbones for Deforestation
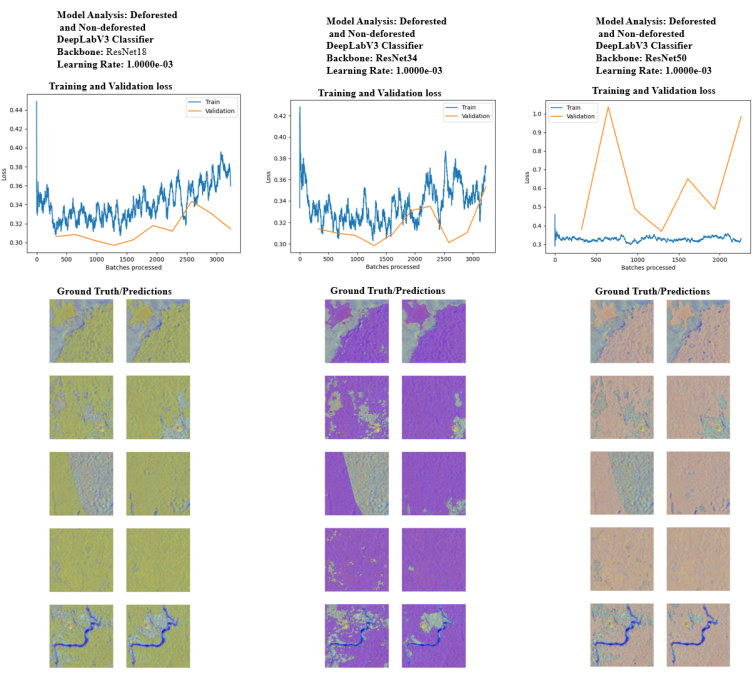
The assessment accuracy metrics of the models were compared to identify the most suitable framework for deforestation mapping, as summarized in Table 1. Widely recognized deep learning models, including U-Net, were selected due to their proven efficiency in pixel-level classification and segmentation. Three backbone architectures, ResNet-18, ResNet-34, and ResNet-50, were implemented based on available computational resources to evaluate their performance in detecting deforested and non-deforested areas across the study area. Results indicated that the U-Net with the ResNet-34 backbone achieved the highest precision, recall, F1 score, and Intersection over Union (IoU), demonstrating superior segmentation performance. All models were trained and tested on the same fused Planet NICFI Sentinel-1 SAR dataset for Nigeria, which included automatically annotated deforested and non-deforested polygons. Figure 5 presents the comparative performance of the three backbones with U-Net models, highlighting U-Net with ResNet-34 as the best-performing configuration. This analysis underscores the robustness and effectiveness of the U-Net architecture with ResNet-34 in the accurate detection and segmentation of deforestation.
Table 1. Accuracy assessment metrics and their comparison.

Metrics

U-Net- ResNet18

U-net- ResNet34

U-net- ResNet50

Precision

0.864122

0.865394

0.868548

Recall

0.945011

0.945451

0.925525

F1-Score

0.902758

0.903653

0.896132

IoU

0.74002

0.741925

0.73353

Figure 5. Analysis of the U-Net Model with different Backbones for segmentation.
4.2. Evaluation of the Enhanced Spatial–Temporal Framework
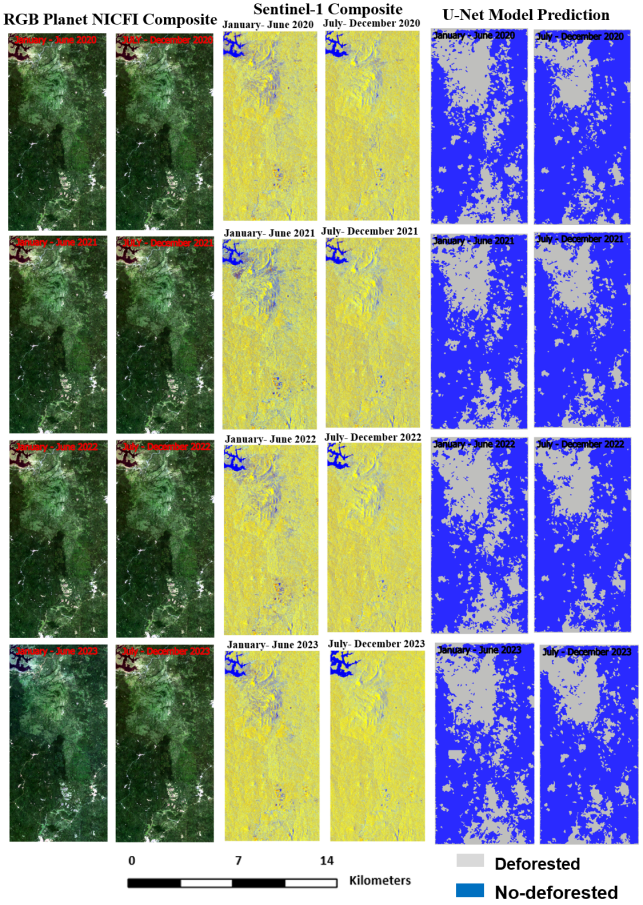
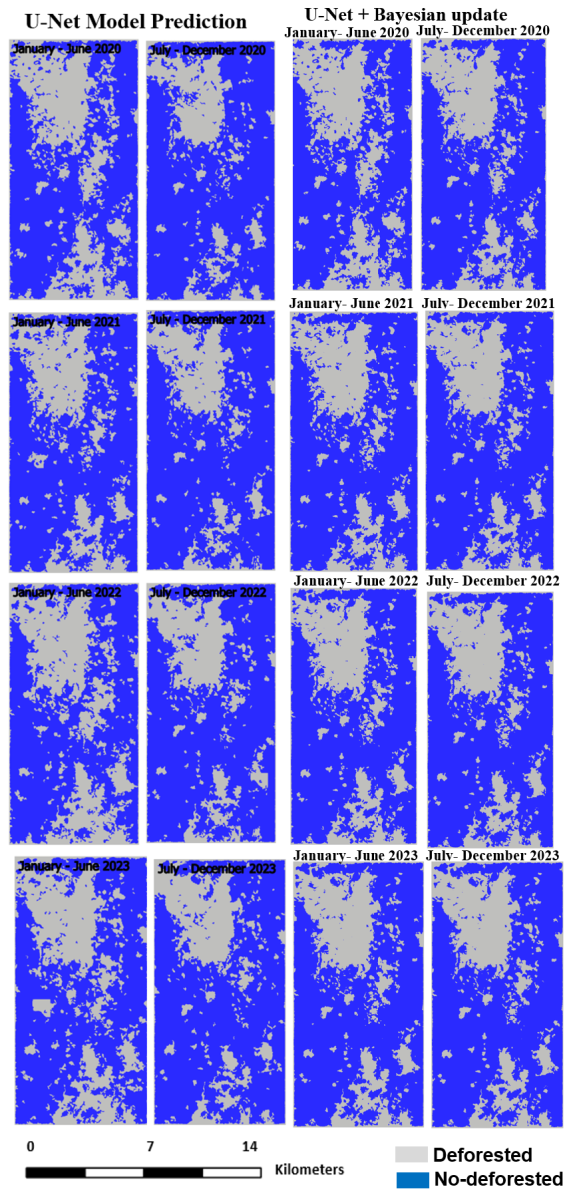
Accuracy assessment results identified the U-Net model with a ResNet-34 backbone as the most effective approach for deforestation mapping, outperforming Random Forest (RF), Support Vector Machine (SVM), and other U-Net configurations across all evaluation metrics (Table 2). The model was applied to fused Planet NICFI and Sentinel-1 datasets and demonstrated superior capability in distinguishing deforested and non-deforested areas compared with RGB Planet imagery, individual Sentinel-1 VV, VH, and VV/VH bands, and the standard U-Net architecture (Figure 6). Performance evaluation using 10-fold cross-validation confirmed the robustness and reliability of the U-Net_ResNet34 model. Further enhancement was achieved by integrating the U-Net_ResNet34 model with a Bayesian temporal updating framework, which improved the temporal consistency and stability of sequential deforestation predictions. This integration resulted in significant improvements in precision, recall, F1-score, and Intersection over Union (IoU), yielding the highest overall classification performance for deforestation monitoring. The resulting classification maps for 2020–2023 effectively captured temporal deforestation dynamics and demonstrated the model’s capability for accurate long-term monitoring (Figure 7).
Table 2. 10-fold Validation Model Results and Comparison.

Metrics

Random Forest (RF)

Supporting Vector Machine (SVM)

U-net- ResNet34

Precision

0.9146

0.9262

0.9342

Recall

0.9130

0.9173

0.9333

F1-Score

0.9110

0.9208

0.9322

IoU

0.8836

0.8942

0.9086

Figure 6. Comparison of RGB Composite Planet, Sentinel-1, and U-Net of Akure Forest.

Metrics

U-Net (ResNet-34)

U-Net (ResNet-34) + Bayesian

U-net- ResNet50

Precision

0.9342

0.9665

0.868548

Recall

0.9333

0.9661

0.925525

F1-Score

0.9322

0.9660

0.896132

IoU

0.9086

0.9470

0.73353

Figure 7. Comparison of U-Net and U-Net + Bayesian Update Akure Forest.
4.3. Spatio-Temporal Assessment of Deforestation Frontiers
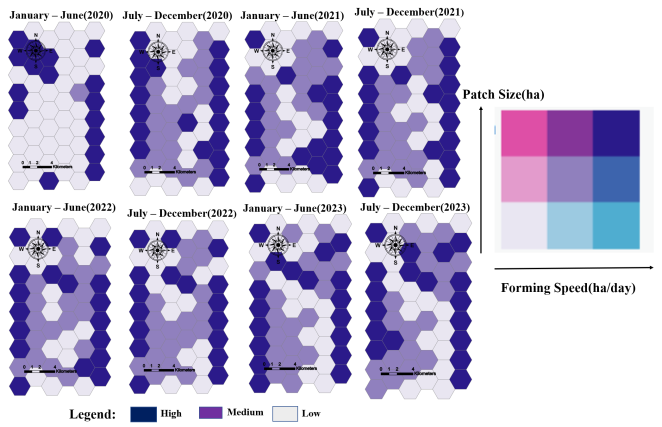
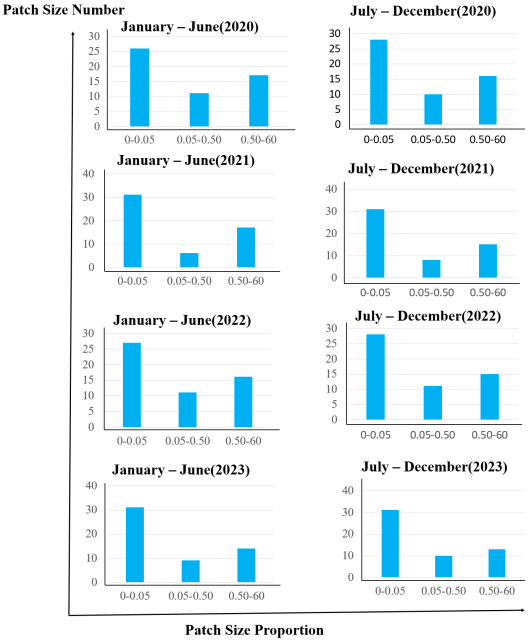
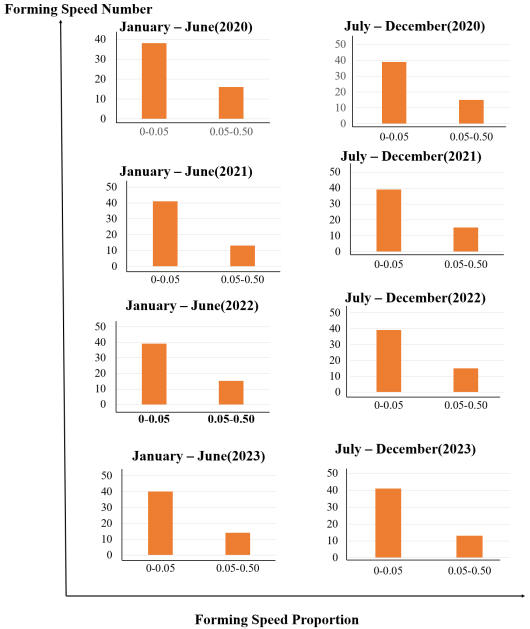
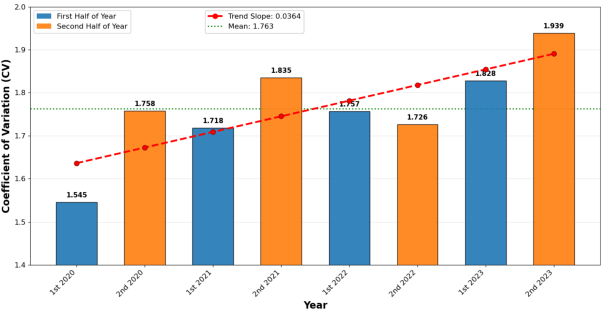
Advanced spatio-temporal techniques integrating all available Sentinel-1 acquisitions were used to generate biannual deforestation maps for 2020–2023 (Figure 7), providing a more detailed temporal representation of forest disturbance than conventional annual products. Localized zoom-in analyses further revealed substantial spatial variability in patch size, configuration, and timing across the Akure Forest landscape (Figure 8). Deforestation patches were categorized according to patch size and formation speed, and their biannual spatial distributions are presented in Figs. 9 and 10. Results show that the majority of deforestation events were dominated by small-scale patches (≤0.05 ha) and slow expansion rates (<0.05 ha/day), indicating that incremental and dispersed forest loss was the predominant frontier pattern throughout the study period. Despite the dominance of small disturbances, some large and rapidly expanding patches contributed disproportionately to total deforested area, emphasizing the ecological significance of high-intensity deforestation events. Temporal analysis further demonstrated increasing aggregation of deforestation activity over time. The coefficient of variation (CV) analysis revealed that the second half of 2023 experienced the highest temporal clustering of deforestation events (CV = 1.939), while the first half of 2020 exhibited the lowest clustering intensity. The progression of CV values across the study periods is illustrated in Figure 11.
Figure 8. Deforestation patch size and forming speed in Akure are mean values within 5km2 hexagon grids.
Figure 9. Patch size (ha) Distribution of Akure Forest.
Figure 10. Patch forming speed (ha/day) Distribution of Akure Forest.
Figure 11. Biannual Coefficient of Variation (CV) Analysis with Trend of Akure Forest.
4.4. Landscape Dynamics and Fragmentation Analysis
4.4.1. Fractal Dimension Analysis of Landscape Structure
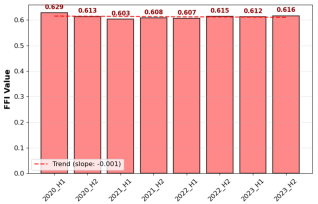
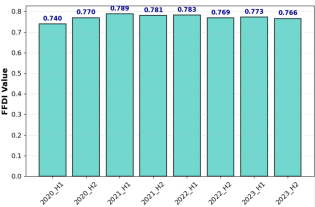
The results show that the Akure forest remained structurally stable from 2020 to 2023. The Forest Fragmentation Index (FFI) showed only small changes (0.603–0.629), with a very weak downward trend, indicating little overall change in forest connectivity (Figure 12). The Forest Fragmentation and Degradation Index (FFDI) also stayed consistently high (0.740–0.789), showing that fragmentation levels remained severe but stable over time (Figure 13).
Figure 12. FFI of Akure forest (2020 – 2023).
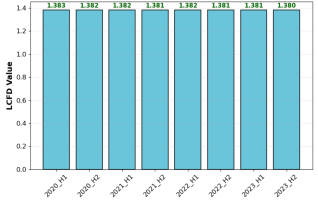
The Local Connected Fractal Dimension (LCFD) was nearly constant (1.380–1.383), showing that forest boundary complexity did not change much across the study period (Figure 14). Overall, these metrics indicate that the forest stayed in a long-term stable but highly fragmented condition, with only very gradual and minor structural change over time.
Figure 13. FFDI of Akure forest (2020 – 2023).
Figure 14. LCFD of Akure forest (2020 – 2023).
4.4.2. Comparison of Fractal Metrics for Forest Fragmentation
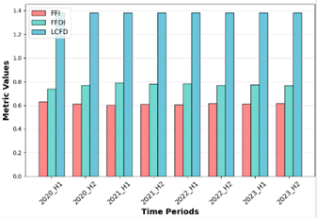
The results (Figure 15) show that the Akure forest remained highly fragmented but structurally stable from 2020 to 2023. The Forest Fragmentation Index (FFI) stayed consistently high (around 0.615), meaning more than 60% of the landscape was continuously fragmented or edge-dominated. The Forest Fragmentation Development Index (FFDI) stabilized at about 0.77–0.78 after a small initial increase, indicating a persistently severe but steady fragmentation pattern. The Local Connected Fractal Dimension (LCFD) also remained nearly constant (around 1.39–1.40), showing that forest boundary complexity did not change significantly over time. Overall, the metrics in Figure 15 suggest that after an initial adjustment phase, the forest reached a long-term stable but highly fragmented state, with no clear seasonal variation in fragmentation dynamics.
Figure 15. Comparison of fractal metrics of Akure forest (2020 – 2023).
4.4.3. Analysis of Landscape Structure Using Traditional Metrics
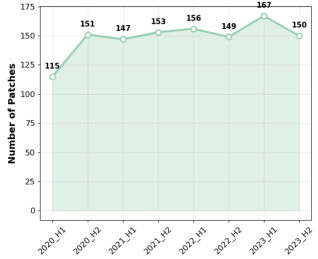
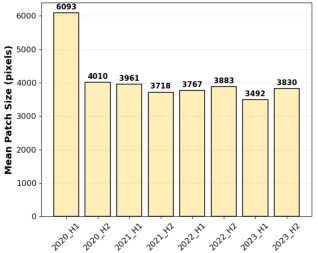
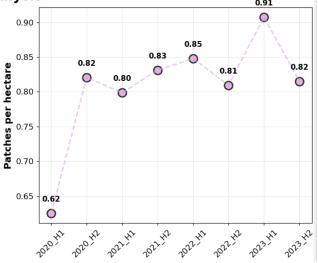
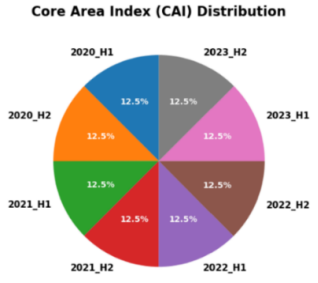
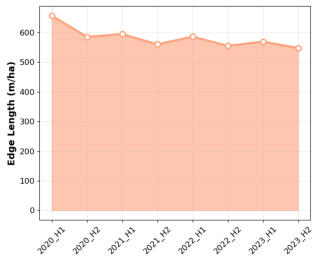
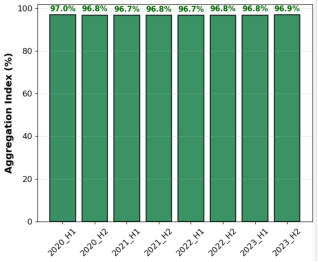
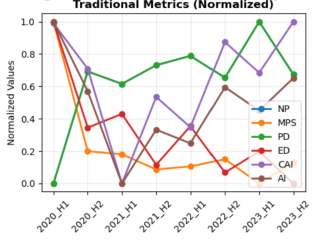
The temporal analysis of traditional landscape metrics shows that the Akure forest experienced continuous micro-fragmentation from 2020 to 2023. The Number of Patches (NP) increased from 115 to 150, peaking at 167 in 2023_H1, indicating ongoing subdivision of the forest into smaller fragments (Figure 16). At the same time, Mean Patch Size (MPS) decreased by about 37%, showing that large forest areas were steadily broken into smaller patches (Figure 17). A slight increase in MPS in 2023_H2, along with a drop in NP, likely reflects loss of small patches rather than true recovery. Patch Density (PD) also increased, reaching its highest level in 2023_H1, confirming stronger fragmentation over time (Figure 18). Edge Length Density (EL) remained high with only slight variation, indicating continued exposure to edge effects (Figure 19). Meanwhile, Core Area Index (CAI) stayed stable, suggesting proportional loss of core habitat, and the Aggregation Index (AI) remained very high (~97%), showing that patches remained clustered rather than fully isolated (Figures 20–21). Overall, the results indicate ongoing internal forest degradation while the broader spatial structure appears relatively stable.
Figure 16. Number of Patches of Akure forest (2020 – 2023).
Figure 17. Mean Patch Size of Akure forest (2020 – 2023).
Figure 18. Patches per Hectare of Akure forest (2020 – 2023).
Figure 19. Edge Length of Akure forest (2020 – 2023).
Figure 20. Core Area Index of Akure forest (2020 – 2023).
Figure 21. Aggregation Index of Akure forest (2020 – 2023).
4.4.4. Comparison of Traditional Metrics for Forest Fragmentation
The results show a clear difference between stable overall forest structure and changing internal fragmentation in the Akure forest from 2020 to 2023. Geometric metrics (FFI, FFDI, LCFD, and AI) remained consistently stable throughout the period. This indicates that the forest stayed highly fragmented, with persistent edge dominance, complex patch shapes, and strong clustering of remaining forest areas. Overall, the large-scale structure did not change much, even though fragmentation remained severe.
Figure 22. Comparison of Traditional metrics of Akure forest (2020 – 2023).
In contrast, patch-level metrics showed strong changes over time. The Number of Patches (NP) and Patch Density (PD) increased and peaked in 2023_H1, while Mean Patch Size (MPS) decreased, showing that the forest was continuously breaking into smaller fragments. Edge Length Density (EL) stayed high, confirming ongoing exposure to edge effects. In 2023_H2, NP and PD decreased while MPS increased, likely due to the loss of smaller fragments rather than real recovery. The Core Area Index (CAI) remained stable, meaning core habitat declined proportionally with overall forest loss. Overall, the forest shows a stable large-scale structure but continuous internal micro-fragmentation and degradation over time.
4.4.5. Comparative Analysis of Fractal and Traditional Metrics (Radar Chart)
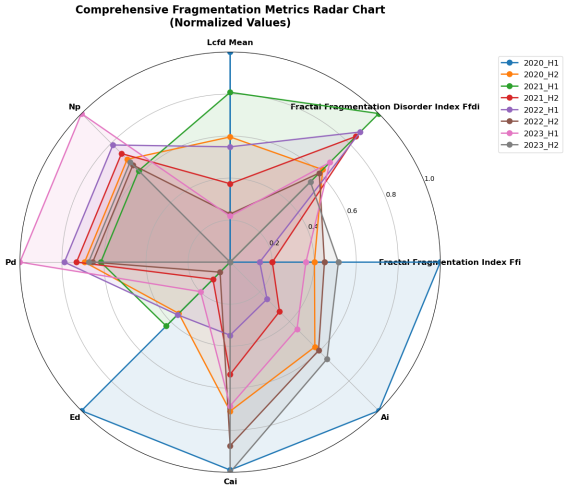
The fragmentation analysis of the Akure forest over 2020_H1 to 2023_H2 shows a clear contrast between stable overall structure and highly variable internal changes (Figures 23 and 24). Geometric metrics (FFI, FFDI, LCFD, and AI) remained consistently stable throughout the study period. FFI and FFDI indicate that over 60% of the landscape remained fragmented, while LCFD showed consistently complex patch boundaries and AI confirmed that forest patches stayed highly clustered. Overall, these results suggest a stable large-scale structure despite ongoing fragmentation. In contrast, patch-level metrics showed strong and non-linear changes. The Number of Patches (NP) and Patch Density (PD) increased significantly, peaking in 2023_H1, while Mean Patch Size (MPS) declined sharply, indicating increasing micro-fragmentation. Although Edge Length Density (ED) varied less, it remained high, reflecting continuous edge pressure. The Core Area Index (CAI) showed proportional stability but still reflected pressure on interior habitats. The final period (2023_H2) showed a coordinated shift, with NP and PD decreasing and MPS increasing, suggesting short-term patch consolidation or loss of smaller fragments after peak fragmentation in 2023_H1. Overall, the results reveal a stable forest structure at the landscape level but strong internal fragmentation dynamics at the patch level.
Figure 23. General comparison of fractal and Traditional Metrics.
4.4.6. Comparative Analysis of Fractal and Traditional Metrics (Heatmap)
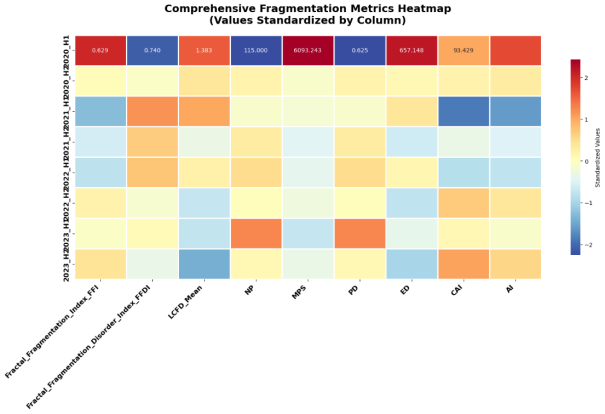
The fragmentation analysis of the Akure forest (2020_H1–2023_H2) reveals a clear contrast between stable overall structure and highly dynamic internal changes. Geometric metrics (FFI, FFDI, LCFD, and AI) remained consistently stable throughout the period, indicating that more than 60% of the landscape stayed fragmented or edge-dominated. LCFD showed almost no change, while AI remained high (~97%), confirming strong patch clustering despite ongoing fragmentation. Together, these results show that the forest has reached a stable but severely fragmented structural state. In contrast, patch-level metrics showed strong temporal variation. The Number of Patches (NP) increased by 30.4%, peaking in 2023_H1, while Patch Density (PD) followed the same trend. Mean Patch Size (MPS) decreased by 37.1%, reaching its lowest value in 2023_H1, indicating intense micro-fragmentation. Edge Length Density (ED) declined slightly but remained relatively high overall. Overall, 2023_H1 represents the peak fragmentation period, with the highest NP and PD and the lowest MPS. The results show a stable large-scale forest structure but strong internal fragmentation dynamics over time.
Figure 24. Correlation between Fractal and Traditional Fragmentation Metrics.
5. Discussion
This study develops a simple and effective method for mapping deforestation by combining Planet NICFI optical images and Sentinel-1 radar data. It uses a deep learning model (U-Net with ResNet34) to improve spatial detail and a Bayesian approach to make the results more consistent over time, reducing errors from radar noise and temporal variation. Applied to the Akure Forest (2020–2023), the method produced accurate biannual deforestation maps and allowed detailed analysis of patch size, formation speed, and timing of deforestation events. Results show that most deforestation occurred in small, slow-forming patches with fairly regular timing across periods. Overall, the approach provides more accurate and detailed deforestation information than existing global products and improves understanding of how forest loss changes over time.
5.1. Spatiotemporal Dynamics of Forest Deforestation Frontiers
This study highlights the importance of fine-scale temporal information such as initiation timing, patch formation speed, and event clustering to better understand deforestation frontiers. Unlike earlier studies in Africa that rely on coarse, multi-year datasets (often 5–10 years) and , this work uses biannual Sentinel-1–based mapping (2020–2023), enabling much more detailed tracking of forest change. Compared with previous approaches using 30 m Global Forest Change data aggregated to large grid scales, this framework captures smaller and rapidly evolving deforestation events that are often missed by coarse-resolution products. This is particularly important in Nigeria, where weak enforcement leads to widespread small-scale clearing. High-resolution temporal monitoring also improves understanding of impacts on biodiversity loss, carbon emissions, and seasonal ecosystem variability . The study integrates deep learning (U-Net with ResNet34) with a Bayesian temporal model to improve mapping accuracy. Deep learning enhances spatial feature extraction and reduces speckle noise, while the Bayesian approach improves temporal consistency and reduces classification errors in time-series SAR data . Together, they enable more reliable detection of small and newly formed deforestation patches. This framework also has strong operational value for forest management, supporting early warning systems, illegal logging detection, and policy-relevant monitoring aligned with management cycles. It can also be integrated with existing satellite-based monitoring systems to improve detection speed and spatial precision . Overall, this is the first study in Nigeria to apply biannual deep learning–based Sentinel-1 mapping for high-resolution characterization of deforestation dynamics, providing improved insights for forest monitoring, planning, and conservation decision-making.
5.2. Performance of Fractal-Based Metrics
The fractal-based metrics indicate that the Akure Forest maintained a generally stable fragmentation state between 2020 and 2023, with no evidence of abrupt or large-scale structural collapse. The Forest Fragmentation Index (FFI) showed only minor fluctuations, suggesting that overall fragmentation levels remained largely consistent over time. A slight decline in early 2021 likely reflects localized human disturbances such as selective logging or small-scale agricultural expansion, followed by stabilization that may indicate temporary recovery or reduced pressure . Similarly, the consistently high Forest Fragmentation and Degradation Index (FFDI) values suggest that the forest remained in a persistently fragmented but relatively stable condition, where degradation processes were ongoing but spatially limited and partially offset by natural regeneration . This pattern reflects a form of structural equilibrium under continuous but moderate disturbance. The Local Connected Fractal Dimension (LCFD) further supports this interpretation. Its stable mean value (~1.381) indicates moderate but persistent boundary complexity, with highly irregular forest edges typical of fragmented landscapes rather than simple, human-cleared boundaries . The slight long-term decline in LCFD suggests a gradual simplification of forest edges, potentially driven by edge erosion and incremental land-use pressure rather than abrupt clearing events . Overall, the combined behavior of FFI, FFDI, and LCFD shows that the forest is not undergoing rapid fragmentation, but is instead locked in a persistent state of structural equilibrium characterized by long-term, low-intensity anthropogenic pressure . While the landscape remains fragmented and largely edge-dominated . At the same time, the stable and relatively high LCFD values imply that fragmentation processes are occurring gradually through irregular edge modifications rather than abrupt landscape transformation , the gradual changes in fractal complexity suggest a slow but continuing loss of structural integrity. If sustained, this trend may progressively reduce habitat connectivity and ecological stability .
5.3. Performance of Traditional Landscape Metrics
The traditional landscape metrics collectively reveal that the Akure forest is undergoing severe and persistent structural fragmentation characterized by progressive habitat degradation and declining ecological integrity. The substantial increase in the Number of Patches (NP) and Patch Density (PD) indicates continuous micro-fragmentation, where existing forest patches are increasingly subdivided into smaller and more isolated fragments . This process reduces habitat connectivity, intensifies edge effects, and limits species movement and genetic exchange . Simultaneously, the significant decline in Mean Patch Size (MPS) confirms that large continuous forest areas are being fragmented into ecologically vulnerable units with reduced core habitat capacity for area-sensitive species . The peak fragmentation period occurred in 2023_H1, marked by maximum NP and PD values alongside the minimum MPS, indicating the highest structural stress on the landscape . The subsequent decline in NP and PD, coupled with a slight increase in MPS during 2023_H2, does not represent ecological recovery but rather supports the “Patch Vaporization Hypothesis,” where the smallest and most fragile patches were completely lost from the landscape . This process artificially increases average patch size while accelerating habitat isolation and biodiversity decline . Furthermore, although the Core Area Index (CAI) appeared relatively stable, this stability is misleading because the disappearance of small patches with no interior habitat masks the ongoing erosion of functional core areas . Persistent high edge exposure and fragmentation severity demonstrate that the Akure forest is approaching critical ecological thresholds, with continuous loss of interior habitat essential for biodiversity conservation . Overall, the findings indicate that the dominant threat to the Akure forest is not large-scale abrupt deforestation, but sustained low-level fragmentation resulting in chronic structural breakdown and progressive ecosystem vulnerability.
5.4. Interpreting the Structural Paradox: Comparative Insights and Ecological Implications
The Akure forest shows a clear structural paradox in its fragmentation dynamics: the landscape appears stable at a large scale, yet continues to degrade internally over time. Geometric metrics (FFI, FFDI, LCFD, and AI) remain stable and high, meaning the forest still appears structurally intact and highly clustered (~97% aggregation). However, this stability reflects a “locked-in” fragmented state, not a healthy ecosystem. The consistently high LCFD (~1.38) shows that disturbances are small and scattered, caused by activities like encroachment and selective logging, which gradually erode the forest from within. In contrast, patch-level metrics show strong internal breakdown. The Number of Patches (NP) increases while Mean Patch Size (MPS) decreases, indicating ongoing micro-fragmentation that peaked in 2023_H1. This leads to stronger edge effects and loss of interior habitat, even though large-scale indices remain unchanged. In 2023_H2, NP and PD decline and MPS increases slightly, but this is not recovery. Instead, it reflects the loss of the smallest fragments (patch vaporization), which simplifies the landscape while hiding continued habitat loss. Overall, the forest is not stable in a healthy sense it is undergoing continuous internal erosion. Conservation should focus on protecting core forest areas and preventing small-scale fragmentation, rather than relying on large-scale stability indicators that mask ongoing degradation.
5.5. Interpreting the Structural Paradox and Conservation Implications
The results show that the Akure forest is in a highly fragmented but seemingly stable condition that hides ongoing ecological decline. High and stable values of FFI, FFDI, and LCFD (~1.38) indicate that the forest has reached a structurally “stable” but heavily stressed state. The high LCFD suggests that disturbance is coming from small, widespread human activities such as encroachment, selective logging, and minor land clearing, which create irregular forest edges rather than large clear-cut areas. At the same time, strong increases in the Number of Patches (NP) and Patch Density (PD), along with a sharp decline in Mean Patch Size (MPS), show that the forest is being broken into many smaller fragments. This micro-fragmentation peaked in 2023_H1, increasing edge effects and reducing interior habitat needed by sensitive species. In 2023_H2, the slight drop in NP and PD and the rise in MPS likely do not indicate recovery, but rather the loss of the smallest fragments (patch vaporization). This creates the illusion of improvement while overall habitat continues to degrade. Overall, the forest is shifting into a high-edge, low-core system driven by small-scale human pressure. The findings suggest that conservation efforts should focus on protecting core forest areas and preventing further micro-fragmentation, rather than relying only on traditional landscape stability indicators .
6. Conclusion
This study presents a high-accuracy spatio-temporal deep learning framework for monitoring deforestation in Nigeria by combining Sentinel-1 SAR and Planet NICFI imagery. The method improves detection by reducing noise and classification errors, achieving strong performance (Precision = 0.865, Recall = 0.945, F1 = 0.904, IoU = 0.742). From 2020 to 2023, deforestation showed strong spatial and temporal variation, with the highest activity in late 2023 and the lowest in early 2020. Results also show uneven patch sizes and formation speeds, reflecting different levels of human impact across the landscape. A key finding is a mismatch between large-scale and small-scale ndicators. While overall structure appears stable based on macro metrics like the Aggregation Index (>96%) and Forest Fragmentation Index, finer-scale metrics reveal ongoing degradation. Micro-fragmentation is evidenced by a 30.4% increase in the Number of Patches and a 37.1% decrease in Mean Patch Size, along with consistently high Local Connected Fractal Dimension (~1.38), indicating widespread small-scale disturbance. These processes increase edge effects and reduce core forest areas, weakening ecosystem health and biodiversity. The apparent improvement in 2023_H2 is not true recovery but patch loss of smaller fragments, which can mask continued degradation. Overall, the study shows that traditional metrics alone are not enough to capture real forest decline. Effective monitoring requires combining large-scale structural indices with detailed patch-level indicators to better detect micro-fragmentation and support forest conservation in Nigeria.
Abbreviations

CV

Coefficient Variation

FFI

Fractal Fragmentation Index

FFDI

Fractal Fragmentation Disorder Index

GFC

Global Forest Change

LCFD

Local Connected Fractal Dimension

Acknowledgments
We sincerely acknowledge the Centre for Space Science and Technology Education at Obafemi Awolowo University, Ile-Ife, Nigeria, for providing the vital resources that made the successful completion of this study possible.
Author Contributions
Lukman Alage Isiaka: Conceptualization, Data curation, Formal Analysis, Investigation, Methodology, Software, Validation, Writing – original draft
Festus Olatoyinbo Seyi: Investigation, Project administration, Supervision
Adebayo Gbenga Ojo: Investigation, Methodology, Validation, Writing – review & editing
Babatunde Olaleye Salu: Investigation, Resources, Software, Writing – review & editing
Kayode Paul Olorunyomi: Investigation, Resources, Writing – review & editing
Jamiu Taiwo Aileru: Investigation, Resources, Software, Writing – review & editing
Funding
The authors received no financial support for the research, authorship, and/or publication of this article.
Data Availability Statement
Datasets are available upon request, and selected network-related code can be accessed publicly on GitHub at https://github.com.
Conflicts of Interest
The author(s) declare no potential conflicts of interest related to this research.
References
[1] A. Henareh Khalyani, A. L. Mayer, M. J. Falkowski, and D. Muralidharan, “Deforestation and landscape structure changes related to socioeconomic dynamics and climate change in Zagros forests,” J. Land Use Sci., vol. 8, no. 3, pp. 321–340, Sep. 2013,
[2] M. Brandt et al., “An unexpectedly large count of trees in the West African Sahara and Sahel,” Nature, vol. 587, no. 7832, pp. 78–82, Nov. 2020,
[3] J. A. Wiens, “Landscape ecology as a foundation for sustainable conservation,” Landsc. Ecol., vol. 24, no. 8, pp. 1053–1065, Sep. 2009,
[4] A. Dascălu, J. Catalão, and A. Navarro, “Detecting Deforestation Using Logistic Analysis and Sentinel-1 Multitemporal Backscatter Data,” Remote Sens. (Basel)., vol. 15, no. 2, Jan. 2023,
[5] A. P. Kirilenko and R. A. Sedjo, “Climate change impacts on forestry,” Proceedings of the National Academy of Sciences, vol. 104, no. 50, pp. 19697–19702, Dec. 2007,
[6] P. F. Hessburg, S. J. Prichard, R. K. Hagmann, N. A. Povak, and F. K. Lake, “Wildfire and climate change adaptation of western North American forests: a case for intentional management,” Ecological Applications, vol. 31, no. 8, Dec. 2021,
[7] T. Kuemmerle et al., “Forest cover change and illegal logging in the Ukrainian Carpathians in the transition period from 1988 to 2007,” Remote Sens. Environ., vol. 113, no. 6, pp. 1194–1207, Jun. 2009,
[8] P. Pacheco, “Actor and frontier types in the Brazilian Amazon: Assessing interactions and outcomes associated with frontier expansion,” Geoforum, vol. 43, no. 4, pp. 864–874, Jun. 2012,
[9] R. Walker, Mapping process to pattern in the landscape change of the amazonian frontier. Ann. Assoc. Am. Geogr. 93, 376–398. 2003.
[10] F. Pendrill et al., “Disentangling the numbers behind agriculture-driven tropical deforestation,” Sep. 09, 2022, American Association for the Advancement of Science.
[11] F. Taubert et al., “Global patterns of tropical forest fragmentation,” Nature, vol. 554, no. 7693, pp. 519–522, Feb. 2018,
[12] R. Kyere-Boateng and M. V. Marek, “Analysis of the social-ecological causes of deforestation and forest degradation in ghana: Application of the dpsir framework,” Apr. 01, 2021, MDPI AG.
[13] I. L. Alage, Y. Tan, A. W. Akande, H. J. Olugbenga, A. Suprijanto, and M. K. Lodhi, “Fractal Metrics and Connectivity Analysis for Forest and Deforestation Fragmentation Dynamics,” Forests, vol. 16, no. 2, p. 314, Feb. 2025,
[14] R. Shang et al., “Near-real-time monitoring of land disturbance with harmonized Landsats 7–8 and Sentinel-2 data,” Remote Sens. Environ., vol. 278, Sep. 2022,
[15] A. Buchadas, M. Baumann, P. Meyfroidt, and T. Kuemmerle, “Uncovering major types of deforestation frontiers across the world’s tropical dry woodlands.” in Nat. Sustain. 5, 2022, pp. 619–627.
[16] J. Schielein and J. B¨orner, “ Recent transformations of land-use and land-cover dynamics across different deforestation frontiers in the brazilian Amazon,” in Land Use Policy, 2018, pp. 81–94.
[17] R. Sun et al., “Integration of deep learning algorithms with a Bayesian method for improved characterization of tropical deforestation frontiers using Sentinel-1 SAR imagery,” Remote Sens. Environ., vol. 298, Dec. 2023,
[18] F. Zhao et al., “Monthly mapping of forest harvesting using dense time series Sentinel-1 SAR imagery and deep learning,” Remote Sens. Environ., vol. 269, p. 112822, Feb. 2022,
[19] M. G. Hethcoat, J. M. B. Carreiras, D. P. Edwards, R. G. Bryant, and S. Quegan, “Detecting tropical selective logging with C-band SAR data may require a time series approach,” Remote Sens. Environ., vol. 259, Jun. 2021,
[20] J. A. Cardille and J. A. Fortin, “Bayesian updating of land-cover estimates in a data-rich environment,” Remote Sens. Environ., vol. 186, pp. 234–249, Dec. 2016,
[21] H. Mizuochi, M. Hayashi, and T. Tadono, “Development of an operational algorithm for automated deforestation mapping via the Bayesian integration of long-term optical and microwave satellite data,” Remote Sens. (Basel)., vol. 11, no. 17, 2019,
[22] J. A. Cardille, E. Perez, M. A. Crowley, M. A. Wulder, J. C. White, and T. Hermosilla, “Multi-sensor change detection for within-year capture and labelling of forest disturbance,” Remote Sens. Environ., vol. 268, Jan. 2022,
[23] G. Enaruvbe and * Enaruvbe, “A systematic assessment of plantation expansion in Okomu Forest Reserve, Edo State, Southern Nigeria,” 2018. [Online]. Available:
[24] Okabeghe climate, “Weather Okabeghe & temperature by month". en.climate-data.org. Retrieved 22 October 2023.,” Weather Okabeghe & temperature by month.
[25] M. Engdahl, “The Sentinel-1 Toolbox,” 2014. [Online]. Available:
[26] M. A. Belenguer-Plomer, M. A. Tanase, A. Fernandez-Carrillo, and E. Chuvieco, “Burned area detection and mapping using Sentinel-1 backscatter coefficient and thermal anomalies,” Remote Sens. Environ., vol. 233, Nov. 2019,
[27] F. H. Wagner et al., “Mapping Tropical Forest Cover and Deforestation with Planet NICFI Satellite Images and Deep Learning in Mato Grosso State (Brazil) from 2015 to 2021,” Remote Sens. (Basel)., vol. 15, no. 2, p. 521, Jan. 2023,
[28] R. Dalagnol et al., “Mapping tropical forest degradation with deep learning and Planet NICFI data,” Remote Sens. Environ., vol. 298, Dec. 2023,
[29] P. Pandey, J. Kington, A. Kanwar, R. Simmon, and L. Abraham, “PLANET BASEMAPS FOR NICFI DATA PROGRAM ADDENDUM TO BASEMAPS PRODUCT SPECIFICATION,” 2023. [Online]. Available:
[30] J. V. Solórzano, J. F. Mas, J. A. Gallardo-Cruz, Y. Gao, and A. Fernández-Montes de Oca, “Deforestation detection using a spatio-temporal deep learning approach with synthetic aperture radar and multispectral images,” ISPRS Journal of Photogrammetry and Remote Sensing, vol. 199, pp. 87–101, May 2023,
[31] J. V. Solórzano, J. F. Mas, Y. Gao, and J. A. Gallardo-Cruz, “Land Use Land Cover Classification with U-Net: Advantages of Combining Sentinel-1 and Sentinel-2 Imagery,” Remote Sens. (Basel)., vol. 13, no. 18, p. 3600, Sep. 2021,
[32] M. Kuhn and H. Wickham, “ Tidymodels: a collection of packages for modeling and machine learning using tidyverse principles.,” 2020.
[33] L. Breiman, “Random Forests,” 2001.
[34] A. Liaw and M. Wiener, “Classification and Regression by RandomForest,” 2002. [Online]. Available:
[35] C. Nguyen, Y. Wang, and H. N. Nguyen, “Random forest classifier combined with feature selection for breast cancer diagnosis and prognostic,” J. Biomed. Sci. Eng., vol. 06, no. 05, pp. 551–560, 2013,
[36] O. Ronneberger, P. Fischer, and T. Brox, “U-Net: Convolutional Networks for Biomedical Image Segmentation,” 2015, pp. 234–241.
[37] M. Ortega Adarme, R. Queiroz Feitosa, P. Nigri Happ, C. Aparecido De Almeida, and A. Rodrigues Gomes, “Evaluation of Deep Learning Techniques for Deforestation Detection in the Brazilian Amazon and Cerrado Biomes From Remote Sensing Imagery,” Remote Sens. (Basel)., vol. 12, no. 6, p. 910, Mar. 2020,
[38] B. M. Matosak, L. M. G. Fonseca, E. C. Taquary, R. V. Maretto, H. do N. Bendini, and M. Adami, “Mapping Deforestation in Cerrado Based on Hybrid Deep Learning Architecture and Medium Spatial Resolution Satellite Time Series,” Remote Sens. (Basel)., vol. 14, no. 1, p. 209, Jan. 2022,
[39] D. John and C. Zhang, “An attention-based U-Net for detecting deforestation within satellite sensor imagery,” International Journal of Applied Earth Observation and Geoinformation, vol. 107, Mar. 2022,
[40] I. Lukman Alage, Y. Tan, A. Wasiu Akande, and A. Suprijanto, “Advanced characterization of deforestation frontiers in Nigeria utilizing deep learning and Bayesian approaches with sentinel-1 SAR imagery,” Geocarto Int., vol. 40, no. 1, 2025,
[41] L. Fahrig, “Effects of Habitat Fragmentation on Biodiversity,” 2003, Annual Reviews Inc.
[42] I. Andronache, “Analysis of Forest Fragmentation and Connectivity Using Fractal Dimension and Succolarity,” Land (Basel)., vol. 13, no. 2, Feb. 2024,
[43] I. C. Andronache et al., “Fractal analysis for studying the evolution of forests,” Chaos Solitons Fractals, vol. 91, pp. 310–318, Oct. 2016,
[44] D. Peptenatu et al., “A new fractal index to classify forest fragmentation and disorder,” Landsc. Ecol., vol. 38, no. 6, pp. 1373–1393, Jun. 2023,
[45] G. L. Baker and J. P. Gollub, Chaotic Dynamics. Cambridge University Press, 1996.
[46] A. Kaushik, J. Graham, K. Dorheim, R. Kramer, J. Wang, and B. Byrne, “The Future of the Carbon Cycle in a Changing Climate,” Eos (Washington. DC)., vol. 101, Feb. 2020,
[47] J. Fitz, A. A. Adenle, and C. Ifejika Speranza, “Increasing signs of forest fragmentation in the Cross River National Park in Nigeria: Underlying drivers and need for sustainable responses,” Ecol. Indic., vol. 139, Jun. 2022,
[48] J. Reiche, E. Hamunyela, J. Verbesselt, D. Hoekman, and M. Herold, “Improving near-real time deforestation monitoring in tropical dry forests by combining dense Sentinel-1 time series with Landsat and ALOS-2 PALSAR-2,” Remote Sens. Environ., vol. 204, pp. 147–161, Jan. 2018,
[49] C. G. Diniz et al., “DETER-B: The New Amazon Near Real-Time Deforestation Detection System,” IEEE J. Sel. Top. Appl. Earth Obs. Remote Sens., vol. 8, no. 7, pp. 3619–3628, Jul. 2015,
[50] M. Watanabe, C. N. Koyama, M. Hayashi, I. Nagatani, T. Tadono, and M. Shimada, “Refined algorithm for forest early warning system with ALOS-2/PALSAR-2 ScanSAR data in tropical forest regions,” Remote Sens. Environ., vol. 265, Nov. 2021,
[51] W. F. Laurance et al., “Erratum: Corrigendum: A global strategy for road building,” Nature, vol. 514, no. 7521, pp. 262–262, Oct. 2014,
[52] M. C., Hansen and R. M. M. H. S. A. T. A. T. D. T. P. V. Potapov, “High- Resolution Global Maps of 21st-Century Forest Cover Change,” Science 342, pp. 850–853, 2013.
[53] R. H. Marrs, “Book review,” Biol. Conserv., vol. 182, p. 288, Feb. 2015,
[54] E. L. Bullock and C. E. Woodcock, “Carbon loss and removal due to forest disturbance and regeneration in the Amazon,” Science of The Total Environment, vol. 764, p. 142839, Apr. 2021,
[55] K. A. With, “Using fractal analysis to assess how species perceive landscape structure,” SPB Academic Publishing bv, 1994.
[56] I. Andronache et al., “Dynamics of Forest Fragmentation and Connectivity Using Particle and Fractal Analysis,” Sci. Rep., vol. 9, no. 1, pp. 1–9, 2019,
[57] A. Farina, “Methods in Landscape Ecology,” 2022, pp. 401–439.
[58] P. Netzel, L. Tyminska, D. Dana Feleha, and J. Socha, “New approach to assess forest fragmentation based on multiscale similarity index,” Ecol. Indic., vol. 158, p. 111530, Jan. 2024,
[59] K. A. Harper et al., “Edge influence on forest structure and composition in fragmented landscapes,” Jun. 2005.
[60] H. B. Jackson and L. Fahrig, “Habitat Loss and Fragmentation,” in Encyclopedia of Biodiversity, Elsevier, 2013, pp. 50–58.
[61] N. M. Haddad et al., “Habitat fragmentation and its lasting impact on Earth’s ecosystems,” Sci. Adv., vol. 1, no. 2, Mar. 2015,
[62] R. J. Fletcher et al., “Is habitat fragmentation good for biodiversity,” Biol. Conserv., vol. 226, pp. 9–15, Oct. 2018,
[63] R. M. Ewers and C. Banks-Leite, “Fragmentation Impairs the Microclimate Buffering Effect of Tropical Forests,” PLoS One, vol. 8, no. 3, p. e58093, Mar. 2013,
[64] L. Alencar, M. I. S. Escada, and J. L. C. Camargo, “Long-term landscape structure change in contrasting land occupation strategies of the Brazilian Amazon,” Land use policy, vol. 150, Mar. 2025,
[65] V. Arroyo-Rodríguez et al., “Multiple successional pathways in human-modified tropical landscapes: new insights from forest succession, forest fragmentation and landscape ecology research,” Biological Reviews, vol. 92, no. 1, pp. 326–340, Feb. 2017,
Cite This Article
  • APA Style

    Isiaka, L. A., Seyi, F. O., Ojo, A. G., Salu, B. O., Olorunyomi, K. P., et al. (2026). Bayesian-Enhanced Deep Learning and Multi-Sensor Fusion for Spatiotemporal Analysis of Deforestation Frontiers and Landscape Structural Dynamics. American Journal of Remote Sensing, 14(2), 45-67. https://doi.org/10.11648/j.ajrs.20261402.13

    Copy | Download

    ACS Style

    Isiaka, L. A.; Seyi, F. O.; Ojo, A. G.; Salu, B. O.; Olorunyomi, K. P., et al. Bayesian-Enhanced Deep Learning and Multi-Sensor Fusion for Spatiotemporal Analysis of Deforestation Frontiers and Landscape Structural Dynamics. Am. J. Remote Sens. 2026, 14(2), 45-67. doi: 10.11648/j.ajrs.20261402.13

    Copy | Download

    AMA Style

    Isiaka LA, Seyi FO, Ojo AG, Salu BO, Olorunyomi KP, et al. Bayesian-Enhanced Deep Learning and Multi-Sensor Fusion for Spatiotemporal Analysis of Deforestation Frontiers and Landscape Structural Dynamics. Am J Remote Sens. 2026;14(2):45-67. doi: 10.11648/j.ajrs.20261402.13

    Copy | Download

  • @article{10.11648/j.ajrs.20261402.13,
      author = {Lukman Alage Isiaka and Festus Olatoyinbo Seyi and Adebayo Gbenga Ojo and Babatunde Olaleye Salu and Kayode Paul Olorunyomi and Jamiu Taiwo Aileru and Adeniyi Michael Oluwagbohunmi},
      title = {Bayesian-Enhanced Deep Learning and Multi-Sensor Fusion for Spatiotemporal Analysis of Deforestation Frontiers and Landscape Structural Dynamics},
      journal = {American Journal of Remote Sensing},
      volume = {14},
      number = {2},
      pages = {45-67},
      doi = {10.11648/j.ajrs.20261402.13},
      url = {https://doi.org/10.11648/j.ajrs.20261402.13},
      eprint = {https://article.sciencepublishinggroup.com/pdf/10.11648.j.ajrs.20261402.13},
      abstract = {Monitoring deforestation and forest fragmentation in tropical ecosystems remains challenging due to rapid anthropogenic pressures, understory disturbances, and the temporal limitations of conventional remote-sensing approaches dominated by annual, reflectance-based observations. This study presents an integrated spatiotemporal framework for biannual deforestation mapping in the Akure Forest Reserve (2020–2023), combining high-resolution Planet NICFI optical imagery with Sentinel-1 SAR data to enhance fine-scale temporal detection and reduce classification uncertainty. Three U-Net architectures with ResNet18, ResNet34, and ResNet50 backbones were evaluated across eight biannual datasets and benchmarked against traditional machine learning classifiers. To improve temporal coherence in SAR-derived predictions, a Bayesian updating strategy was applied. The resulting biannual maps enabled a detailed analysis of deforestation frontier dynamics through patch size distribution, patch formation speed, and spatial configuration. To characterize multiscale degradation patterns, conventional landscape metrics (Number of Patches, Patch Density, Mean Patch Size, Edge Density, Aggregation Index, and Forest Fragmentation Index) were integrated with fractal-based indicators, including Fractal Dimension and Local Connected Fractal Dimension. Results indicate that the U-Net model with a ResNet34 backbone achieved the highest classification performance (Precision = 0.9342, IoU = 0.9086), while Bayesian temporal updating further enhanced temporal stability (Precision = 0.9663, IoU = 0.9470), revealing pronounced clustering of deforestation in late 2023 (Coefficient Variation (CV) = 1.939). Fragmentation analysis reveals progressive micro-fragmentation characterized by increasing patch number and density, declining mean patch size, and persistently high local fractal connectivity, indicating intense internal forest erosion despite apparent structural stability. This structural–functional decoupling suggests that forests may remain spatially intact while undergoing substantial functional degradation. By integrating deep learning, Bayesian inference, and multiscale spatial metrics, this study provides a more sensitive and spatially explicit characterization of deforestation dynamics, offering valuable insights for geospatial analysis, conservation planning, and sustainable forest management.},
     year = {2026}
    }
    

    Copy | Download

  • TY  - JOUR
    T1  - Bayesian-Enhanced Deep Learning and Multi-Sensor Fusion for Spatiotemporal Analysis of Deforestation Frontiers and Landscape Structural Dynamics
    AU  - Lukman Alage Isiaka
    AU  - Festus Olatoyinbo Seyi
    AU  - Adebayo Gbenga Ojo
    AU  - Babatunde Olaleye Salu
    AU  - Kayode Paul Olorunyomi
    AU  - Jamiu Taiwo Aileru
    AU  - Adeniyi Michael Oluwagbohunmi
    Y1  - 2026/07/28
    PY  - 2026
    N1  - https://doi.org/10.11648/j.ajrs.20261402.13
    DO  - 10.11648/j.ajrs.20261402.13
    T2  - American Journal of Remote Sensing
    JF  - American Journal of Remote Sensing
    JO  - American Journal of Remote Sensing
    SP  - 45
    EP  - 67
    PB  - Science Publishing Group
    SN  - 2328-580X
    UR  - https://doi.org/10.11648/j.ajrs.20261402.13
    AB  - Monitoring deforestation and forest fragmentation in tropical ecosystems remains challenging due to rapid anthropogenic pressures, understory disturbances, and the temporal limitations of conventional remote-sensing approaches dominated by annual, reflectance-based observations. This study presents an integrated spatiotemporal framework for biannual deforestation mapping in the Akure Forest Reserve (2020–2023), combining high-resolution Planet NICFI optical imagery with Sentinel-1 SAR data to enhance fine-scale temporal detection and reduce classification uncertainty. Three U-Net architectures with ResNet18, ResNet34, and ResNet50 backbones were evaluated across eight biannual datasets and benchmarked against traditional machine learning classifiers. To improve temporal coherence in SAR-derived predictions, a Bayesian updating strategy was applied. The resulting biannual maps enabled a detailed analysis of deforestation frontier dynamics through patch size distribution, patch formation speed, and spatial configuration. To characterize multiscale degradation patterns, conventional landscape metrics (Number of Patches, Patch Density, Mean Patch Size, Edge Density, Aggregation Index, and Forest Fragmentation Index) were integrated with fractal-based indicators, including Fractal Dimension and Local Connected Fractal Dimension. Results indicate that the U-Net model with a ResNet34 backbone achieved the highest classification performance (Precision = 0.9342, IoU = 0.9086), while Bayesian temporal updating further enhanced temporal stability (Precision = 0.9663, IoU = 0.9470), revealing pronounced clustering of deforestation in late 2023 (Coefficient Variation (CV) = 1.939). Fragmentation analysis reveals progressive micro-fragmentation characterized by increasing patch number and density, declining mean patch size, and persistently high local fractal connectivity, indicating intense internal forest erosion despite apparent structural stability. This structural–functional decoupling suggests that forests may remain spatially intact while undergoing substantial functional degradation. By integrating deep learning, Bayesian inference, and multiscale spatial metrics, this study provides a more sensitive and spatially explicit characterization of deforestation dynamics, offering valuable insights for geospatial analysis, conservation planning, and sustainable forest management.
    VL  - 14
    IS  - 2
    ER  - 

    Copy | Download

Author Information
  • African Regional Centre for Space Science and Technology Education - English, Obafemi Awolowo University, Ile-Ife, Nigeria; National Space Research and Development Agency, Abuja, Nigeria
  • African Regional Centre for Space Science and Technology Education - English, Obafemi Awolowo University, Ile-Ife, Nigeria; National Space Research and Development Agency, Abuja, Nigeria

  • African Regional Centre for Space Science and Technology Education - English, Obafemi Awolowo University, Ile-Ife, Nigeria; National Space Research and Development Agency, Abuja, Nigeria

  • African Regional Centre for Space Science and Technology Education - English, Obafemi Awolowo University, Ile-Ife, Nigeria; National Space Research and Development Agency, Abuja, Nigeria

  • African Regional Centre for Space Science and Technology Education - English, Obafemi Awolowo University, Ile-Ife, Nigeria; National Space Research and Development Agency, Abuja, Nigeria

  • National Space Research and Development Agency, Abuja, Nigeria

  • African Regional Centre for Space Science and Technology Education - English, Obafemi Awolowo University, Ile-Ife, Nigeria; National Space Research and Development Agency, Abuja, Nigeria

  • Abstract
  • Keywords
  • Document Sections

    1. 1. Introduction
    2. 2. The Study Sites and Data Source
    3. 3. Methodology
    4. 4. Results
    5. 5. Discussion
    6. 6. Conclusion
    Show Full Outline
  • Abbreviations
  • Acknowledgments
  • Author Contributions
  • Funding
  • Data Availability Statement
  • Conflicts of Interest
  • References
  • Cite This Article
  • Author Information