Abstract
This project examines the use of GIS and RS in mapping land use land cover change in Guto Wayu woreda between 2010 and 2020 so as to detect and analyze the change that has taken in the area between these periods. In order to achieve the Satellite of landsat have been obtained and preprocessing using EARDAS IMAGINE. The maximum likelhood algorism of supervised Image classification has been used to generate land use land cover maps and change detection. Aggregate rate of changes of Land use and land cover of Guto Wayu woreda resulted that considerable change has occurred within ten (10) years from 2010 to 2020) that is only forest and water body has decreased in (-8.6%) and(-0.01%) respectively, while the rest classes namely built up area in +2.05%, bare land (+4.8%) and Agricultural land (+5.8%) has increased Expansion of built up area and decreased public awareness for the forest / Plant vegetation.
Keywords
GIS, Remote Sensing, LULC
1. Introduction
1.1. Background of the Study
Land is a complex and dynamic factor which consists of, geology, topography, hydrology, soil and micro climate and community of plants and animals that are continually interacting under the influence of climate and people activities. Land is becoming a scarce resource due to immense agricultural and demographic pressure. Hence, information on land use / land cover and possibilities for their optimal use is essential for the selection, planning and implementation of land use schemes to meet the increasing demands for basic human needs and welfare.
In Ethiopia, farmers mainly use this basic resource in traditional ways without any logical organizations of different types of land according to their agricultural potential or their physical configurations
| [1] | Hudson, N.W. (1995) Soil Conservation. 3rd Edition, Batsford, London, 392. |
[1]
. This leads to high development of agricultural sectors and the whole economy. Land use / Land cover change plays a vital role in the study of global change. Land use / Land cover and human or natural modification have largely resulted in deforestation, biodiversity loss, global warming and increase of natural flooding. Thus environmental problems are often related to Land use/ Land cover change. The land use / land cover pattern of a region is an outcome of natural and socio economic factors and their utilization by man in time and space.
To understand how LULC affects and interacts with the earth systems (e.g. hydrosphere, biosphere, and atmosphere), accurate information is needed on what types of changes occur, where information is needed, what information is needed and when they occur, and rates of at which changes occur
| [2] | Lambin, 1997, as cited Bewket, Teferi, Uhlenbrook, Wenningeret.al, 2012. |
[2]
. Over the past years, data from earth sensing satellites has become vital in mapping the Earth’s features and infrastructures, managing natural resources and studying environmental change.
The prior benefit of LULUC study is that it is one of the most precise techniques to understand LULC mechanism. Timely and precise information about LULC change is extremely important for better management of decision making. There is a continuing demand for up-to date LULC information for any kind of a sustainable development program where LULC serves as one of the major input criteria.
Remote Sensing (RS) and Geographic Information System (GIS) are now providing new tools for advanced ecosystem management. The collection of remotely sensed data facilitates the synoptic analyses of Earth system function, patterning, and change at global, regional and local scales over time; such data also provide an important link between intensive, localized ecological research and regional, national and international conservation and management of biological diversity
| [3] | National and international conservation and management of biological diversity (Wilkie and Finn, 1996). |
[3]
.
1.2. Statement of the Problem
Land use changes arising from high rate of urbanization (built up area), agriculture; pasturing and deforestation and road expansion are some of the contributing factors to land cover changes in weastern Ethiopia, Guto wayu woreda. These changes in LULC reflect the population growth, land consumption rate and climate. Agriculturally productive and non-productive land and forest land have been converted into residential and other land use classes. The land use and land cover pattern of a woreda is an outcome of natural and socio-economic factors and their utilization by man in time and space. The uncontrolled growth of development has adversely affect woreda ecosystem which has influence to indirectly reflect on weather parameters and eventually leads to local climate modification.
1.3. Objective of the Study
1.3.1. General Objective
The general objective of the study is to analysis land use/ covers change detection by using remote sensing and GIS techniques, in the case of Guto wayu.
1.3.2. Specific Objective
The specific objectives of the study are:
1) To analysis LULC change detections within the interval years of ( 2010, 2015 and 2020)
2) To map land use/cover changes of study area
3) To quantify changes in amount for LULC changed to the other status in the study area
1.4. Research Question
The question under the study may include the following:
1) How land use / land cover change detection analysis is important for sustainable development?
2) Is that land use/ land cover change detection can be possible by using GIS and RS?
3) How land use /land cover change detection suitable for improvement in the study area?
1.5. Significance of the Project
The land use and land cover change within the study area has scientific and developmental importance for the future. The study will provide base line information on issues of land use and land cover change and dynamics in relation to vegetation cover change in the study area. Therefore, community of the woreda benefit primarily. Furthermore, policy makers, development planners, local land managers and concerned bodies benefit a lot from this project.
Basically, such information is vital for comparing the past and present condition and predicts the future trends of the LULC change and expanding such method of protecting the soil degradation and expanding such techniques to others area. This has therefore resulted in increased land cover change and a modification and alterations in the status of land use and land cover over time without any detailed and comprehensive attempt (as provided by a Remote Sensing data and GIS) to evaluate this status as it changes over time with a view to detecting the land cover change and also make attempt to predict same and the possible changes that may occur in this status. It is therefore, necessary for a study to be carried out in Guto Wayu woreda to avoid the associated problems of a growing and expanding like many others areas in our countries.
1.6. Scope and Limitation of the Study
1.6.1. Limitation
The study had reflected different limitations. Because of unavailability of high resolution of satellite data for the research, lack of budget and shortage of time for data collection, process, and analysis.
1.6.2. Scope
The study contains five chapters; Chapter one included,’ background, statement of the problem, objectives, research questions, significance of the study, Chapter two is about literature review, while chapter three included locations of the study area, data types, data sources, material and methodology, In chapter four result of the study was analyzed and discussed and finally in the last chapter, recommendation points were reflected to the stake holders/ expects based on the results obtained.
2. Literature Review
2.1. The Concept and Definition of Land Use Land Cover
Many books uses land use land cover change interchangeably, although they are different. Land use is defined to be any physical and biological or chemical change attributable to management, which may include conversion of grazing to cropping, change in fertilizer use, drainage improvement, installation and use of irrigation and plantation, building farm dams, pollution and land degradation, vegetation removal, change fire regimes, spread of weeds and exotic species, and conversion to non-agricultural uses
| [4] | Land use change is any change in the physical, biological or chemical conditions of the resources due to management to satisfy human interests (Quentin et al. 2006). |
[4]
.
Land cover class refers the physical characteristics of the earth’s, captured in the distribution of vegetation, water, desert, ice and other physical characteristics of land, including those created by solely by human activities such as settlement
| [5] | Land cover class refers the physical characteristics of the earth’s, including those created by solely by human activities such as settlement (Billah and Anisur, 2004). |
[5]
.
According to Meyer, 1999 every parcel of land on the Earth’s surface is unique in the cover it possesses. Land use and land cover are distinct yet closely linked characteristics of the Earth’s surface. The use to which we put land could be grazing, agriculture, urban development, logging, and mining among many others. While land cover categories could be crop land, forest, wetland, pasture, roads, urban areas among others. The term land cover originally referred to the kind and state of vegetation, such as forest or grass cover but it has broadened in subsequent usage to include other things such as human structures, soil type, biodiversity, surface and ground water as stated the same author, 1995)
| [6] | Every parcel of land on the Earth’s surface is unique in the cover it possesses (Meyer, 1999). |
[6]
.
Land cover data documents how much of the region is covered by forest, wet lands, impervious surfaces and crop lands, and other land and water types (wet lands or open water). Land use shows how people use land escape whether for development, conservation, or mixed uses. Land cover can be altered by forces other than anthropogenic. Natural events such as weather, flooding, fire, climate fluctuations and ecosystem dynamics may also initiate modifications upon land cover
| [7] | Natural events such as weather, flooding, fire, climate fluctuations and ecosystem dynamics may also initiate modifications upon land cover Wogderes (2014, as cited in MaD CAT manual, 2011). |
[7]
.
Globally, land cover today is altered principally by direct human use: by agriculture and livestock raising, forest harvesting and management and urban and sub urban construction and development. There are also incidental impacts on land cover from other human activities such as forest and lakes damaged by acid rain from fossil fuel combustion and crops near cities damaged by troposphere ozone resulting from automobile exhaust
| [8] | Globally, land cover today is altered principally by direct human use: (Meyer, 1995). |
[8]
.
2.2. Land Use Land Covers Change
Land use and land cover change (LUCC) of project are crucial to deal with the identification, qualitative description and parameterization of factors which drive changes in land use/ land cover, as well as the integration of their consequences and feedbacks.
Land use affects land cover and changes in land cover affect land use. A change in either however is not necessarily the product of the other. Changes in land cover by land use do not necessarily imply degradation of the land. However, many shifting land use patterns driven by a variety of social causes, result in land cover changes that affects biodiversity, water and radiation budgets, trace gas emissions and other processes that come together to affect climate and biosphere
| [9] | Gas emissions and other processes that come together to affect climate and biosphere (Riebsame, Meyer, and Turner, 1994). |
[9]
.
Generally, land use and land cover changes have a wide range of impacts on environmental and landscape attributes including the quality of water, land and air resources, ecosystem processes and functions
| [10] | Impacts of land use and land cover change on ecosystem service values (Rimal, 2011). |
[10]
. Therefore, the use of remote sensing data and analysis techniques provide accurate, timely and detailed information for detecting and monitoring changes in land cover and land use.
2.3. Geographic Information System (GIS) for LULC Change
The GIS technology is employed to assist decision-makers by indicating various alternatives in development and conservation planning and by modeling the potential outcomes of a series of scenarios. It should be noted that any task begins and ends with the real world. Data are collected about the real world. After the data are analyzed, information is compiled for decision-makers.
RS along with GIS tools used to gather, display, store, analyze and output data related to changes on environment, can provide researchers and planners with certain data sets in order to better understanding and management of a given area.
The GIS technology is employed to assist decision-makers by indicating various alternatives in development and conservation planning and by modeling the potential outcomes of a series of scenarios. It should be noted that any task begins and ends with the real world. Data are collected about the real world. After the data are analyzed, information is compiled for decision-makers.
2.4. Application of Remote Sensing for LULC Change
According Maktav et al (2005) showed that traditional data collection methods such as demographic data, census and sample maps were not satisfactory for the purpose of urban land use management
| [11] | Maktav et al (2005) showed that traditional data collection methods such as demographic data, census and sample maps were not satisfactory for the purpose of urban land use management. |
[11]
. Accurate information of land use and land cover change is therefore highly essential to many groups. To achieve this information, remotely sensed data can be used since it provides land cover information.
Remote sensing is referring to the science or art of acquiring information of an object or phenomena in the earth's surface without any physical contact with it. And this can be done though sensing and recording of either reflected or emitted energy or the information being processed, analyzed and applied to a given problem
| [12] | Sensing and recording of either reflected or emitted energy or the information being processed, analyzed and applied to a given problem (Campbell, 2002). |
[12]
.
The instruments used for measuring electromagnetic radiation are called sensors. These sensors record the reflected radiation from the surface of the earth and will be used for many analyses; one of these is land use land cover change analysis
| [13] | Sensors record the reflected radiation from the surface of the earth and will be used for many analyses; one of these is land use land cover change analysis (Lelesand and Kiefer, 1994). |
[13]
. Remote sensing data as the sources for GIS have been one of the most important data sources for studies of land cover spatial and temporal changes.
The most useful characteristic of Remote Sensing in land use and land cover change detection is the multi spectral and temporal resolution of the data. In recent years, satellite remote sensing techniques have been developed, which have proved to be of immense value for preparing accurate land use land cover maps and monitoring changes at regular intervals of time. The generation of remotely sensed data/images by various types of sensor flown aboard different platforms at varying heights above the terrain and at different times of the day and the year does not lead to a simple classification system. To date, the most successful attempt in developing a general purpose classification scheme compatible with remote sensing data has been by which is also referred to as USGS classification scheme
| [14] | General purpose classification scheme compatible with remote sensing data has been by (Anderson, et al, 2009) which is also referred to as USGS classification scheme. |
[14]
.
2.5. Image Classification Approaches
Image classification refers to the extraction of differentiated classes or themes, usually land cover and land use categories, from raw remotely sensed digital satellite data. Image classification using remote sensing techniques has attracted the attention of research community as the results of classification are the backbone of environmental, social and economic applications
| [15] | Land cover and land use categories, from raw remotely sensed digital satellite data (Lu and Weng, 2007, Weng, 2012). |
[15]
.
Because image classification is generated using a remotely sensed data, there are many factors that cause difficulty to achieve a more accurate result. Some of the factors are: the characteristics of a study area, Availability of high resolution, remotely sensed data, Ancillary and ground reference data, Suitable classification algorithms, the analyst’s experience, and Time constraint. These factors highly determine the type of classification to be used for image classification. According to Rechards, (1999) supervised classification is the procedure most used for quantifying of remote sensing data. To do this, representative sample sites of known cover type, called training areas are used to create the parametric signatures of each class. Following image classification as part of the change detection process, accuracy needs to be assessed to evaluate the degree of acceptability of the classification process. Accordingly, accuracy assessments are usually limited to the very recent image that serves as a reference using ground control points (GCPs) collected as part of the data required for the change analysis
| [16] | accuracy assessments are usually limited to the very recent image that serves as a reference using ground control points (GCPs) collected as part of the data required for the change analysis Wegderes (2014, as cited in Hussein Ali, 2009, Rechards, (1999)). |
[16]
.
Image classification is the process of creating thematic maps from satellite imagery. A thematic map is an informational representation of an image that shows the spatial distribution of a particular theme. Classification is a method that assigns categories to different pixel groups according with the spectral character. There are two main spectrally oriented classification procedures for land cover mapping: unsupervised and supervised classifications. According to Diday, (1994) unsupervised classification is computer-automated and it enables user to specify some parameters that the computer uses to uncover statistical patterns that are inherent in the data
| [17] | Unsupervised classification is computer-automated and it enables user to specify some parameters that the computer uses to uncover statistical patterns that are inherent in the data (Diday, (1994)). |
[17]
.
2.6. Change Detection Analysis Approaches
Change detection is the process of identifying differences in the state of an object or phenomenon by observing it at different times by using remote sensing techniques. Change detection is an important process in monitoring and managing natural resources and urban development because it provides quantitative analysis of the spatial distribution of the population of interest.
Essentially, it also involves the ability to quantify temporal applications of remotely sensed data obtained from Earth-orbiting satellites. Land use land cover change may result in environmental, social and economic impacts of greater damage than benefit to the area
| [18] | Land use land cover change may result in environmental, social and economic impacts of greater damage than benefit to the area (Moshen A, 1999), (Singh, 1989). |
[18]
.
Macleod and Congation, (1998) list four aspects of change detection which are important when monitoring natural resources:
| [19] | Macleod and Congation, (1998) aspects of change detection which are important when monitoring natural resources. |
[19]
1) Detecting the changes that have occurred
2) Identifying the nature of the change
3) ensuring the area extent of the change
4) Assessing the spatial pattern of the change
2.7. Causes, Consequences and Trends of Land Use and Land Cover Changes
Understanding the mechanisms leading to land use/land cover changes in the past is crucial to understand the current changes and predict future ones. Therefore land use and land cover change project and research needs to deal with the identification, qualitative description and parameterization of factors which drive changes in land use/land cover as well as the integration of their consequences and feed backs
| [20] | Qualitative description and parameterization of factors which drive changes in land use/land cover as well as the integration of their consequences and feed backs (Hussein Ali, (2009). |
[20]
. As a result, underlying causes also tend to be complex, formed by interactions of social, political, economic, demographic, technological, cultural, and biophysical variables.
Accordingly major causes of land use/land cover change are natural variability, economic and technological factors, demographic factors, institutional factors, cultural factors and globalization. Natural variability, natural environmental changes interact with the human decision making processes that cause land use/land cover change while Economic and technological factors influence land use decision making by altering prices, taxes etc.
2.8. Accuracy Assessment
The accuracy is essentially a measure of how many ground truth pixels were classified correctly. When looking at the land cover map, it is important to remember that no map is a perfect representation of reality. There are always errors in maps and we need to keep in mind how accurate they are, and whether that level of accuracy is sufficient for the ways we want to use the map information
| [21] | The level of accuracy that are sufficient for the ways we want to use the map information (Awotwi, 2009). |
[21]
. Based on the 30-meter resolution of the Land sat data used to create map, it is important to keep in mind that the map will be most accurate for viewing geographic patterns over larger areas. The result of an accuracy assessment provides us with an overall accuracy of the map based on an average of the accuracies for each class in the map. Producers Accuracy is the total number of correct pixels in a category divided by the total number of pixels of that category as derived from the reference data (column total). This statistics indicates the probability of a reference pixel being correctly classified and is a measure of Omission error.
| [22] | The probability of a reference pixel being correctly classified and is a measure of Omission error. (Jensen 2003). |
[22]
. Users Accuracy is when the total number of correct pixels in a category divided by the total number of pixels that were actually classified in that category (row total), the result is a measure of Commission error.
3. Data, Material and Methodology
3.1. Description of Study Area
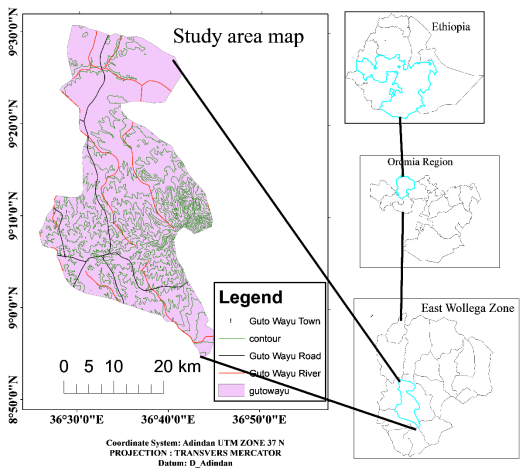
Guto Wayu is one of the 180 woreda in the oromia region of Ethiopia. It is bordered in the south by Nunu Kumba, in the southwest by Jimma Arjo and Diga Leka, in the west by Sasiga, in the northwest by Limmu and Gida Kiremu, in the northeast by Bila Seyo, in the east by Sibu Sire, and in the southeast by Wama Bonaya. The Administrative center of the woreda was Nekemte, which is also the zonal capital. It has Latitude 9° 09’ 60.00°N and 36°44’ 59.99°E longitude.
Figure 1. Location Map of the study area.
3.1.1. Temperature
The temperature of the area is related with altitude. When altitude increases temperature decreases, because of the earth atmosphere heated upward from lowest level. In Guto wayu station the monthly mean maximum 31c and minimum temperature 13c this station shows as an average temperature of the station recorded (National Meteorological Service Agency).
3.1.2. Population
Based on figures published by the Central Statistical Agency in 2005, this woreda has an estimated total population of 238,453, of whom 120,142 are men and 118,311 women; 85,637 or 35.91% of its population are urban dwellers, which is greater than the Zone average of 13.9%. With an estimated area of 1,324.22 square kilometers, Guto Wayu has an estimated population density of 180.1 people per square kilometer, which is greater than the Zone average of 81.4. The three largest ethnic groups reported in Guto Wayu were the Oromo (90.57%), the amhara (7.15%), and the Tigray (0.9%); all other ethnic groups made up 1.38% of the population. The Oromo language was spoken as a first language by 91.34%, 7.16% spoke Amharic, and 0.78% spoke Tigrinya; the remaining 1.11% spoke all other primary languages reported. The majority of the inhabitants were Ethiopian Orthodox Christianity, with 58.68% of the population reporting they observed this belief, while 30.37% of the population said they were Protestant, 5.98% were Moslem, and 4.24% were Roman Catholic. (Central Statistical Agency. 2005).
3.1.3. Topography of the Field
The major peaks of this woreda are Mounts Tuka (3141 meters), Komto and Daleti. Rivers include the Eya, Uke, Loko, Beseka, Wachu, Adiyya, Tato and Oda. A survey of the land in this woreda shows that 55.7% is arable or cultivable, 21.6% pasture, 8.5% forest, and 14.2% other. Komto and Chirri State Forests cover about 21.56 square kilometers of land. Coffee is an important cash crop of this woreda; between 20 and 50 square kilometers are planted with this crop.
3.2. Data Types, Sources and Materials
3.2.1. Data Types
In the study both primary and secondary data sources has been used.
Land sat satellite images of the study area was acquired for ten years; 2010, 2015 and 2020. The primary data source was included field data that was collected with the use of;
Global Positioning Systems (GPS)
The seconder data source mainly involves;
1) Satellite image
2) DEM
3) Shape file of study area
3.2.2. Source of Data
The sources of data that we use in the study were listed below in the table;
Table 1. Source and data types.
Sources | Data types |
USGS | Satellite image, DEM |
Ethio Administration | Shape file of study area |
3.2.3. Material and Software Used
Materials and software used in the study were listed in the following table.
Table 2. Software and there application.
Software | Function/use |
ARC MAP 10.7 | For data analyzing and mapping |
ERDAS IMAGINE 2015 | For supervise classification of land sat data |
3.3. Methodology
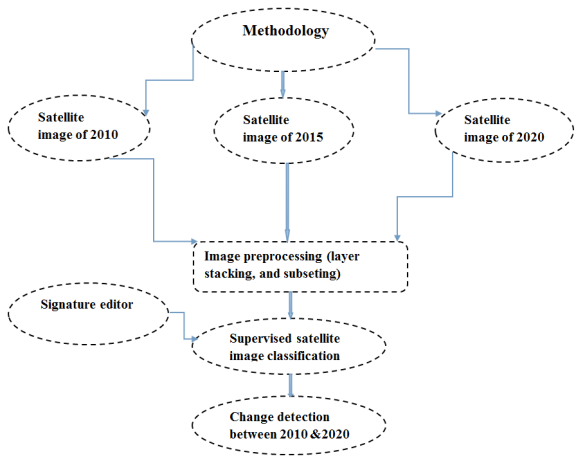
Raw satellite image is full of errors and will not be directly utilized for features identification and any applications. It needs some correction. Pre-processing is done before the main data analysis and extraction of information. Pre-processing involves two major processes: geometric correction and radiometric correction or haze correction. Remote sensing imageries are inherently subjected to geometric distortions. These distortions may be due to the perspective of the sensor optics, the motion of the scanning system, the motion of the platform (the platform altitude, attitude and velocity), the terrain relief, or the curvature and rotation of the earth (Lillesand and Kiefer, 2000).
Figure 2. Diagram of Methodology.
3.4. Image Classification
Supervised classification can be used to cluster pixels in a datasets in to classes corresponding to user defined training classes or the process of using samples of known identity (i.e., pixels already assigned to informational classes) to classify pixels of unknown identity. This classification type requires that researcher select training areas for use as the bases for classification. Various comparison are then used to determine if specific pixel qualifies as class members.
Maximum likelihood classification algorithms assume that the statistics from each class in each band is normally distributed and calculates the probability that a given pixel belongs to the specific classes. Maximum likelihood classification assumes that the statistics for each class in each band are normally distributed and calculates the probability that a given pixel belongs to a specific class. Unless you select a probability threshold, all pixels are classified. Each pixel is assigned to the class that has the highest probability (that is, the maximum likelihood). If the highest probability is smaller than a threshold you specify, the pixel remains unclassified. (Anderson, et al, 2009). The final classification result produced in to five LULC classes of built up area, agricultural land, forest, bare land and water body.
Table 3. Descriptions of lulc types identified in study area.
S_no | LU/LC class | Description of land use classes |
1 | Built up area | Urban areas and permanent residential areas of varied pattern for example, cities, transportation, power, and communications facilities |
2 | Agricultural land | The land area that is either arable under perm ant crops or land used primarily for production of food and fiber |
3 | Bare land | Land of limited ability to support life and in which less than one-third of the area has Vegetation or other cover |
4 | Forest | Refer to all plants and trees collectively in a specific region |
5 | Water body | Areas covered with water such as lake and rivers |
4. Results and Discussions
As indicated in the classification scheme built up area, forest, Agricultural land, Bare land and water body, are the major LULC classes for the study periods. Land use and land cover changes has a wide range of impacts on environmental and landscape attributes including the quality of water, land and air resources, ecosystem processes and functions (Rimal, 2011). Therefore, the use of remote sensing data and analysis techniques provide accurate, timely and detailed information for detecting and monitoring changes in land cover and land use.
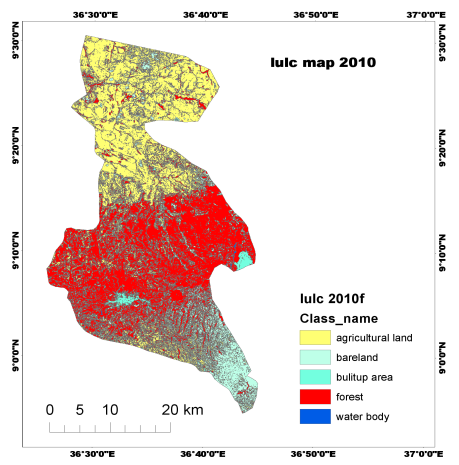
Figure 3. Land use land cover map of 2010.
Table 4. Descriptions of lulc types identified in study area 2010.
S_no | Lulc class name | Area (ha) | Percent (%) |
1 | Built up area | 2498 | 2.08 |
2 | Agricultural land | 43224 | 35.5 |
3 | Bare land | 22889 | 19 |
4 | Forest | 51415 | 43.8 |
5 | Water body | 18 | 0.016 |
Total | | 120044 | 100 |
Table 4 the classification result of the Land sat 8 2010 image revealed that forest constituted the largest proportion of land with a value of 51415 ha (43.8 %) agricultural land which accounts for 43224 ha (35.5 %) followed by bare land 22889 ha (19 %) and built up area and water body constituted 2.08 % and 0.016 % respectively.
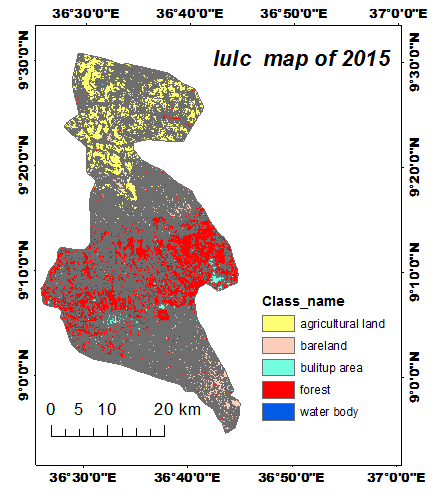
Figure 4. Land use land cover map of 2015.
Table 5. Descriptions of lulc types identified in study area 2015.
S_no | Lulc class name | Area (ha) | Percent (%) |
1 | Built up area | 3877 | 3.4 |
2 | Agricultural land | 34149 | 37.5 |
3 | Bare land | 25121 | 22 |
4 | Forest | 49589 | 38.3 |
5 | Water body | 12 | 0.01 |
Total | | 113748 | 100 |
Table 5 the classification result of the Land sat 8 2015 image revealed that Forest constituted the largest proportion of land with a value of 49589 ha (38.3%), agricultural land which accounts for 34149 ha (37.5 %) followed by bare land 26121 ha (22 %) and built up area and water body constituted 3.4% and 0.1% respectively.
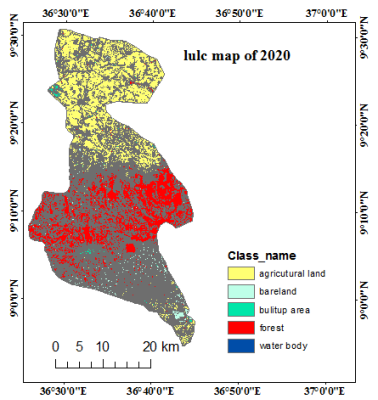
Figure 5. Land use land cover map of Guto wayu 2020.
Table 6. Descriptions of lulc types identified in study area 2020.
S_no | Lulc class name | Area(ha) | Percent (%) |
1 | Built up area | 5570 | 4.13 |
2 | Agricultural land | 49785 | 40.8 |
3 | Bare land | 32120 | 23.8 |
4 | Forest | 47535 | 35.2 |
5 | Water body | 8 | 0.006 |
Total | | 135018 | 100 |
As
Table 6 shows the classification result of the Land sat 8 2020 image revealed that Agricultural land constituted the largest proportion of land with a value of 49785 ha (40.8 %), forest which accounts for 47535 ha (35.2 %) followed by bare land 32120 ha (23.8 %) and built up area and water body constituted 4.13 % and 0.006 % respectively.
5. Conclusion and Recommendation
5.1. Conclusions
Based on the overall of the project works, it is possible to conclude the following points. Remotely sensed images are vital in land use/land cover change detection as it provides spatial and temporal information of the land use land cover condition of the Guto wayu woreda. it has become one of the major problems for environmental change as well as natural resource management.
Land use/land cover is very dynamic in nature and has to be monitored at regular intervals for sustainable development thus it has become a central component in current strategies for managing natural resources. The results of this study revealed the existence of significant land use and land cover changes in the last 10 years.
The second ranked change is to be transition from forest area to bare land and agricultural land. This decreased is due to decreased awareness of public and bad governmental policies to reforestation programmed of the woreda is decreased. Aggregate the rate of change of Guto Wayu woreda from initial year to final (2010 to 2020) that is, only forest and water body has decreased in (-8.6%) and (-0.01%) respectively, while the rest classes namely built up area in +2.05%, bare land (+4.8%) and Agricultural land (+5.8%) has increased Expansion built up area and decreased public awareness for the forest / Plant vegetation.
Generally, geographic information system and remote sensing analysis enables for sustainable managements of LULC change planning, wise decision making, monitoring of urban expansion and development.
5.2. Recommendations
Land use land cover change (LULC) mapping and detection of changes shown here may not provide the real figure of classes due to low resolution of the imagery but it serves as a base to understand the patterns and magnitude of LULCCs in the area. Therefore such LU/LC detections using high resolution satellite images would be more dependable. Rapid settlement increase has played a major role affecting LULC change and there should be;
1) Strategic planning to monitor abrupt urban expansions of the woreda from concerned governmental and none governmental bodies (offices).
2) Strong family planning awareness creation campaigns with adequate health services from Concerned governmental and none governmental bodies (offices).
3) Promoting the development of none agricultural economy to the woreda peoples and conserving the forest by strong follow up and by creating reserved area for forest only.
4) Continuing the efforts of introducing family planning to make the people aware of consequences of population pressure on land resources should be carried out intensively.
5) Geographical information system and remote sensing technology for change detection analysis for the development of one country.
6) Ethiopian Government has given due attention for forest development and conservation considering its significance to the national economy, food security and sustainable development.
7) Advisable conserving and develop forest resource properly is important.
Abbreviations
GIS | Geographic Information Science |
RS | Remote Sensing |
LULC | Land Use/land Cover |
DEM | Digital Elevation Model |
USGS | United State Geological Survey |
GPS | Global Positioning System |
GCP | Ground Control Point |
ERDAS | Earth Resource Data Analysis System |
Ha | Hectare |
NMA | National Meteorological Agency |
EMA | Ethiopian Mapping Agency |
Author Contributions
Tariku Tamiru is the sole author. The author read and approved the final manuscript.
Conflicts of Interest
The author declares no conflicts of interest.
References
| [1] |
Hudson, N.W. (1995) Soil Conservation. 3rd Edition, Batsford, London, 392.
|
| [2] |
Lambin, 1997, as cited Bewket, Teferi, Uhlenbrook, Wenningeret.al, 2012.
|
| [3] |
National and international conservation and management of biological diversity (Wilkie and Finn, 1996).
|
| [4] |
Land use change is any change in the physical, biological or chemical conditions of the resources due to management to satisfy human interests (Quentin et al. 2006).
|
| [5] |
Land cover class refers the physical characteristics of the earth’s, including those created by solely by human activities such as settlement (Billah and Anisur, 2004).
|
| [6] |
Every parcel of land on the Earth’s surface is unique in the cover it possesses (Meyer, 1999).
|
| [7] |
Natural events such as weather, flooding, fire, climate fluctuations and ecosystem dynamics may also initiate modifications upon land cover Wogderes (2014, as cited in MaD CAT manual, 2011).
|
| [8] |
Globally, land cover today is altered principally by direct human use: (Meyer, 1995).
|
| [9] |
Gas emissions and other processes that come together to affect climate and biosphere (Riebsame, Meyer, and Turner, 1994).
|
| [10] |
Impacts of land use and land cover change on ecosystem service values (Rimal, 2011).
|
| [11] |
Maktav et al (2005) showed that traditional data collection methods such as demographic data, census and sample maps were not satisfactory for the purpose of urban land use management.
|
| [12] |
Sensing and recording of either reflected or emitted energy or the information being processed, analyzed and applied to a given problem (Campbell, 2002).
|
| [13] |
Sensors record the reflected radiation from the surface of the earth and will be used for many analyses; one of these is land use land cover change analysis (Lelesand and Kiefer, 1994).
|
| [14] |
General purpose classification scheme compatible with remote sensing data has been by (Anderson, et al, 2009) which is also referred to as USGS classification scheme.
|
| [15] |
Land cover and land use categories, from raw remotely sensed digital satellite data (Lu and Weng, 2007, Weng, 2012).
|
| [16] |
accuracy assessments are usually limited to the very recent image that serves as a reference using ground control points (GCPs) collected as part of the data required for the change analysis Wegderes (2014, as cited in Hussein Ali, 2009, Rechards, (1999)).
|
| [17] |
Unsupervised classification is computer-automated and it enables user to specify some parameters that the computer uses to uncover statistical patterns that are inherent in the data (Diday, (1994)).
|
| [18] |
Land use land cover change may result in environmental, social and economic impacts of greater damage than benefit to the area (Moshen A, 1999), (Singh, 1989).
|
| [19] |
Macleod and Congation, (1998) aspects of change detection which are important when monitoring natural resources.
|
| [20] |
Qualitative description and parameterization of factors which drive changes in land use/land cover as well as the integration of their consequences and feed backs (Hussein Ali, (2009).
|
| [21] |
The level of accuracy that are sufficient for the ways we want to use the map information (Awotwi, 2009).
|
| [22] |
The probability of a reference pixel being correctly classified and is a measure of Omission error. (Jensen 2003).
|
Cite This Article
-
ACS Style
Tamiru, T. Land Use Land Cover Change Detection Analysis Using GIS and Remote Sensing Techinques: In Case of Guto Wayu Woreda, Weastern Ethiopia. Am. J. Remote Sens. 2025, 13(1), 1-12. doi: 10.11648/j.ajrs.20251301.11
 Copy
|
Copy
|
 Download
AMA Style
Tamiru T. Land Use Land Cover Change Detection Analysis Using GIS and Remote Sensing Techinques: In Case of Guto Wayu Woreda, Weastern Ethiopia. Am J Remote Sens. 2025;13(1):1-12. doi: 10.11648/j.ajrs.20251301.11
Copy
|
Download
-
@article{10.11648/j.ajrs.20251301.11,
  author = {Tariku Tamiru},
  title = {Land Use Land Cover Change Detection Analysis Using GIS and Remote Sensing Techinques: In Case of Guto Wayu Woreda, Weastern Ethiopia
},
  journal = {American Journal of Remote Sensing},
  volume = {13},
  number = {1},
  pages = {1-12},
  doi = {10.11648/j.ajrs.20251301.11},
  url = {https://doi.org/10.11648/j.ajrs.20251301.11},
  eprint = {https://article.sciencepublishinggroup.com/pdf/10.11648.j.ajrs.20251301.11},
  abstract = {This project examines the use of GIS and RS in mapping land use land cover change in Guto Wayu woreda between 2010 and 2020 so as to detect and analyze the change that has taken in the area between these periods. In order to achieve the Satellite of landsat have been obtained and preprocessing using EARDAS IMAGINE. The maximum likelhood algorism of supervised Image classification has been used to generate land use land cover maps and change detection. Aggregate rate of changes of Land use and land cover of Guto Wayu woreda resulted that considerable change has occurred within ten (10) years from 2010 to 2020) that is only forest and water body has decreased in (-8.6%) and(-0.01%) respectively, while the rest classes namely built up area in +2.05%, bare land (+4.8%) and Agricultural land (+5.8%) has increased Expansion of built up area and decreased public awareness for the forest / Plant vegetation.
},
 year = {2025}
}
Copy
|
Download
-
TY  - JOUR
T1  - Land Use Land Cover Change Detection Analysis Using GIS and Remote Sensing Techinques: In Case of Guto Wayu Woreda, Weastern Ethiopia

AU  - Tariku Tamiru
Y1  - 2025/04/10
PY  - 2025
N1  - https://doi.org/10.11648/j.ajrs.20251301.11
DO  - 10.11648/j.ajrs.20251301.11
T2  - American Journal of Remote Sensing
JF  - American Journal of Remote Sensing
JO  - American Journal of Remote Sensing
SP  - 1
EP  - 12
PB  - Science Publishing Group
SN  - 2328-580X
UR  - https://doi.org/10.11648/j.ajrs.20251301.11
AB  - This project examines the use of GIS and RS in mapping land use land cover change in Guto Wayu woreda between 2010 and 2020 so as to detect and analyze the change that has taken in the area between these periods. In order to achieve the Satellite of landsat have been obtained and preprocessing using EARDAS IMAGINE. The maximum likelhood algorism of supervised Image classification has been used to generate land use land cover maps and change detection. Aggregate rate of changes of Land use and land cover of Guto Wayu woreda resulted that considerable change has occurred within ten (10) years from 2010 to 2020) that is only forest and water body has decreased in (-8.6%) and(-0.01%) respectively, while the rest classes namely built up area in +2.05%, bare land (+4.8%) and Agricultural land (+5.8%) has increased Expansion of built up area and decreased public awareness for the forest / Plant vegetation.

VL  - 13
IS  - 1
ER  -
Copy
|
Download