Abstract
This paper evaluates the performance of seven machine learning (ML) algorithms for anomaly detection using the Numenta Anomaly Benchmark (NAB) dataset. The algorithms examined include Logistic Regression (LR), Decision Tree (DT), Random Forest (RF), Support Vector Machines (SVM), Neural Networks (NN), K-Nearest Neighbors (KNN) and Naive Bayes (NB). Two distinct experimental setups were conducted, one evaluating models without additional features and another incorporating created features such as lagged values, rolling window statics, difference values and time based features like hour, day of the year and weekend. The models were trained using the NAB dataset, and their effectiveness in detecting anomalies was assessed. Performance was rigorously evaluated using standard classification metrics like Precision, Recall and F1-Score. In the experiment conducted without additional features, the NN model demonstrated the highest overall performance with an F1-Score of 0.0626526, Precision of 0.0542125 and Recall of 0.0961538 predicting anomalies in 9 files. LR achieved the highest Recall of 0.192029 but with a low Precision of 0.0226541, indicating it often predicted anomalies in a large number of files (38 files) at the cost of high false positives. KNN consistently failed to detect any anomalies across both experiments. The incorporation of additional features generally led to a degradation in performance across most models. For instance, the NN F1-Score decreased to 0.0377358 with features, suggesting that the added features did not enhance and in some cases hindered the models’ anomaly detection capabilities. Some models like LR and SVM also showed an increase in files with errors when features were included. The analysis indicates that while some models are effective at recalling anomalies, they tend to classify a significant amount of normal data as anomaly (low precision). The study highlights the critical impact of feature engineering on anomaly detection performance.
Keywords
Machine Learning (ML), Numenta Anomaly Benchmark (NAB), Dataset, Logistic Regression (LR), Decision Tree (DT),
Random Forest (RF), Support Vector Machines (SVM), Neural Networks (NN), K-Nearest Neighbors (KNN), Naive Bayes (NB)
1. Introduction
Streaming time series anomaly detection is a critical component of real time analytics enabling the identification of unusual patterns in continuously evolving data streams. Unlike static anomaly detection methods, this domain requires dynamic adaption to changing trends and patterns. ML models particularly online learning algorithms and deep neural networks play a vital role in applications ranging from financial fraud detection and industrial predictive maintenance to Cyber security threat monitoring.
| [1] | P. Boniol, Q. Liu, M. Huang, T. Palpanas, and J. Paparrizos, “Dive into Time-Series Anomaly Detection: A Decade Review,”. Accessed: Jun. 07, 2025. Available:
https://arxiv.org/abs/2412.20512v1 |
| [16] | F. T. Liu, K. M. Ting, and Z.-H. Zhou, “Isolation Forest,” 2008 Eighth IEEE International Conference on Data Mining, 2008. https://doi.org/10.1109/ICDM.2008.17 |
[1, 16]
As streaming data complexity grows, future advancements are expected to focus on self learning models that autonomously refine detection accuracy, enhancing efficiency and reliability across industries
| [2] | T. Markovic, A. Dehlaghi-Ghadim, M. Leon, A. Balador, and S. Punnekkat, “Time-series Anomaly Detection and Classification with Long Short-Term Memory Network on Industrial Manufacturing Systems,” presented at the 18th Conference on Computer Science and Intelligence Systems, Sep. 2023, pp. 171–181.
https://doi.org/10.15439/2023F5263 |
| [15] | M. Goldstein and S. Uchida, “A Comparative Evaluation of Unsupervised Anomaly Detection Algorithms,” PLoS ONE, vol. 11, no. 4, 2016.
https://doi.org/10.1371/journal.pone.0152173 |
| [8] | Xu, H., Chen, W., Zhao, N., et al., “Unsupervised Anomaly Detection via Variational Autoencoder for Seasonal KPIs,” WWW, 2018. https://doi.org/10.1145/3178876.3185996 |
[2, 15, 8]
.
Research in this field has extensively explored ML techniques, including LR, DT, RF, SVM, NN, KNN, NB.
| [1] | P. Boniol, Q. Liu, M. Huang, T. Palpanas, and J. Paparrizos, “Dive into Time-Series Anomaly Detection: A Decade Review,”. Accessed: Jun. 07, 2025. Available:
https://arxiv.org/abs/2412.20512v1 |
| [10] | A. Lavin and S. Ahmad,“Evaluating Real-Time Anomaly Detection AlgorithmsThe Numenta Anomaly Benchmark,”2015 IEEE 14th International Conference on Machine Learning and Applications (ICMLA), 2015.
https://doi.org/10.1109/ICMLA.2015.141 |
| [11] | D. J. Tax and R. P. Duin, “Support Vector Data Description,” Machine Learning, vol. 54, no. 1, pp. 45–66, 2004.
https://doi.org/10.1023/B:MACH.0000008084.60811.49 |
[1, 10, 11]
Feature engineering significantly enhances model performance by extracting meaningful attributes such as statistical summaries, frequency domain transformations and temporal dependencies.
| [3] | Chalapathy, R., & Chawla, S., “Deep Learning for Anomaly Detection: A Survey,” ACM Computing Surveys, vol. 54, no. 2, 2021. https://doi.org/10.1145/3439950 |
| [12] | V. Chandola, A. Banerjee, and V. Kumar, “Anomaly Detection: A Survey,” ACM Computing Surveys, vol. 41, no. 3, pp. 1–58, 2009. https://doi.org/10.1145/1541880.1541882 |
| [14] | R. Chalapathy and S. Chawla, “Deep Learning for Anomaly Detection: A Survey,” arXiv preprint, 2019.
https://doi.org/10.48550/arXiv.1901.03407 |
[3, 12, 14]
Performance evaluation relies critical on metrics like Precision, Recall and F1-Score to balance false positives and false negatives
| [4] | A. Tasnim, M. Saiduzzaman, M. A. Rahman, J. Akhter, and A. S. M. M. Rahaman, “Performance Evaluation of Multiple Classifiers for Predicting Fake News,” J. Comput. Commun., vol. 10, no. 9, Art. no. 9, Sep. 2022,
https://doi.org/10.4236/jcc.2022.109001 |
| [12] | V. Chandola, A. Banerjee, and V. Kumar, “Anomaly Detection: A Survey,” ACM Computing Surveys, vol. 41, no. 3, pp. 1–58, 2009. https://doi.org/10.1145/1541880.1541882 |
| [13] | M. Ahmed, A. N. Mahmood, and J. Hu, “A Survey of Network Anomaly Detection Techniques,” Journal of Network and Computer Applications, vol. 60, pp. 19–31, 2016.
https://doi.org/10.1016/j.jnca.2015.11.016 |
[4, 12, 13]
.
While feature engineering is frequently touted as essential for time series anomaly detection
| [3] | Chalapathy, R., & Chawla, S., “Deep Learning for Anomaly Detection: A Survey,” ACM Computing Surveys, vol. 54, no. 2, 2021. https://doi.org/10.1145/3439950 |
| [9] | Li, Y., Yu, R., Shahabi, C., & Liu, Y., “Diffusion Convolutional Recurrent Neural Network for Traffic Forecasting,” ICLR, 2018. https://doi.org/10.48550/arXiv.1707.01926 |
[3, 9]
empirical evidence of its consistent impact in streaming environments remains limited. This study rigorously tests this assumption by evaluating seven ML algorithms on the NAB benchmark under two configurations: raw data versus engineered features. Its purpose is to resolve weather the resource intensive process of feature engineering universally justifies accuracy gains, a question critical for efficiency focused domains like Cyber security. The core research problem focuses on:
Which algorithm achieves the highest anomaly detection accuracy on NAB?
How does feature engineering (e.g., lagged values, rolling window statics, time based features) impact performance?
This works’ significance lies in its potential to optimize anomaly detection for critical applications like Cyber security, fraud prevention and IoT predictive maintenance. By rigorously quantifying the impact of feature engineering and model selection, it provides actionable insights for deploying efficient ML driven solutions.
| [2] | T. Markovic, A. Dehlaghi-Ghadim, M. Leon, A. Balador, and S. Punnekkat, “Time-series Anomaly Detection and Classification with Long Short-Term Memory Network on Industrial Manufacturing Systems,” presented at the 18th Conference on Computer Science and Intelligence Systems, Sep. 2023, pp. 171–181.
https://doi.org/10.15439/2023F5263 |
| [11] | D. J. Tax and R. P. Duin, “Support Vector Data Description,” Machine Learning, vol. 54, no. 1, pp. 45–66, 2004.
https://doi.org/10.1023/B:MACH.0000008084.60811.49 |
[2, 11]
.
We conduct a controlled experiment structured as follows:
1) Experiment 1: Models trained on raw NAB data (baseline).
2) Experiment 2: Models trained on engineered features (lagged values, rolling statistics, differencing and temporal indicators).
Performance is evaluated using Precision, Recall and F1-Score to ensure balanced assessment.
Contrary to initial hypothesis, this work demonstrates that feature engineering does not categorically improve anomaly detection accuracy; instead it reveals that without features achieved better performance that with engineered features, challenging conventional outcomes.
2. Related Work
Anomaly detection in time series data has emerged as a critical research area due to its broad applications across various domains, including Cyber security, IoT, infrastructure monitoring and financial fraud detection. The complexity and dynamic nature of time series data, characterized by temporal dependency trends and seasonality pose unique challenges for effective anomaly identification. Consequently a vast body of literature has explored diverse methodologies with machine learning algorithms playing pivotal role.
Early approaches to time series anomaly detection often relied on statistical methods forecasting models or distance based techniques. However, with the advent of advanced machine learning and deep learning, more sophisticated models have been developed to capture intricate patterns and deviations
| [4] | A. Tasnim, M. Saiduzzaman, M. A. Rahman, J. Akhter, and A. S. M. M. Rahaman, “Performance Evaluation of Multiple Classifiers for Predicting Fake News,” J. Comput. Commun., vol. 10, no. 9, Art. no. 9, Sep. 2022,
https://doi.org/10.4236/jcc.2022.109001 |
| [5] | Q. Liu, P. Boniol, T. Palpanas, and J. Paparrizos, “Time-Series Anomaly Detection: Overview and New Trends,” Proc. VLDB Endow., vol. 17, no. 12, pp. 4229–4232, Aug. 2024,
https://doi.org/10.14778/3685800.3685842 |
| [6] | “An anomaly detection framework anyone can use,” MIT News | Massachusetts Institute of Technology. Accessed: Jun. 06, 2025. Available:
https://news.mit.edu/2025/anomaly-detection-framework-anyone-can-use-sarah-alnegheimish-0528 |
| [10] | A. Lavin and S. Ahmad,“Evaluating Real-Time Anomaly Detection AlgorithmsThe Numenta Anomaly Benchmark,”2015 IEEE 14th International Conference on Machine Learning and Applications (ICMLA), 2015.
https://doi.org/10.1109/ICMLA.2015.141 |
[4-6, 10]
.
Comparative studies are crucial for understanding the relative strengths and weakness of different algorithms in specific contexts. These studies contribute to the understanding of which algorithm might be more suitable for certain types of time series data or application scenarios
.
A key aspect of anomaly detection in time series is feature engineering, which involves transforming raw data into meaningful representations that enhance a model’s ability to identify anomaly patterns. The importance of this step is underscored in various works.
| [5] | Q. Liu, P. Boniol, T. Palpanas, and J. Paparrizos, “Time-Series Anomaly Detection: Overview and New Trends,” Proc. VLDB Endow., vol. 17, no. 12, pp. 4229–4232, Aug. 2024,
https://doi.org/10.14778/3685800.3685842 |
| [7] | “(PDF) Feature Engineering for Transaction Anomalies.” Accessed: Jun. 06, 2025. Available:
https://www.researchgate.net/publication/388026453_Feature_Engineering_for_Transaction_Anomalies |
[5, 7]
The general consensus in the literature is that the effectiveness of anomaly detection models, especially for complex time series data, heavily depends on the richness and relevance of the feature set used. This includes creating features like lagged values, rolling window statistics and various time based indicators.
.
This paper builds upon existing literature by providing a direct comparative analysis of seven widely used machine learning algorithms LR, DT, RF, SVM, NN, KNN and NB specifically on the NAB dataset, and critically examines the impact of a defined set of engineered features on their anomaly detection performance. Our work directly addresses the need for empirical validation of feature engineering strategies and algorithm section for anomaly detection in streaming time series data utilizing standard evaluation metrics such as Precision, Recall and F1-Score to offer comprehensive insights.
3. Methodology
This study utilizes the NAB dataset, a widely recognized resource for evaluating anomaly detection algorithms on real world and artificial time series data. The dataset is meticulously organized into “data” and “labels” folders, facilitating a clear distinction between the time series observations and their corresponding anomaly time stamps.
3.1. Data Collection and Pre – Processing
The “data” folder comprises 58 ‘.csv’ files, totaling approximately 9.74 MB, categorized under various real world and artificial scenarios such as “artificialNoAnomaly”, “artificialWithAnomaly”, “realAdExchange”, “realAWSCloudwatch”, “realKnownCause”, “realTraffic” and “realTweets”. Each ‘.csv’ file contains time series observations.
For anomaly labeling, inside “labels” folders there is a file named “combined_labels.json”. This file defines anomalies for each ‘.csv’ file as specific timestamps, rather than time ranges, indicating precise anomaly points. For instance, an entry might appear as: “realTraffic/occupancy_t4013.csv”:” [“2015-09-16 08:09:00”, “2015-09-17 07:55:00”]”.
A custom Python program was developed to automate the data loading process. This program iterates through each folder within the “data” directory, loads the ‘.csv’ files in to pandas DataFrames, and integrates the anomaly information from the “combined_labels.json” file. A new boolean column, “is_anomaly” is added to each DataFrame and set to True for anomaly timestamps and False for otherwise there by preparing the data for supervised training.
A. Experimental Configurations
To comprehensively asses the impact of feature engineering on anomaly detection performance, two distinct experimental configurations were adopted:
1) Experiment Without Engineered Features
In this baseline configuration, the models were trained and evaluated solely on the raw time series values from the dataset. This approach aimed to establish a fundamental understanding of each algorithm’s capability to detect anomalies based purely on the original data, without any additional data transformations of feature augmentations.
2) Experiment With Engineered Features
For this configuration a rich set of features was created using a dedicated “create_time_series_features” function. These features were designed to enhence the temporal and statistical information available to the anomaly detection models:
Lagged Values: A 24 frame lagged value system was implemented creating 24 columns by shifting the original time series values backward in time. Lagged values are crucial for capturing temporal dependencies, allowing models to infer current behavior from past observations. They are instrumental in identifying trends, seasonality and sudden shifts in data which are often indicative of anomalies.
Rolling window statics: Various rolling window statics were computed including mean, standard deviation, minimum, maximum and median. These statics were calculated over fixed size moving windows of 3, 5, 10 and 24 data points. Rolling window statics effectively capture local trends and fluctuations making it easier to pinpoint localized anomalies that might not be apparent from global statistics. For example a sudden spike in rolling standard deviation or a significant drop in rolling mean would signal an unusual event.
Difference Values: Features representing the difference between consecutive data points were generated. Specifically, differences where calculated between the original value and the first lagged value, as well as between the original value and the third lagged value. This technique known as differentiation helps in removing trends and seasonality from the time series thereby making derivations more pronounced and easier for models to detect.
3.2. Model Training and Evaluation
The prepared DataFrames from both experimental configurations (with and without engineered features) were then fed to seven distinct machine learning algorithms: LR, DT, RF, SVM, NN, KNN, and NB. Each algorithm was trained on the respective datasets to build models capable of identifying anomalies.
3.3. The Performance of Each Trained Model Was Evaluated Using Standard Classification Metrics
Precision: Measures the accuracy of positive
predictions that is out of all instances predicted as anomalies and how many were actually anomalies.
Recall: Measures the models ability to find all positive instances that are out of the actual anomalies and how many were correctly identified.
F1-Score: The harmonic mean of Precision and Recall providing a single metric that balances both.
The results of the anomaly detection process including the performance metrics for each algorithm in both experimental setups were systematically logged for analysis and comparison.
4. Results
This report presents a comparative analysis of the performance of seven machine learning models DT, KNN, LR, NB, NN, RF and SVM for anomaly detection, considering two experimental setups: one without additional features and another with additional features. The evaluation is based on precision, recall, F1-score, number of files with anomalies predicted and number of files with errors.
B. Experiment 1: Without Additional Features
The following table summarizes the average metrics for each model when no additional features were used:
Table 1. Without Additional Features.
Model | Precision | Recall | F1-Score | Files with Anomaly Predicted | Files with Error |
NN | 0.0542125 | 0.0961538 | 0.0626526 | 9 | 0 |
DT | 0.0399573 | 0.0961538 | 0.0510073 | 26 | 0 |
RF | 0.0399573 | 0.0961538 | 0.0510073 | 25 | 0 |
LR | 0.0226541 | 0.192029 | 0.036729 | 38 | 6 |
NB | 0.0104642 | 0.115385 | 0.0180159 | 22 | 0 |
SVM | 0.00113332 | 0.00113332 | 0.00208509 | 31 | 6 |
KNN | 0 | 0 | 0 | 0 | 0 |
Key Observations (Without Features):
NN showed the best overall performance with the hugest F1-score (0.0626526) and highest precision (0.0542125), along with zero errors.
LR had the highest recall (0.192029) but very low precision (0.0226541) and 6 files with errors.
DT and RF performed similarly, with F1-scores of 0.0510073 and no errors.
KNN performed worst, with all metrics at 0, indicating no anomalies were detected.
C. Experiment 2: With Additional Features
D. The following table summarizes the average metrics for each model when additional features where incorporated: Table 2. Experiment 2: With Additional Features Table 2. With Additional Features.
Model | Precision | Recall | F1-Score | Files with Anomaly Predicted | Files with Error |
NN | 0.0377358 | 0.0377358 | 0.0377358 | 6 | 0 |
LR | 0.0116671 | 0.0942029 | 0.0194037 | 35 | 7 |
NB | 0.00669075 | 0.0377358 | 0.0102201 | 11 | 0 |
DT | 0.00503145 | 0.0283019 | 0.0081475 | 20 | 0 |
SVM | 0.000749625 | 0.00724638 | 0.0013587 | 8 | 7 |
RF | 0 | 0 | 0 | 1 | 0 |
KNN | 0 | 0 | 0 | 0 | 0 |
Key Observations With Features
NN still performed the best among the models, with the highest F1-score (0.0377358), even though its performance has decreased compared to the “with out features” scenario. It also maintains 0 errors.
Logistic Regression maintains a relatively higher recall (0.942029) but continues to have very low precision (0.0116671) and saw an increase in errors 7 files.
Naive Bayes shows a slight improvement in F1-score compared to SVM, but overall performance remains low.
Decision Tree performance significantly decreased in this setup.
Random Forest and KNN both report 0 for precision, recall and F1-score. Random Forest Predicted 1 anomaly, which implies it was a false positive while KNN predicted none.
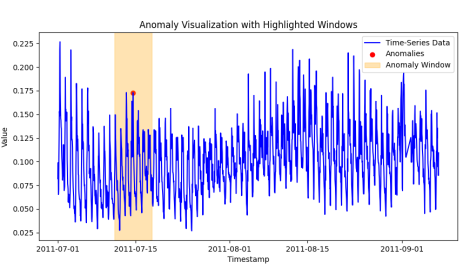
A graphical representation of loaded data and anomaly for file “exchange-2_cpc_results.csv”.
Figure 1. Sample anomaly graphical representation.
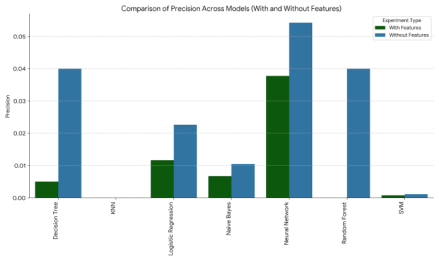
Figure 2. Precision Comparison With and With out Features.
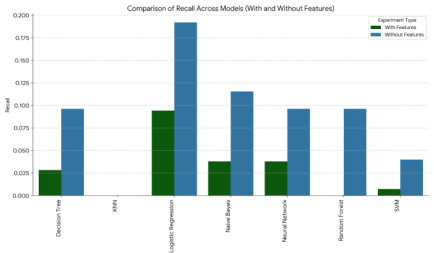
Figure 3. Recall Comparison With and With out Features.
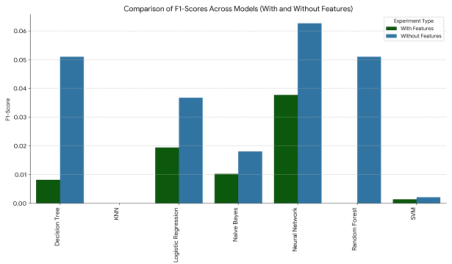
Figure 4. F1-Score Comparison With and With out Features.
5. Discussion
The comparison between the two experimental setups, with and without additional features reveals critical insight in to the impact of feature engineering on model performance for anomaly detection.
E. General Trends:
Across most models, the addition of the new features appears to have degraded performance in terms of precision, recall, and F1-score. This suggests that the added features might be irrelevant, noisy, or redundant, negatively impacting the models’ ability to learn distinct patterns for anomaly detection.
F. Model Specific Analysis:
NN: While still the top performer in both scenarios, its F1-score decreased from 0.0626526 with out features to 0.037358 with features. Both precision and recall also saw a drop. This indicates that the added features, while not introducing errors, did enhance its anomaly detection capabilities; in fact they hindered it. Its continued zero error rate is a positive, suggesting robustness despite performance degradation.
DT and RF: These models experienced a significant drop in performance with the addition of features. Their F1-Scores went from around 0.051 with out features to 0.008 DT and 0 for RF with features. This highlights their sensitivity to potentially unhelpful features, which might introduce noise or irrelevant dimensions, leading to poorer decision boundaries. RF, in particular completely failed to detect anomalies in the with features setup, reporting 0 for all key metrics.
LR: This model saw a decrease in F1-score from 0.036729 to 0.0194037 and recall from 0.192029 to 0.0942029 with features. Further more the number of files with errors increased from 6 to 7. This suggests that the added features not only reduced its detection capability but also introduced more instability.
NB: Similar to other models, NB also experienced a performance drop with features, with its F1-score decreasing from 0.0180159 to 0.0102201.
SVM: SVMs’ performance remained consistently poor across both scenarios, with minimal F1-scores, a consistent presence of errors 6 without features and 7 with features. The addition of features did not provide any benefit to this model.
KNN: KNN remained ineffective in both experiments, showing 0 for all performance metrics and detecting no anomalies. This indicates a fundamental inability to perform anomaly detection on this dataset, regardless of the feature set.
G. Impact of Features:
The overall degradation in performance when features were added suggest that the chosen additional features might not be discriminatory for anomaly detection in this context. It is possible that they introduce more noise than signal or that they are highly correlated with existing features without providing new valuable information. The increase in errors for LR and SVM in the with features scenario also points to potential issues with feature scaling, outliers within the new features or model robustness in handling these specific features.
6. Conclusion
The results strongly suggest that the addition of the new features has a detrimental effect on the anomaly detection performance of most evaluated models. The experiment conducted with out additional features generally yielded better or comparable results across key metrics precision, recall and F1-score.
Specifically the NN model performed the best in both scenarios but its performance notably higher when trained without the additional features. This indicates that for this particular dataset and anomaly detection task a simpler feature set or different feature engineering approach is required.
H. Future work should focus on:
Carefully evaluating and selecting highly discriminatory features, or exploring different feature transformation techniques is crucial.
Re tuning model hyper parameters for the with features dataset might mitigate some of the observed performance degradation.
A deeper investigation into the files causing errors for LR and SVM in both scenarios could reveal underlying model limitations.
Overall, the initial set of features used in without features experiment appears more effective for anomaly detection with these models compared to additional features introduced in the second experiment.
Abbreviations
ML | Machine Learning |
NAB | Numenta Anomaly Benchmark |
LR | Logistic Regression |
DT | Decision Tree |
RF | Random Forest |
SVM | Support Vector Machine |
NN | Neural Networ |
KNNK | Nearest Neighbors |
NB | Naïve Bayes |
CSV | Comma Separated Values |
JSONJ | avaScript Object Notatio |
F1 | ScoreHarmonic Mean of Precision and Recall |
AI | Artificial Intelligence |
IoT | Internet of Things |
ICMLA | International Conference on Machine Learning and Applications |
LSTM | Long Short Term Memory |
Author Contributions
Abel Channie Demeke: Data curation, Formal Analysis, Funding acquisition, Investigation, Methodology, Supervision, Validation, Writing – review & editing
Conflicts of Interest
The author declares no conflicts of interest.
References
| [1] |
P. Boniol, Q. Liu, M. Huang, T. Palpanas, and J. Paparrizos, “Dive into Time-Series Anomaly Detection: A Decade Review,”. Accessed: Jun. 07, 2025. Available:
https://arxiv.org/abs/2412.20512v1
|
| [2] |
T. Markovic, A. Dehlaghi-Ghadim, M. Leon, A. Balador, and S. Punnekkat, “Time-series Anomaly Detection and Classification with Long Short-Term Memory Network on Industrial Manufacturing Systems,” presented at the 18th Conference on Computer Science and Intelligence Systems, Sep. 2023, pp. 171–181.
https://doi.org/10.15439/2023F5263
|
| [3] |
Chalapathy, R., & Chawla, S., “Deep Learning for Anomaly Detection: A Survey,” ACM Computing Surveys, vol. 54, no. 2, 2021.
https://doi.org/10.1145/3439950
|
| [4] |
A. Tasnim, M. Saiduzzaman, M. A. Rahman, J. Akhter, and A. S. M. M. Rahaman, “Performance Evaluation of Multiple Classifiers for Predicting Fake News,” J. Comput. Commun., vol. 10, no. 9, Art. no. 9, Sep. 2022,
https://doi.org/10.4236/jcc.2022.109001
|
| [5] |
Q. Liu, P. Boniol, T. Palpanas, and J. Paparrizos, “Time-Series Anomaly Detection: Overview and New Trends,” Proc. VLDB Endow., vol. 17, no. 12, pp. 4229–4232, Aug. 2024,
https://doi.org/10.14778/3685800.3685842
|
| [6] |
“An anomaly detection framework anyone can use,” MIT News | Massachusetts Institute of Technology. Accessed: Jun. 06, 2025. Available:
https://news.mit.edu/2025/anomaly-detection-framework-anyone-can-use-sarah-alnegheimish-0528
|
| [7] |
“(PDF) Feature Engineering for Transaction Anomalies.” Accessed: Jun. 06, 2025. Available:
https://www.researchgate.net/publication/388026453_Feature_Engineering_for_Transaction_Anomalies
|
| [8] |
Xu, H., Chen, W., Zhao, N., et al., “Unsupervised Anomaly Detection via Variational Autoencoder for Seasonal KPIs,” WWW, 2018.
https://doi.org/10.1145/3178876.3185996
|
| [9] |
Li, Y., Yu, R., Shahabi, C., & Liu, Y., “Diffusion Convolutional Recurrent Neural Network for Traffic Forecasting,” ICLR, 2018.
https://doi.org/10.48550/arXiv.1707.01926
|
| [10] |
A. Lavin and S. Ahmad,“Evaluating Real-Time Anomaly Detection AlgorithmsThe Numenta Anomaly Benchmark,”2015 IEEE 14th International Conference on Machine Learning and Applications (ICMLA), 2015.
https://doi.org/10.1109/ICMLA.2015.141
|
| [11] |
D. J. Tax and R. P. Duin, “Support Vector Data Description,” Machine Learning, vol. 54, no. 1, pp. 45–66, 2004.
https://doi.org/10.1023/B:MACH.0000008084.60811.49
|
| [12] |
V. Chandola, A. Banerjee, and V. Kumar, “Anomaly Detection: A Survey,” ACM Computing Surveys, vol. 41, no. 3, pp. 1–58, 2009.
https://doi.org/10.1145/1541880.1541882
|
| [13] |
M. Ahmed, A. N. Mahmood, and J. Hu, “A Survey of Network Anomaly Detection Techniques,” Journal of Network and Computer Applications, vol. 60, pp. 19–31, 2016.
https://doi.org/10.1016/j.jnca.2015.11.016
|
| [14] |
R. Chalapathy and S. Chawla, “Deep Learning for Anomaly Detection: A Survey,” arXiv preprint, 2019.
https://doi.org/10.48550/arXiv.1901.03407
|
| [15] |
M. Goldstein and S. Uchida, “A Comparative Evaluation of Unsupervised Anomaly Detection Algorithms,” PLoS ONE, vol. 11, no. 4, 2016.
https://doi.org/10.1371/journal.pone.0152173
|
| [16] |
F. T. Liu, K. M. Ting, and Z.-H. Zhou, “Isolation Forest,” 2008 Eighth IEEE International Conference on Data Mining, 2008.
https://doi.org/10.1109/ICDM.2008.17
|
| [17] |
S. Singh, S. S. Choudhary, and S. Bhavishya, “Feature Selection Effects on Classification Algorithms,” International Journal of Engineering Research & Technology, vol. 7, no. 2, 2018.
https://doi.org/10.17577/IJERTV7IS020109
|
Cite This Article
-
APA Style
Demeke, A. C. (2026). Anomaly Detection on Numenta Anomaly Benchmark Data Set Using Multiple Machine Learning Algorithms and Impact of Engineered Features on Performance. American Journal of Robotics and Intelligent Systems, 1(1), 19-26. https://doi.org/10.11648/j.ajris.20260101.13
 Copy
|
Copy
|
 Download
ACS Style
Demeke, A. C. Anomaly Detection on Numenta Anomaly Benchmark Data Set Using Multiple Machine Learning Algorithms and Impact of Engineered Features on Performance. Am. J. Rob. Intell. Syst. 2026, 1(1), 19-26. doi: 10.11648/j.ajris.20260101.13
Copy
|
Download
AMA Style
Demeke AC. Anomaly Detection on Numenta Anomaly Benchmark Data Set Using Multiple Machine Learning Algorithms and Impact of Engineered Features on Performance. Am J Rob Intell Syst. 2026;1(1):19-26. doi: 10.11648/j.ajris.20260101.13
Copy
|
Download
-
@article{10.11648/j.ajris.20260101.13,
  author = {Abel Channie Demeke},
  title = {Anomaly Detection on Numenta Anomaly Benchmark Data Set Using Multiple Machine Learning Algorithms and Impact of Engineered Features on Performance},
  journal = {American Journal of Robotics and Intelligent Systems},
  volume = {1},
  number = {1},
  pages = {19-26},
  doi = {10.11648/j.ajris.20260101.13},
  url = {https://doi.org/10.11648/j.ajris.20260101.13},
  eprint = {https://article.sciencepublishinggroup.com/pdf/10.11648.j.ajris.20260101.13},
  abstract = {This paper evaluates the performance of seven machine learning (ML) algorithms for anomaly detection using the Numenta Anomaly Benchmark (NAB) dataset. The algorithms examined include Logistic Regression (LR), Decision Tree (DT), Random Forest (RF), Support Vector Machines (SVM), Neural Networks (NN), K-Nearest Neighbors (KNN) and Naive Bayes (NB). Two distinct experimental setups were conducted, one evaluating models without additional features and another incorporating created features such as lagged values, rolling window statics, difference values and time based features like hour, day of the year and weekend. The models were trained using the NAB dataset, and their effectiveness in detecting anomalies was assessed. Performance was rigorously evaluated using standard classification metrics like Precision, Recall and F1-Score. In the experiment conducted without additional features, the NN model demonstrated the highest overall performance with an F1-Score of 0.0626526, Precision of 0.0542125 and Recall of 0.0961538 predicting anomalies in 9 files. LR achieved the highest Recall of 0.192029 but with a low Precision of 0.0226541, indicating it often predicted anomalies in a large number of files (38 files) at the cost of high false positives. KNN consistently failed to detect any anomalies across both experiments. The incorporation of additional features generally led to a degradation in performance across most models. For instance, the NN F1-Score decreased to 0.0377358 with features, suggesting that the added features did not enhance and in some cases hindered the models’ anomaly detection capabilities. Some models like LR and SVM also showed an increase in files with errors when features were included. The analysis indicates that while some models are effective at recalling anomalies, they tend to classify a significant amount of normal data as anomaly (low precision). The study highlights the critical impact of feature engineering on anomaly detection performance.},
 year = {2026}
}
Copy
|
Download
-
TY  - JOUR
T1  - Anomaly Detection on Numenta Anomaly Benchmark Data Set Using Multiple Machine Learning Algorithms and Impact of Engineered Features on Performance
AU  - Abel Channie Demeke
Y1  - 2026/02/24
PY  - 2026
N1  - https://doi.org/10.11648/j.ajris.20260101.13
DO  - 10.11648/j.ajris.20260101.13
T2  - American Journal of Robotics and Intelligent Systems
JF  - American Journal of Robotics and Intelligent Systems
JO  - American Journal of Robotics and Intelligent Systems
SP  - 19
EP  - 26
PB  - Science Publishing Group
UR  - https://doi.org/10.11648/j.ajris.20260101.13
AB  - This paper evaluates the performance of seven machine learning (ML) algorithms for anomaly detection using the Numenta Anomaly Benchmark (NAB) dataset. The algorithms examined include Logistic Regression (LR), Decision Tree (DT), Random Forest (RF), Support Vector Machines (SVM), Neural Networks (NN), K-Nearest Neighbors (KNN) and Naive Bayes (NB). Two distinct experimental setups were conducted, one evaluating models without additional features and another incorporating created features such as lagged values, rolling window statics, difference values and time based features like hour, day of the year and weekend. The models were trained using the NAB dataset, and their effectiveness in detecting anomalies was assessed. Performance was rigorously evaluated using standard classification metrics like Precision, Recall and F1-Score. In the experiment conducted without additional features, the NN model demonstrated the highest overall performance with an F1-Score of 0.0626526, Precision of 0.0542125 and Recall of 0.0961538 predicting anomalies in 9 files. LR achieved the highest Recall of 0.192029 but with a low Precision of 0.0226541, indicating it often predicted anomalies in a large number of files (38 files) at the cost of high false positives. KNN consistently failed to detect any anomalies across both experiments. The incorporation of additional features generally led to a degradation in performance across most models. For instance, the NN F1-Score decreased to 0.0377358 with features, suggesting that the added features did not enhance and in some cases hindered the models’ anomaly detection capabilities. Some models like LR and SVM also showed an increase in files with errors when features were included. The analysis indicates that while some models are effective at recalling anomalies, they tend to classify a significant amount of normal data as anomaly (low precision). The study highlights the critical impact of feature engineering on anomaly detection performance.
VL  - 1
IS  - 1
ER  -
Copy
|
Download