
Cement is a widely used hydraulic binder composed primarily of calcium, silicon, aluminum, and iron oxides. This present work examines the plasma characteristics of cement sample through the analysis of neutral iron (Fe I) emission lines recorded using, laser-induced breakdown spectroscopy (LIBS). A Q-switched Nd: YAG laser, was used for plasma generation operating at a wavelength of 266 nm, with a pulse duration of 8 ns and a repetition rate of 10 Hz. The laser pulse energy was varied from 10 to 32 mJ. Emission features from Several neutral and ionic species were identified in the cement plasma, Four Fe I spectral lines were then used to estimate the electron temperature and electron density from the spectroscopic measurements at different laser pulse energies, and 200 ns delay. The Debye length and Debye number were subsequently calculated from the obtained plasma parameters. The results showed that increasing the laser pulse energy enhanced the plasma emission intensity and affected the plasma parameters. The obtained results demonstrate the applicability of Fe I spectral lines for characterizing the plasma generated from cement using LIBS and provide insight into the fundamental plasma properties under different laser excitation energies.
| Published in | American Journal of Physics and Applications (Volume 14, Issue 5) |
| DOI | 10.11648/j.ajpa.20261405.12 |
| Page(s) | 91-98 |
| Creative Commons |
This is an Open Access article, distributed under the terms of the Creative Commons Attribution 4.0 International License (http://creativecommons.org/licenses/by/4.0/), which permits unrestricted use, distribution and reproduction in any medium or format, provided the original work is properly cited. |
| Copyright |
Copyright © The Author(s), 2026. Published by Science Publishing Group |
Cement, Laser Induced Breakdown Spectroscopy, Laser Energy, Plasma Temperature, Electron Density, Debye Length, Debye Number
λ\nm |
|
|
| /ev | /ev | ∆E/ev |
|---|---|---|---|---|---|---|
421.61 | 1.8* | 9 | 9 | 0 | 2.9398 | 2.9398 |
425.078 | 1.2* | 7 | 7 | 1.5189 | 4.4732 | 2.9543 |
428.24 | 1.21* | 7 | 5 | 2.1759 | 5.0703 | 2.89 |
431.704 | 5.2* | 5 | 5 | 3.5965 | 6.4176 | 2.87 |
E\mj | T\k | \* | |||
|---|---|---|---|---|---|
Fe Iat 421.61nm | Fe I at 425.078nm | Fe I at 428.24nm | Fe I at 431.704nm | ||
10 | 5606 | 3 | 3.08 | 2.89 | 2.83 |
15 | 5873 | 3.1 | 3.2 | 2.96 | 2.9 |
20 | 6140 | 3.2 | 3.23 | 3.03 | 2.97 |
25 | 6173 | 3.3 | 3.24 | 3.046 | 2.97 |
30 | 6273 | 3.32 | 3.27 | 3.06 | 2.99 |
32 | 6342 | 3.37 | 3.29 | 3.08 | 3.01 |
T\k | \* | \nm | ||||||
|---|---|---|---|---|---|---|---|---|
Fe I at 421.61nm | Fe I at 425.078nm | Fe I at 428.24nm | Fe I at 431.704nm | Fe I at 421.61nm | Fe I at 425.078nm | Fe I at 428.24nm | Fe I at 431.704nm | |
5606 | 3 | 3.08 | 2.89 | 2.83 | 29.8 | 29.5 | 30.4 | 30.8 |
5873 | 3.1 | 3.2 | 2.96 | 2.9 | 30.1 | 29.6 | 30.8 | 31.1 |
6140 | 3.2 | 3.23 | 3.03 | 2.97 | 30.3 | 30.1 | 31.1 | 31.4 |
6173 | 3.3 | 3.24 | 3.04 | 2.98 | 29.9 | 30.2 | 31.1 | 31.5 |
6273 | 3.32 | 3.27 | 3.06 | 2.99 | 30 | 30.3 | 31.3 | 31.7 |
6342 | 3.37 | 3.29 | 3.08 | 3.01 | 30 | 30.3 | 31.4 | 31.7 |
T\k |
| |||
|---|---|---|---|---|
Fe I at 421.61nm | Fe I at 425.078nm | Fe I at 428.24nm | Fe I at431.704nm | |
5606 | 3.34 | 3.29 | 3.4 | 3.44 |
5873 | 3.52 | 3.46 | 3.60 | 3.64 |
6140 | 3.70 | 3.69 | 3.81 | 3.84 |
6173 | 3.68 | 3.71 | 3.83 | 3.87 |
6273 | 3.75 | 3.78 | 3.91 | 3.96 |
6342 | 3.79 | 3.83 | 3.96 | 4.01 |
LIBS | Laser Induced Breakdwn Spectroscopy |
Nd:YAG | Neodymium - doped Yttrium Aluminum Garnet |
NIST | National Institute of Standards and Technology |
CCD | Charge-Coupled Device |
| Electron Temperature |
Electron Density | |
Debye Length | |
| Debye Number |
| [1] | Altaf A Mohamed, Abdelmoneim Awadelgied, Use laser induced breakdown spectroscopy in detection of heavy metals contents in Sudanese cement, International Journal of Physics and Applications (2022), |
| [2] | Qin et al. Proteome Science 2013, 11:12 |
| [3] | Sergio Musazzi, Umberto Perini, Laser-Induced Breakdown Spectroscopy. Theory and Applications, springer nature, 2014. |
| [4] | Gondal, M. A., Hussain, T., Yamani, Z. H. et al. Determination of Toxic Metals in Petroleum, Cultivated Land and Ore Samples Using Laser-Induced Breakdown Spectroscopy. Bull Environ Contam Toxicol 78, 270–274 (2007). |
| [5] | Gupta, A. K., Srivastava, Y., & Mishra, P. (EdsNovel Techniques for Food Quality Analysis and Safety: Fundamentals, Scope, Feasibility, and Challenges (1st ed.). CRC Press.). (2026). |
| [6] | R. S. Harmon& R. E. Russo, Laser-Induced Breakdown Spectroscopy, Treatise on Geochemistry (Second Edition), 2014, |
| [7] | M. Capitelli, A. Casavola, G. Colonna & A. De Giacomo, Laser-induced plasma expansion: theoretical and experimental aspects, Spectrochimica Acta Part B: Atomic Spectroscopy, (2004), |
| [8] | Altaf Alsaid Mohamed Abdalgader, Abdelmoneim Awadelgied. Studying the Effect of Delay Time on Intensity of Laser Induced Breakdown Spectroscopy Technique Using Mas Cement Sample. World Journal of Applied Physics. Vol. 7, No. 1, 2022, pp. 11-15. |
| [9] | Hussain, T., Gondal, M. A., Yamani, Z. H. et al. Measurement of Nutrients In Green House Soil With Laser Induced Breakdown Spectroscopy. Environ Monit Assess 124, 131–139 (2007). |
| [10] | Syed Kifayat Hussain Shah, Javed Iqbal, Pervaiz Ahmad, et al, Laser induced breakdown spectroscopy methods and applications: A comprehensive review, Radiation Physics and Chemistry, 2019, |
| [11] | Salih, Fatima H.; Mahdi, Shaimaa S.; and Ali, Alaa H. (2025) "Employment of Laser Induced Breakdown Spectroscopy to Determine Elements of Human Hair," Baghdad Science Journal: Vol. 22: Iss. 3, Article 20. |
| [12] | Marc N. Fiddler, Israel Begashaw, Matthew A. Mickens et al. Laser Spectroscopy for Atmospheric and Environmental Sensing. Sensors 2009, 9, 10447-10512; |
| [13] |
Muhammad FAHAD, Sajad ALI, Yaseen IQBAL. Plasma diagnostics by optical emission spectroscopy on manganese ore in conjunction with XRD, XRF and SEM-EDS [J]. Plasma Science and Technology, 2019, 21(8): 85507-085507.
https://doi.org/10.1088/2058-6272/ab1977 (2019), 8, 085507. |
| [14] | Moros J& Laserna J. Laser-Induced Breakdown Spectroscopy (LIBS) of Organic Compounds: A Review. Applied Spectroscopy. 2019; 73(9): 963-1011. |
| [15] | Baida M. Ahmed, Plasma Parameters Generated from Iron Spectral Lines byUsing LIBS Technique, IOP Conf. Ser.: Mater. Sci. Eng. 928 072096 (2020). |
| [16] | T. Hussain et al Determination of plasma temperature and electron density of iron in iron slag samples using laser induced breakdown spectroscopy, 2016, IOP Conf. Ser.: Mater. Sci. Eng. 146 012017. |
| [17] | Ashwin P. Rao, Mark Gragston, Anil K. Patnaik, et al, Measurement of electron density and temperature from laser-inducednitrogen plasma at elevated pressure (1–6 bar), Optics Express,(2019), Vol. 27, Issue 23, pp. 33779-33788. |
| [18] | Asokan Ajith, Mohanachandran Nair Sindhu Swapna, Humberto Cabrera and Sankaranarayana Iyer Sankararaman, Comprehensive Analysis of Copper Plasma: A Laser-Induced Breakdown Spectroscopic Approach. photonics, (2023), 10, 199. |
| [19] | D. M. Goebel and I.Katz. fundamenatals of electric propulsion: Ion and Hall thrsters, 1st ed. hoboken, NJ, USA: John Wiley & Sons, 2008, |
| [20] | Gibbon, P. Introduction to Plasma Physics. In Proceedings of the 2014 CASCERN Accelerator School: Plasma Wake Acceleration, Geneva, Switzerland, 23–29 November 2014; pp. 51–65. |
APA Style
Abdalgader, A. A. M. (2026). Characterization of Plasma in Laser-Induced Breakdown Spectroscopy Through Fe I Spectral Lines Electron Temperature, Electron Density, Debye Length, and Debye Number. American Journal of Physics and Applications, 14(5), 91-98. https://doi.org/10.11648/j.ajpa.20261405.12
ACS Style
Abdalgader, A. A. M. Characterization of Plasma in Laser-Induced Breakdown Spectroscopy Through Fe I Spectral Lines Electron Temperature, Electron Density, Debye Length, and Debye Number. Am. J. Phys. Appl. 2026, 14(5), 91-98. doi: 10.11648/j.ajpa.20261405.12
@article{10.11648/j.ajpa.20261405.12,
  author = {Altaf Alsaid Mohamed Abdalgader},
  title = {Characterization of Plasma in Laser-Induced Breakdown Spectroscopy Through Fe I Spectral Lines Electron Temperature, Electron Density, Debye Length, and Debye Number},
  journal = {American Journal of Physics and Applications},
  volume = {14},
  number = {5},
  pages = {91-98},
  doi = {10.11648/j.ajpa.20261405.12},
  url = {https://doi.org/10.11648/j.ajpa.20261405.12},
  eprint = {https://article.sciencepublishinggroup.com/pdf/10.11648.j.ajpa.20261405.12},
  abstract = {Cement is a widely used hydraulic binder composed primarily of calcium, silicon, aluminum, and iron oxides. This present work examines the plasma characteristics of cement sample through the analysis of neutral iron (Fe I) emission lines recorded using, laser-induced breakdown spectroscopy (LIBS). A Q-switched Nd: YAG laser, was used for plasma generation operating at a wavelength of 266 nm, with a pulse duration of 8 ns and a repetition rate of 10 Hz. The laser pulse energy was varied from 10 to 32 mJ. Emission features from Several neutral and ionic species were identified in the cement plasma, Four Fe I spectral lines were then used to estimate the electron temperature and electron density from the spectroscopic measurements at different laser pulse energies, and 200 ns delay. The Debye length and Debye number were subsequently calculated from the obtained plasma parameters. The results showed that increasing the laser pulse energy enhanced the plasma emission intensity and affected the plasma parameters. The obtained results demonstrate the applicability of Fe I spectral lines for characterizing the plasma generated from cement using LIBS and provide insight into the fundamental plasma properties under different laser excitation energies.},
 year = {2026}
}
TY  - JOUR
T1  - Characterization of Plasma in Laser-Induced Breakdown Spectroscopy Through Fe I Spectral Lines Electron Temperature, Electron Density, Debye Length, and Debye Number
AU  - Altaf Alsaid Mohamed Abdalgader
Y1  - 2026/11/19
PY  - 2026
N1  - https://doi.org/10.11648/j.ajpa.20261405.12
DO  - 10.11648/j.ajpa.20261405.12
T2  - American Journal of Physics and Applications
JF  - American Journal of Physics and Applications
JO  - American Journal of Physics and Applications
SP  - 91
EP  - 98
PB  - Science Publishing Group
SN  - 2330-4308
UR  - https://doi.org/10.11648/j.ajpa.20261405.12
AB  - Cement is a widely used hydraulic binder composed primarily of calcium, silicon, aluminum, and iron oxides. This present work examines the plasma characteristics of cement sample through the analysis of neutral iron (Fe I) emission lines recorded using, laser-induced breakdown spectroscopy (LIBS). A Q-switched Nd: YAG laser, was used for plasma generation operating at a wavelength of 266 nm, with a pulse duration of 8 ns and a repetition rate of 10 Hz. The laser pulse energy was varied from 10 to 32 mJ. Emission features from Several neutral and ionic species were identified in the cement plasma, Four Fe I spectral lines were then used to estimate the electron temperature and electron density from the spectroscopic measurements at different laser pulse energies, and 200 ns delay. The Debye length and Debye number were subsequently calculated from the obtained plasma parameters. The results showed that increasing the laser pulse energy enhanced the plasma emission intensity and affected the plasma parameters. The obtained results demonstrate the applicability of Fe I spectral lines for characterizing the plasma generated from cement using LIBS and provide insight into the fundamental plasma properties under different laser excitation energies.
VL  - 14
IS  - 5
ER  -
Laser Institute, Sudan University of Science and Technology, Khartoum, Sudan
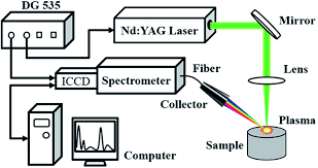
Figure 1. Schematic diagram of the LIBS setup.
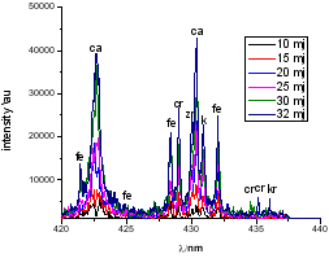
Figure 2. LIBS spectra by different laser energy.
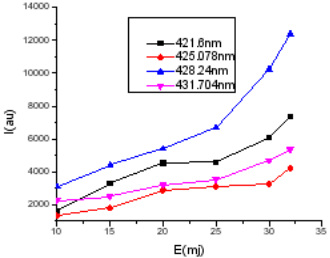
Figure 3. Variation of Plasma intensity with laser pulse energy at Fe I spectral lines.
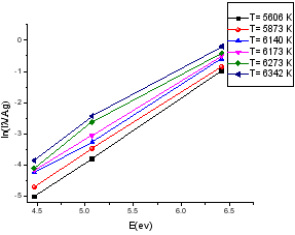
Figure 4. Electron temperatures at different laser pulse energy.
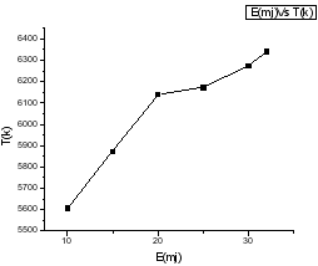
Figure 5. Dependence of electron temperature on laser energy variation.
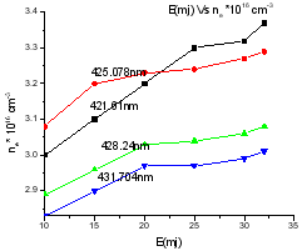
Figure 6. Dependence electron density of laser pulse energy.
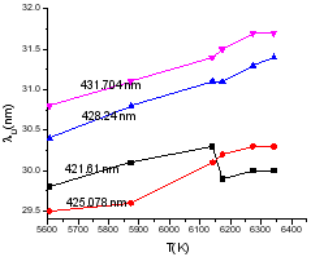
Figure 7. Debye length variation by electrons temperature.
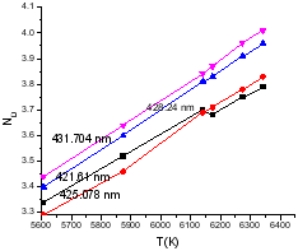
Figure 8. Debye number dependence on electron temperature.

Information



 Share This Article
 Twitter
 Linked In
 Facebook

 Copy
 Download